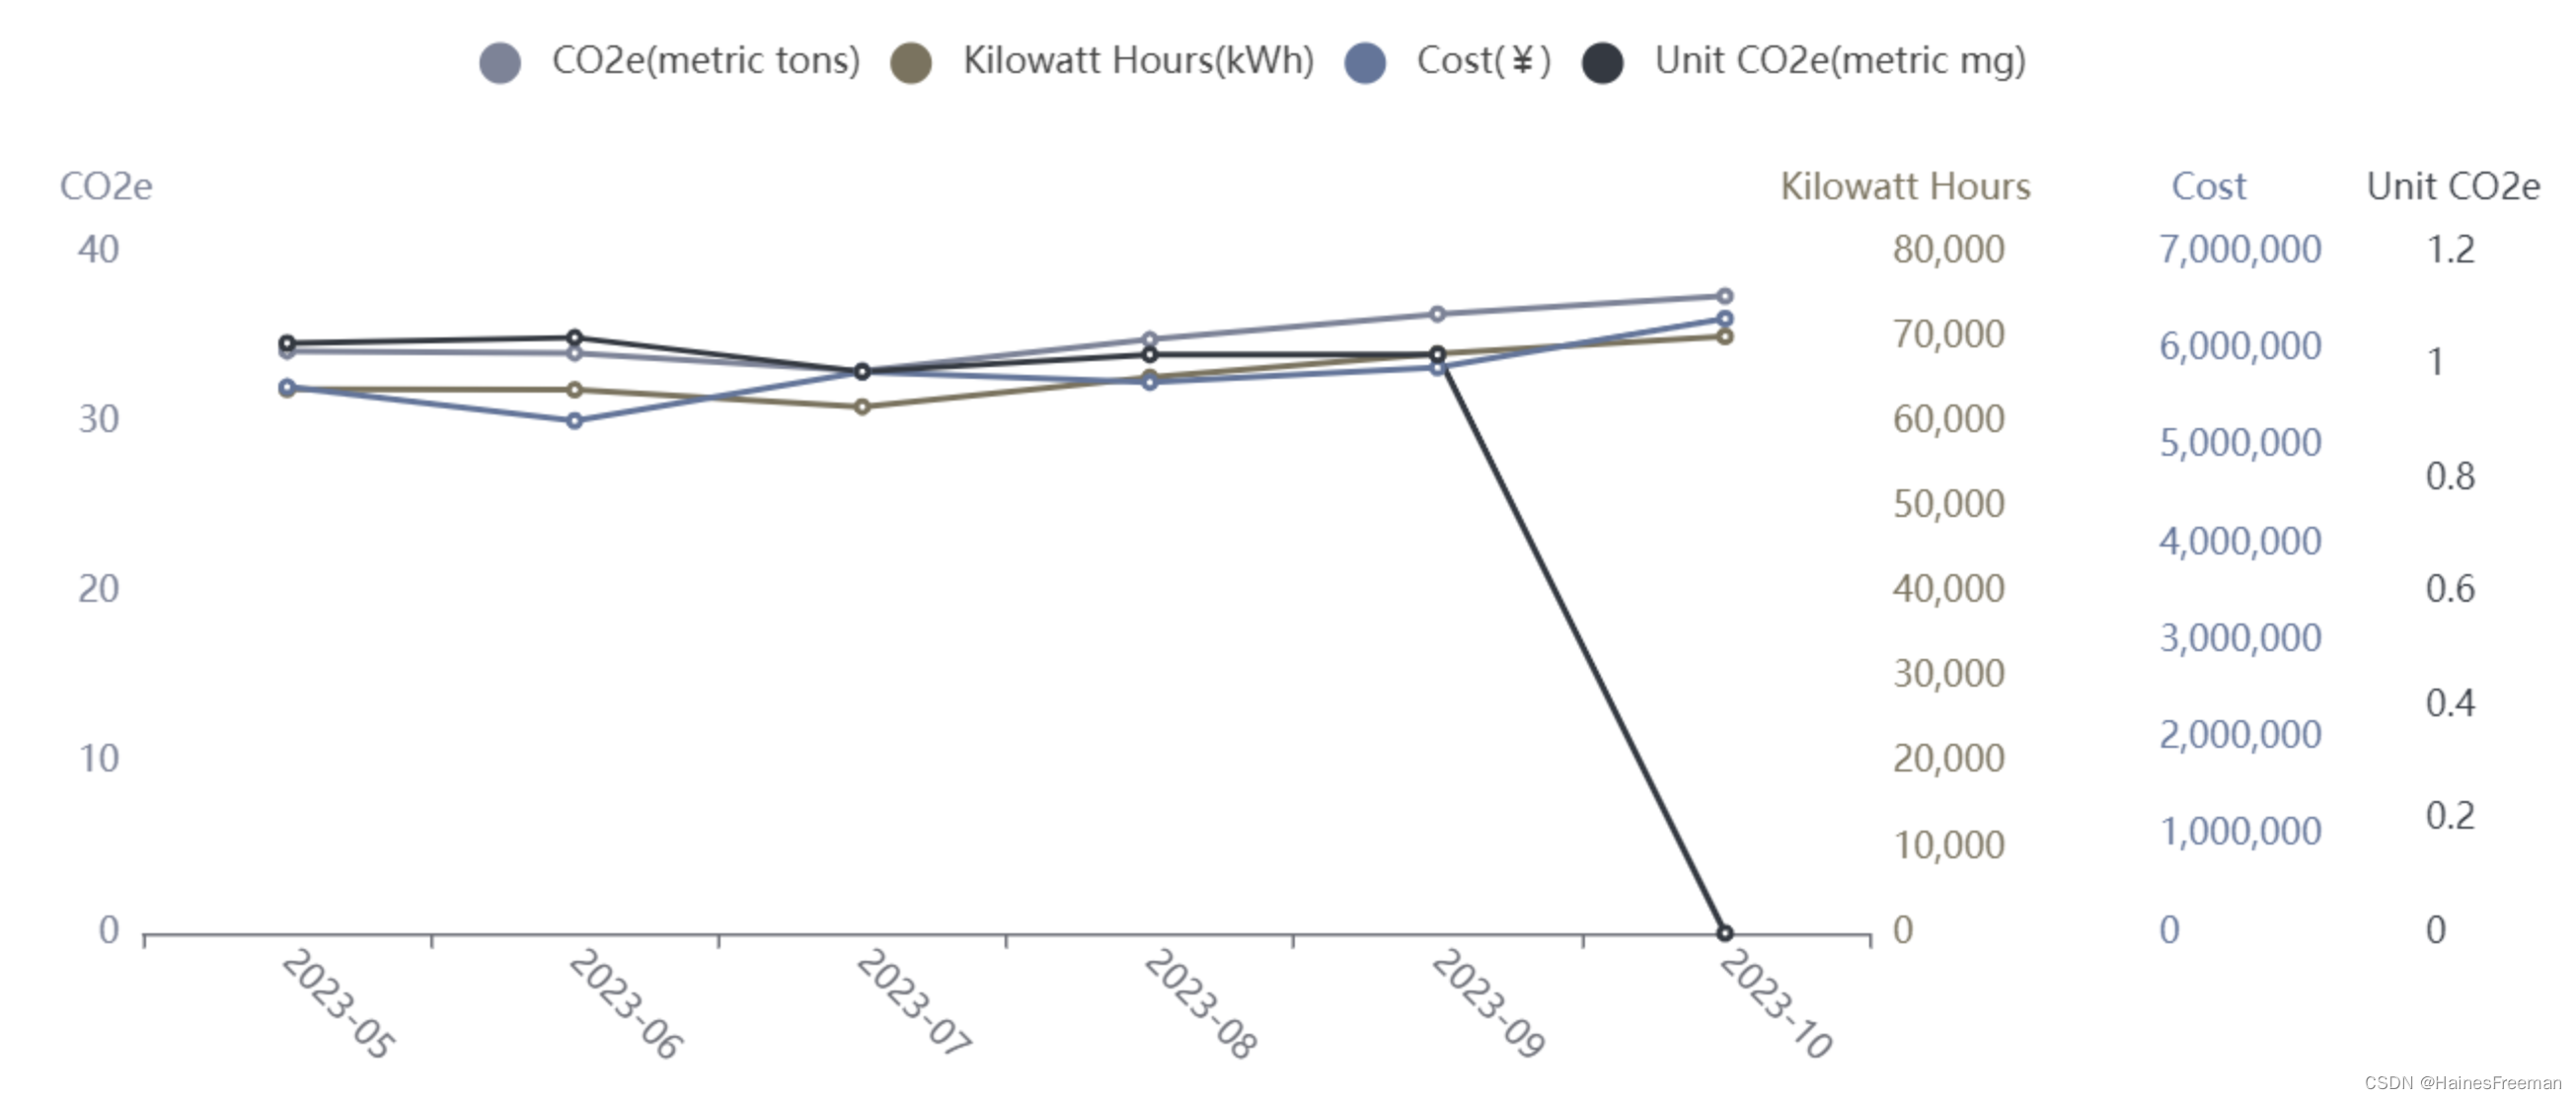
代码:
<template>
  <div>
    <el-row class="actually" style="padding-top:10px;height: 420px;">
      <div style="font-size: 14px; font-weight: bold; margin: 0 10px 0 5px; display: inline-block">
        Cloud Usage
      </div>
      <span style="font-size: 12px; line-height: 20px">Date: {{ formlist.startdate.slice(0, 10) }}~{{
        formlist.endate.slice(0, 10) }}</span>
      <div v-show="empty" v-loading="showCloudUsageLoading">
        <div id="usage" style="height: 400px"></div>
      </div>
      <div v-show="!empty" class="tabempty" style="height: 420px; line-height: 420px">
        <p>No Data</p>
      </div>
    </el-row>
  </div>
</template>

<script type="text/ecmascript-6">
import { dateFormat } from "@/utils/time";
export default {
  name: "usage",
  props: ['formlist', 'monthData'],
  filters: {
    divnum(val) { //数字每三位进行逗号分割
      if (val) {
        let str = val.toString(); //转换为字符串
        let reg = str.indexOf(".") > -1 ? /(\d)(?=(\d{3})+\.)/g : /(\d)(?=(?:\d{3})+$)/g; //定义正则类型
        return str.replace(reg, "$1,");
      } else {
        return '0';
      }
    },
    divtime(val) { //日期格式转换
      if (val) {
        return dateFormat(val, "yyyy-MM-dd");
      } else {
        return '';
      }
    },
  },
  data() {
    return {
      type: '',
      empty: true,
      showCloudUsageLoading: true,
    };
  },
  watch: {
    monthData(newVal, oldVal) {
      if (newVal) {
        this.showCloudUsageLoading = false
        this.creatactualbar();
      }
    }
  },
  mounted() {
  },
  methods: {
    // 自定义升序比较函数
    compareDates(a, b) {
      const dateA = new Date(a.startDate);
      const dateB = new Date(b.startDate);
      if (dateA < dateB) {
        return -1;
      } else if (dateA > dateB) {
        return 1;
      }
      return 0;
    },
    /*绘制折线图表*/
    creatactualbar() {
      let chartDom = document.getElementById('usage');
      let myChart = this.$echarts.init(chartDom);
      let option = {
        color: ["#7B8399", "#7B735D", "#5F769C", "#333942"],
        tooltip: {
          trigger: 'axis',
          formatter: function (params) {
            let tooltip = params[0].name + '<br>';
            for (let i = 0; i < params.length; i++) {
              let seriesName = params[i].seriesName;
              let seriesValue = params[i].value;
              if (option.yAxis[i + 1].show) { // 判断y轴是否显示
                tooltip += seriesName + ':' + seriesValue + '<br>';
              }
            }
            return tooltip;
          }
        },
        legend: {
          x: 'center',
          y: '6%',
          data: [
            { name: 'CO2e(metric tons)', icon: 'circle' },
            { name: 'Kilowatt Hours(kWh)', icon: 'circle' },
            { name: 'Cost(¥)', icon: 'circle' },
            { name: 'Unit CO2e(metric mg)', icon: 'circle' },
          ],
          textStyle: {
            color: "#444444",
            fontsize: 25
          },
          selected: {
            'CO2e': false,
            'Kilowatt Hours': true,
            'Cost': true,
            'Unit CO2e': false,
          }
        },
        grid: {
          top: '25%',
          left: '45',
          right: '100',
          bottom: '5%',
          containLabel: true,
          splitArea: {
            show: true,
            interval: 'auto' // 设置网格区域的间隔
          }
        },
        xAxis: {
          type: 'category',
          boundaryGap: true,
          data: [],
          axisLabel: {
            interval: 0,
            rotate: -45
          }
        },
        yAxis: [
          {
            type: 'value',
            name: 'CO2e',
            nameTextStyle: {
              padding: [0, 0, 0, -25]
            },
            axisLine: {
              lineStyle: {
                color: '#7B8399'
              }
            },
            splitLine: {
              show: false
            },
            splitNumber: 5,
            axisTick: {
              inside: true,
              length: 10
            },
          },
          {
            type: 'value',
            name: 'Kilowatt Hours',
            nameTextStyle: {
              padding: [0, 0, 0, 25]
            },
            axisLine: {
              lineStyle: {
                color: '#7B735D'
              }
            },
            splitLine: {
              show: false
            },
            splitNumber: 5,
            axisLabel: {
              formatter: '{value}'
            },
            axisTick: {
              inside: true,
              length: 10
            },
            offset: 0,
            position: 'center',
          },
          {
            type: 'value',
            name: 'Cost',
            nameTextStyle: {
              padding: [0, 0, 0, 50]
            },
            axisLine: {
              lineStyle: {
                color: '#5F769C'
              }
            },
            splitLine: {
              show: false
            },
            splitNumber: 5,
            axisLabel: {
              formatter: '{value}'
            },
            axisTick: {
              inside: true,
              length: 10
            },
            offset: 60,
            position: 'center',
          },
          {
            type: 'value',
            name: 'Unit CO2e',
            nameTextStyle: {
              padding: [0, 0, 0, 35]
            },
            axisLine: {
              lineStyle: {
                color: '#333942'
              }
            },
            splitLine: {
              show: false
            },
            splitNumber: 5,
            axisLabel: {
              formatter: '{value}'
            },
            offset: 150,
            position: 'center',
            axisTick: {
              inside: true,
              length: 10
            }
          }
        ],
        series: [
          {
            name: 'CO2e(metric tons)',
            type: 'line',
            data: [],
            yAxisIndex: 0
          },
          {
            name: 'Kilowatt Hours(kWh)',
            type: 'line',
            data: [],
            yAxisIndex: 1
          },
          {
            name: 'Cost(¥)',
            type: 'line',
            data: [],
            yAxisIndex: 2
          },
          {
            name: 'Unit CO2e(metric mg)',
            type: 'line',
            data: [],
            yAxisIndex: 3
          }
        ]
      };
      // 处理数据
      const startDates = this.monthData.map(item => item.date)
      const co2es = this.monthData.map(item => item.co2e)
      const khs = this.monthData.map(item => item.KH)
      const costs = this.monthData.map(item => item.cost)
      const units = this.monthData.map(item => item.totalUnitCo2e)
      // 按天查詢需要隱藏UnitCo2e line
      let deepCopyOption = JSON.parse(JSON.stringify(option))
      let count = 0
      for (let i = 0; i < units.length; i++) {
        if (units[i] === "") {
          ++count;
        }
      }
      if (count !== 0) {
        // deepCopyOption.tooltip.formatter = '{b}' + '<br>' + '{a0}:{c0}' + '<br>' + '{a1}:{c1}' + '<br>' + '{a2}:{c2}';
        deepCopyOption.color.pop();
        deepCopyOption.legend.data.pop();
        deepCopyOption.yAxis.pop();
        deepCopyOption.series.pop();
      }
      // x轴
      deepCopyOption.xAxis.data = startDates
      // y轴 - CO2e
      deepCopyOption.series[0].data = co2es
      // y轴 - Kilowatt Hours
      deepCopyOption.series[1].data = khs
      // y轴 - Cost
      deepCopyOption.series[2].data = costs
      // y轴 - Unit Co2e
      if (count === 0) deepCopyOption.series[3].data = units

      deepCopyOption && myChart.setOption(deepCopyOption);
      // 添加legendselectchanged事件处理函数(兼容点击图例name不隐藏问题)

      myChart.on('legendselectchanged', function (params) {
        let selected = params.selected;
        let yAxis = deepCopyOption.yAxis;
        const name = {
          0: 'CO2e(metric tons)',
          1: 'Kilowatt Hours(kWh)',
          2: 'Cost(¥)',
          3: 'Unit CO2e(metric mg)',
        }
        let offsetStep = 90; // 每个y轴的偏移值步长
        let totalOffset = 0; // 总偏移值
        for (let i = 0; i < yAxis.length; i++) {
          let yAxisName = name[i];
          yAxis[i].show = selected[yAxisName]; // 根据图例的选中状态设置Y轴的显示和隐藏
          if (yAxis[i].show && i !== 0) {
            yAxis[i].offset = totalOffset;
            totalOffset += offsetStep;
          } else {
            yAxis[i].offset = 0;
          }
        }
        myChart.setOption(deepCopyOption);
      })
    }
  }
}
</script>

