目录
写在前面:
结果显示:
代码:
写在前面:
“PyQt5日周月K线纵向对齐显示”,将分三篇博文描述
1 数据处理。将数据处理成适合图形显示的格式。(已写,请看往期博文)
2 显示工具开发。用pyqtgraph开发。(已写,请看往期博文)
3 聚焦某段图形
结果显示:
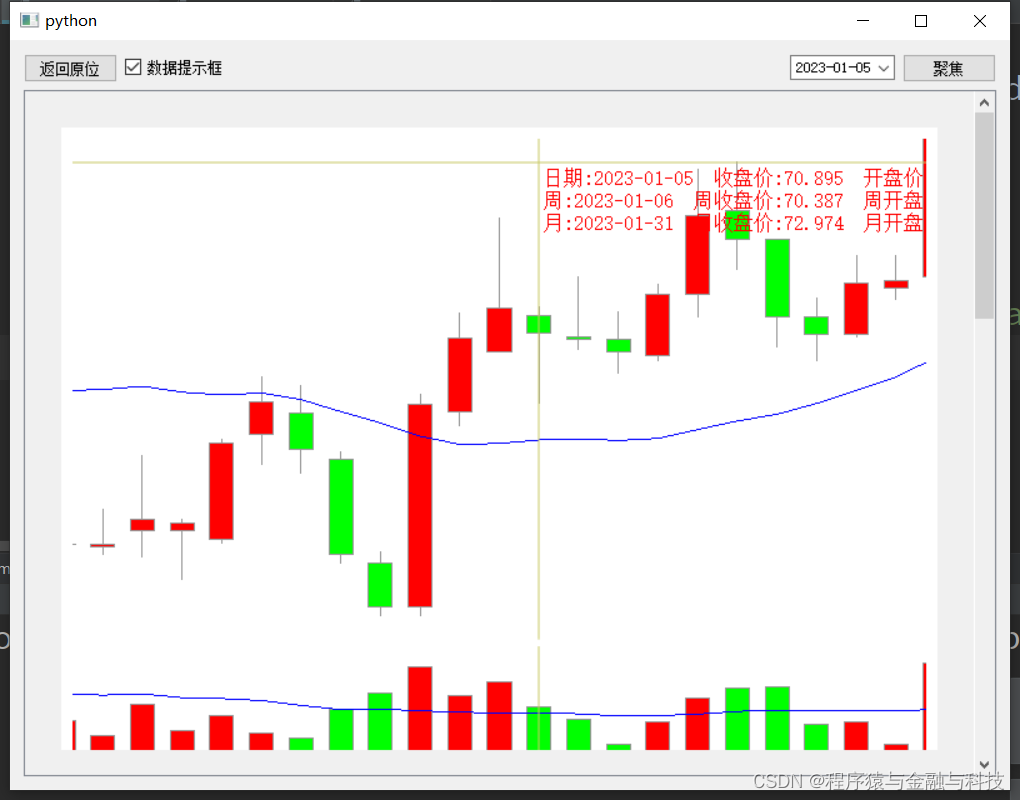
选择2023年1月5日聚焦,图形会将2023年1月5日的数据移到中心位置,并放大显示
代码:
聚焦的代码 在 def focus_location(self,left_x:int,right_x:int,y_data:List)中,计算要聚焦数据要显示的横坐标范围和纵坐标范围,在ViewBox中重绘
整体代码
import sys
import pandas as pd
import talib
from typing import Dict,List
from PyQt5 import QtCore,QtWidgets,QtGui
import pyqtgraph as pg
pg.setConfigOption('background','w')
pg.setConfigOption('foreground','k')
class CandlestickItem(pg.GraphicsObject):
def __init__(self, data):
pg.GraphicsObject.__init__(self)
self.data = data ## data must have fields: time, open, close, min, max
self.generatePicture()
def generatePicture(self):
## pre-computing a QPicture object allows paint() to run much more quickly,
## rather than re-drawing the shapes every time.
self.picture = QtGui.QPicture()
p = QtGui.QPainter(self.picture)
p.setPen(pg.mkPen('d'))
# w = (self.data[1][0] - self.data[0][0]) / 3.
w = 0.3
for (t, open, close, min, max) in self.data:
p.drawLine(QtCore.QPointF(t, min), QtCore.QPointF(t, max))
if open < close:
p.setBrush(pg.mkBrush('r'))
else:
p.setBrush(pg.mkBrush('g'))
p.drawRect(QtCore.QRectF(t-w, open, w * 2, close - open))
p.end()
def paint(self, p, *args):
p.drawPicture(0, 0, self.picture)
def boundingRect(self):
## boundingRect _must_ indicate the entire area that will be drawn on
## or else we will get artifacts and possibly crashing.
## (in this case, QPicture does all the work of computing the bouning rect for us)
return QtCore.QRectF(self.picture.boundingRect())
class VOLtickItem(pg.GraphicsObject):
def __init__(self, data):
pg.GraphicsObject.__init__(self)
self.data = data ## data must have fields: time,open,close, vol
self.generatePicture()
def generatePicture(self):
self.picture = QtGui.QPicture()
p = QtGui.QPainter(self.picture)
p.setPen(pg.mkPen('d'))
# w = (self.data[1][0] - self.data[0][0]) / 3.
w = 0.3
for (t,open,close, vol) in self.data:
if open < close:
p.setBrush(pg.mkBrush('r'))
else:
p.setBrush(pg.mkBrush('g'))
p.drawRect(QtCore.QRectF(t - w, 0, w * 2, vol))
p.end()
def paint(self, p, *args):
p.drawPicture(0, 0, self.picture)
def boundingRect(self):
## boundingRect _must_ indicate the entire area that will be drawn on
## or else we will get artifacts and possibly crashing.
## (in this case, QPicture does all the work of computing the bouning rect for us)
return QtCore.QRectF(self.picture.boundingRect())
class ExampleWidget(QtWidgets.QWidget):
def __init__(self):
super().__init__()
self.init_data()
self.init_ui()
pass
def init_data(self):
self.v_list = []
self.vline_list = []
self.hline_list = []
self.label_list = []
self.data_list = []
self.show_map: Dict = {}
self.mark_data_map: Dict = {}
self.mark_item_map: Dict = {}
self.hand_check_data: Dict = {}
self.three_df = None
self.graph_type_candle: str = 'candle'
self.graph_type_curve: str = 'curve'
self.graph_type_bar: str = 'bar'
self.tip_show_yeah: bool = False
pass
def init_ui(self):
self.setMinimumWidth(800)
self.setMinimumHeight(600)
origin_btn = QtWidgets.QPushButton('返回原位')
origin_btn.clicked.connect(self.origin_btn_clicked)
self.tip_checkbox = QtWidgets.QCheckBox('数据提示框')
self.tip_checkbox.stateChanged.connect(self.tip_checkbox_stateChanged)
self.focus_point = QtWidgets.QDateEdit()
self.focus_point.setDisplayFormat('yyyy-MM-dd')
self.focus_point.setCalendarPopup(True)
focus_check_btn = QtWidgets.QPushButton('聚焦')
focus_check_btn.clicked.connect(self.focus_check_btn_clicked)
layout1 = QtWidgets.QHBoxLayout()
layout1.addWidget(origin_btn)
layout1.addWidget(self.tip_checkbox)
layout1.addStretch(1)
layout1.addWidget(self.focus_point)
layout1.addWidget(focus_check_btn)
self.pw_layout = QtWidgets.QVBoxLayout()
self.scroll_area = QtWidgets.QScrollArea()
self.scroll_area.setWidgetResizable(True)
self.scroll_area.setVerticalScrollBarPolicy(QtCore.Qt.ScrollBarAlwaysOn)
self.scroll_area.setViewportMargins(20,20,20,20)
layout = QtWidgets.QVBoxLayout()
layout.addLayout(layout1)
layout.addWidget(self.scroll_area)
self.setLayout(layout)
pass
def focus_location(self,left_x:int,right_x:int,y_data:List):
if self.v_list:
v0 = self.v_list[0]
v0.setXRange(min=left_x,max=right_x)
for i,v in enumerate(self.v_list):
y_node = y_data[i]
v.setYRange(min=y_node[0],max=y_node[1])
pass
def restart_init(self):
self.v_list.clear()
self.vline_list.clear()
self.hline_list.clear()
self.label_list.clear()
self.data_list.clear()
self.show_map.clear()
pass
def origin_btn_clicked(self):
if self.v_list:
v0 = self.v_list[0]
v0.enableAutoRange() # 还原到初始状态
pass
def tip_checkbox_stateChanged(self):
if self.tip_checkbox.isChecked():
self.tip_show_yeah = True
else:
self.tip_show_yeah = False
pass
def focus_check_btn_clicked(self):
focus_date_str = self.focus_point.date().toString('yyyy-MM-dd')
cur_i = self.hand_check_data[focus_date_str]
y_data = self.caculate_focus_location_data(cur_i-10, cur_i+10)
self.focus_location(cur_i-10, cur_i+10, y_data)
pass
def caculate_focus_location_data(self,left_x:int,right_x:int)->List:
# 返回每个视图的y数据 日 周 月
three_df = self.three_df.copy()
node_df = three_df.loc[(three_df['row_i']>=left_x) & (three_df['row_i']<=right_x)].copy()
day_y_min = node_df['lowestPrice'].min()
day_y_max = node_df['highestPrice'].max()
day_v_min = 0
day_v_max = node_df['turnoverVol'].max()
week_y_min = node_df['week_low'].min()
week_y_max = node_df['week_high'].max()
week_v_min = 0
week_v_max = node_df['week_turnoverVol'].max()
month_y_min = node_df['month_low'].min()
month_y_max = node_df['month_high'].max()
month_v_min = 0
month_v_max = node_df['month_turnoverVol'].max()
return [[day_y_min,day_y_max],[day_v_min,day_v_max],[week_y_min,week_y_max],[week_v_min,week_v_max],[month_y_min,month_y_max],[month_v_min,month_v_max]]
def set_data(self,data:Dict):
self.restart_init()
self.show_map = data['show_map']
self.data_list = data['data_list']
self.hand_check_data = data['hand_check_data']
self.three_df = data['three_df']
self.fill_viewbox()
pass
def fill_viewbox(self):
pw = pg.GraphicsLayoutWidget(show=False)
h_i = 0
for i,node in enumerate(self.data_list):
'''
height_num
data_list:[
{
type:candle,curve,bar
data:[]
},
{}
]
'''
v = pw.addViewBox(row=i, col=0)
v.setMouseEnabled(x=True, y=False)
v.setAutoVisible(x=False, y=True)
height_num = node['height_num']
node_yMin = node['yMin']
node_yMax = node['yMax']
pw.ci.layout.setRowMinimumHeight(i, height_num)
v.setLimits(yMin=node_yMin, yMax=node_yMax)
h_i += height_num
if i>0:
v.setXLink(self.v_list[0])
node_data_list = node['data_list']
for one in node_data_list:
one_type = one['type']
one_data = one['data']
if one_type == self.graph_type_candle:
candle = CandlestickItem(one_data)
v.addItem(candle)
elif one_type == self.graph_type_curve:
curve = pg.PlotCurveItem(x=one_data['x'],y=one_data['y'],pen=(0,0,255))
v.addItem(curve)
pass
elif one_type == self.graph_type_bar:
bar = VOLtickItem(one_data)
v.addItem(bar)
pass
else:
pass
pass
vLine = pg.InfiniteLine(angle=90, movable=False)
hLine = pg.InfiniteLine(angle=0, movable=False)
label = pg.TextItem()
v.addItem(vLine, ignoreBounds=True)
v.addItem(hLine, ignoreBounds=True)
v.addItem(label, ignoreBounds=True)
v.scene().sigMouseMoved.connect(self.mouseMoved)
self.v_list.append(v)
self.vline_list.append(vLine)
self.hline_list.append(hLine)
self.label_list.append(label)
pass
pw.setFixedHeight(h_i+50)
self.fill_pw_widget(pw)
pass
def fill_pw_widget(self,pw):
# print(pw.width(),pw.height())
# 清空控件
while self.pw_layout.count():
item = self.pw_layout.takeAt(0)
widget = item.widget()
if widget is not None:
widget.deleteLater()
pass
sc_child_widget = self.scroll_area.takeWidget()
if sc_child_widget is not None:
sc_child_widget.deleteLater()
# for item in self.pw_widgets_list:
# self.pw_layout.addWidget(item)
self.pw_layout.addWidget(pw)
one_sc_child_widget = QtWidgets.QWidget()
one_sc_child_widget.setLayout(self.pw_layout)
self.scroll_area.setWidget(one_sc_child_widget)
pass
def mouseMoved(self,evt):
pos = evt
for la in self.label_list:
la.setHtml("")
la.setPos(-1, -1)
for i,v in enumerate(self.v_list):
if v.sceneBoundingRect().contains(pos):
mousePoint = v.mapSceneToView(pos)
index = int(mousePoint.x())
hline = self.hline_list[i]
hline.setPos(mousePoint.y())
for hi,hl in enumerate(self.hline_list):
if hi!=i:
hl.setPos(-1)
pass
for vl in self.vline_list:
vl.setPos(mousePoint.x())
if self.tip_show_yeah and self.show_map.get(str(index)):
node_one = self.show_map[str(index)]
node_str = "<span style='font-size:12pt;color:red'>"
n_i = 1
for k,v in node_one.items():
if n_i%7 == 0:
node_str += f"{k}:{v}<br/>"
else:
node_str += f"{k}:{v} "
n_i += 1
pass
node_str += "</span>"
tip_label = self.label_list[i]
tip_label.setHtml(node_str)
tip_label.setPos(mousePoint.x(),mousePoint.y())
pass
else:
for la in self.label_list:
la.setHtml("")
la.setPos(-1,-1)
pass
break
pass
pass
pass
def temp_000():
junxian = 20
columns_list = ['row_i', 'tradeDate', 'openPrice', 'highestPrice', 'lowestPrice', 'closePrice',
'turnoverVol', 'turnoverValue','ma','vol_ma','value_ma']
file_path = r'E:/temp003/600941.xlsx'
df = pd.read_excel(file_path,engine='openpyxl')
df['row_i'] = [i for i in range(len(df))]
df['o_date'] = pd.to_datetime(df['tradeDate'])
df['ma'] = talib.MA(df['closePrice'], timeperiod=junxian)
df['vol_ma'] = talib.MA(df['turnoverVol'], timeperiod=junxian)
df['value_ma'] = talib.MA(df['turnoverValue'], timeperiod=junxian)
week_group = df.resample('W-FRI', on='o_date')
month_group = df.resample('M', on='o_date')
week_df = week_group.last()
week_df['row_i'] = week_group.last()['row_i']
week_df['openPrice'] = week_group.first()['openPrice']
week_df['lowestPrice'] = week_group.min()['lowestPrice']
week_df['highestPrice'] = week_group.max()['highestPrice']
week_df['turnoverVol'] = week_group.sum()['turnoverVol']
week_df['turnoverValue'] = week_group.sum()['turnoverValue']
week_df = week_df.loc[:, columns_list].copy()
week_df.dropna(axis=0, how='any', subset=['closePrice'], inplace=True)
week_df['ma'] = talib.MA(week_df['closePrice'], timeperiod=junxian)
week_df['vol_ma'] = talib.MA(week_df['turnoverVol'], timeperiod=junxian)
week_df['value_ma'] = talib.MA(week_df['turnoverValue'], timeperiod=junxian)
month_df = month_group.last()
month_df['row_i'] = month_group.last()['row_i']
month_df['openPrice'] = month_group.first()['openPrice']
month_df['lowestPrice'] = month_group.min()['lowestPrice']
month_df['highestPrice'] = month_group.max()['highestPrice']
month_df['turnoverVol'] = month_group.sum()['turnoverVol']
month_df['turnoverValue'] = month_group.sum()['turnoverValue']
month_df = month_df.loc[:, columns_list].copy()
month_df.dropna(axis=0, how='any', subset=['closePrice'], inplace=True)
month_df['ma'] = talib.MA(month_df['closePrice'], timeperiod=junxian)
month_df['vol_ma'] = talib.MA(month_df['turnoverVol'], timeperiod=junxian)
month_df['value_ma'] = talib.MA(month_df['turnoverValue'], timeperiod=junxian)
daily_df = df.loc[:, columns_list].copy()
return daily_df, week_df, month_df
# daily_df.to_excel(r'E:/temp009/day.xlsx',engine='openpyxl')
# week_df.to_excel(r'E:/temp009/week.xlsx',engine='openpyxl')
# month_df.to_excel(r'E:/temp009/month.xlsx',engine='openpyxl')
return daily_df,week_df,month_df
def temp_001(daily_df,week_df,month_df):
week_df.rename(
columns={'row_i': 'week_i', 'tradeDate': 'week_tradeDate', 'closePrice': 'week_close', 'openPrice': 'week_open',
'lowestPrice': 'week_low', 'highestPrice': 'week_high', 'turnoverVol': 'week_turnoverVol',
'turnoverValue': 'week_turnoverValue'}, inplace=True)
month_df.rename(columns={'row_i': 'month_i', 'tradeDate': 'month_tradeDate', 'closePrice': 'month_close',
'openPrice': 'month_open', 'lowestPrice': 'month_low', 'highestPrice': 'month_high',
'turnoverVol': 'month_turnoverVol', 'turnoverValue': 'month_turnoverValue'}, inplace=True)
three_df = pd.merge(daily_df, week_df, how='left', left_on='tradeDate', right_on='week_tradeDate')
three_df.fillna(method='bfill', inplace=True)
three_df = pd.merge(three_df, month_df, how='left', left_on='tradeDate', right_on='month_tradeDate')
three_df.fillna(method='bfill', inplace=True)
# three_df.to_excel(r'E:/temp009/111/three.xlsx',engine='openpyxl')
res_map = {}
for i, row in three_df.iterrows():
row_i = row['row_i']
res_map[str(row_i)] = {
'日期': row['tradeDate'],
'收盘价': row['closePrice'],
'开盘价': row['openPrice'],
'最高价': row['highestPrice'],
'最低价': row['lowestPrice'],
'成交量': row['turnoverVol'],
'成交额': row['turnoverValue'],
'周': row['week_tradeDate'],
'周收盘价': row['week_close'],
'周开盘价': row['week_open'],
'周最高价': row['week_high'],
'周最低价': row['week_low'],
'周成交量': row['week_turnoverVol'],
'周成交额': row['week_turnoverValue'],
'月': row['month_tradeDate'],
'月收盘价': row['month_close'],
'月开盘价': row['month_open'],
'月最高价': row['month_high'],
'月最低价': row['month_low'],
'月成交量': row['month_turnoverVol'],
'月成交额': row['month_turnoverValue']
}
return res_map, three_df
def temp_002(df):
# 生成K线图和成交量柱状图
k_height_num = 400
vol_height_num = 100
candle_data = df.loc[:, ['row_i', 'openPrice', 'closePrice', 'lowestPrice', 'highestPrice']].values.tolist()
curve_data = {
'x': df['row_i'].values.tolist(),
'y': df['ma'].values.tolist()
}
one = {
'height_num': k_height_num,
'yMin': df['lowestPrice'].min(),
'yMax': df['highestPrice'].max(),
'data_list': [
{
'type': 'candle',
'data': candle_data
},
{
'type': 'curve',
'data': curve_data
}
]
}
bar_data = df.loc[:, ['row_i', 'openPrice', 'closePrice', 'turnoverVol']].values.tolist()
curve_data2 = {
'x': df['row_i'].values.tolist(),
'y': df['vol_ma'].values.tolist()
}
two = {
'height_num': vol_height_num,
'yMin': 0,
'yMax': df['turnoverVol'].max(),
'data_list': [
{
'type': 'bar',
'data': bar_data
},
{
'type': 'curve',
'data': curve_data2
}
]
}
return one, two
if __name__ == '__main__':
QtCore.QCoreApplication.setAttribute(QtCore.Qt.HighDpiScaleFactorRoundingPolicy.PassThrough)
app = QtWidgets.QApplication(sys.argv)
main_window = ExampleWidget()
# main_window.show()
# app.exec()
day_df,week_df,month_df = temp_000()
k_tip_map, three_df = temp_001(day_df.copy(),week_df.copy(),month_df.copy())
one,two = temp_002(day_df.copy())
three,four = temp_002(week_df.copy())
five,six = temp_002(month_df.copy())
hand_check_data = {}
for i,row in day_df.iterrows():
hand_check_data[row['tradeDate']] = row['row_i']
base_k_data = {
'show_map': k_tip_map,
'data_list': [one, two, three, four, five, six],
'hand_check_data':hand_check_data,
'three_df':three_df
}
main_window.set_data(base_k_data)
main_window.show()
app.exec()
pass