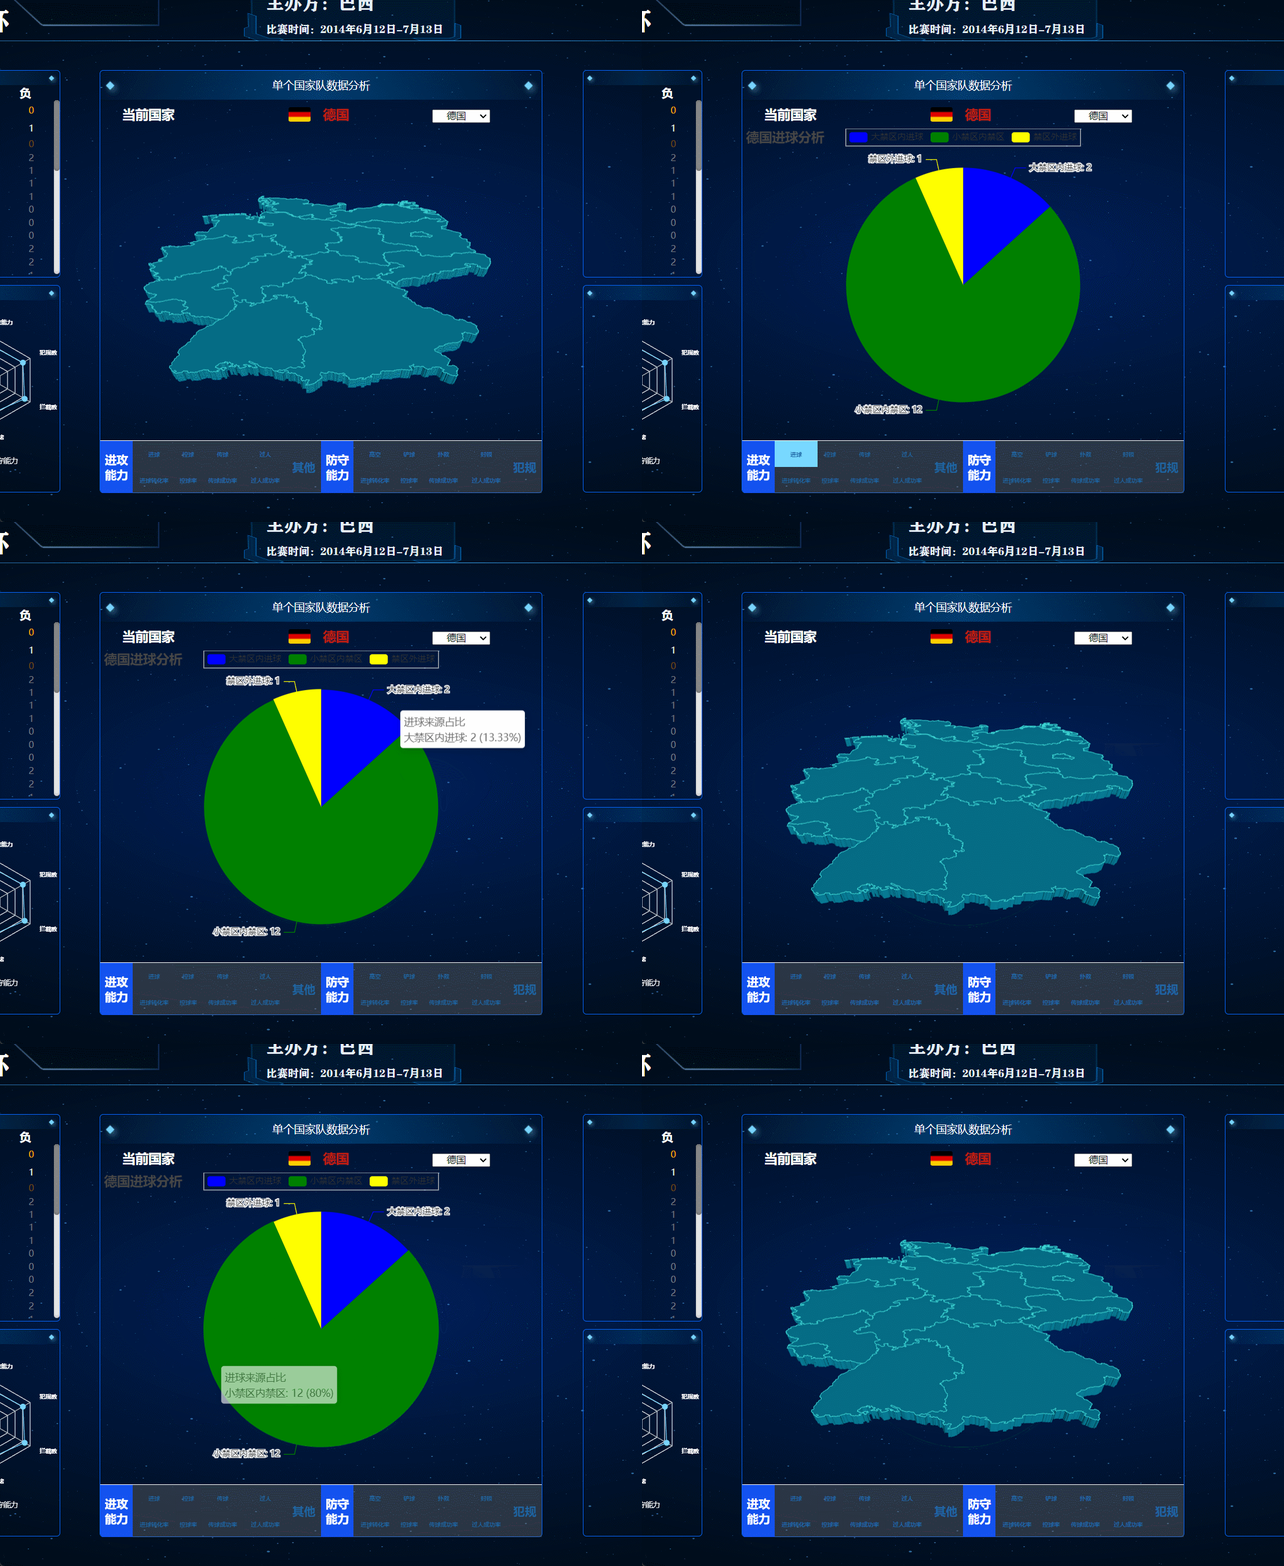
最近在做一个数据可视化大屏的作业,其中需要实现点击不同的按钮,大屏中间内容呈现不同的数据分析图表,页面其他部分不发生改变。之前考虑过复制多个页面然后改变中间的页面,但是这样会导致文件冗余,而且由于静态文件放在不同的文件夹,所以每个复制的页面都要调整文件路径!这将极大地增加工作量。
后面在网上查了好久,终于发现一个可以用a标签的锚点定位来实现这一效果。(当然也有一些用js实现的,但是我还么学,所以只能用这个了,而且这个也是非常方便相较于js)
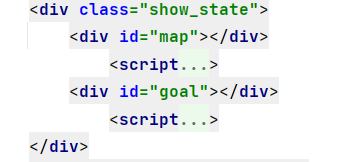
废话不多说先看代码。因为我这里嵌入了echarts代码,可能看上去代码量大了一些。不过核心就是下面这句话:把所有要切换的内容放在一个大的div里面,然后用对应的div放对应的要切换的页面,每个div设置一个id。我这里先展示了2个div,分别是map和goal。
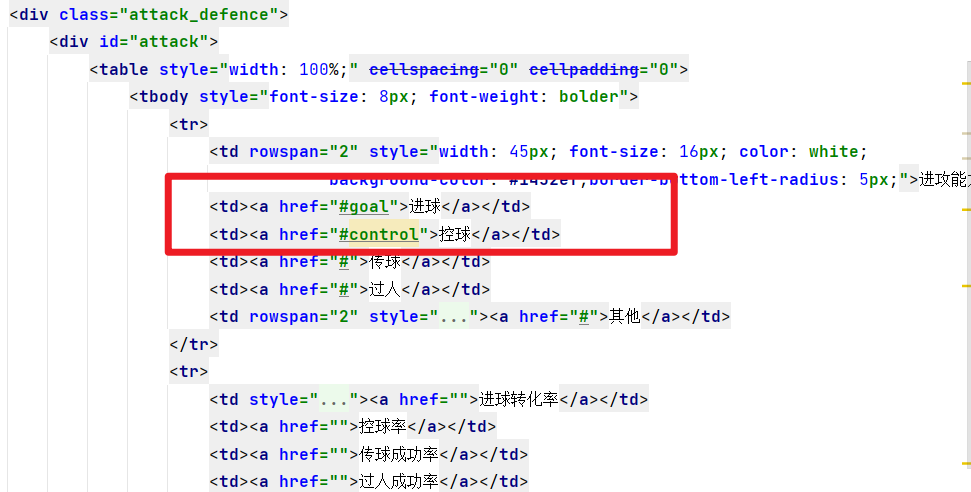
然后再把a标签中的href设置为#加上div的id名即可
 <div class="show_state">
                <div id="map"></div>
                    <script>
        var chart_a89deb8db1fb42ce8c00f23e9a3bb018 = echarts.init(
            document.getElementById('map'), 'white', {renderer: 'canvas'});
        var option_a89deb8db1fb42ce8c00f23e9a3bb018 = {
    "animation": true,
    "animationThreshold": 2000,
    "animationDuration": 1000,
    "animationEasing": "cubicOut",
    "animationDelay": 0,
    "animationDurationUpdate": 300,
    "animationEasingUpdate": "cubicOut",
    "animationDelayUpdate": 0,
    "aria": {
        "enabled": false
    },
    "color": [
        "#5470c6",
        "#91cc75",
        "#fac858",
        "#ee6666",
        "#73c0de",
        "#3ba272",
        "#fc8452",
        "#9a60b4",
        "#ea7ccc"
    ],
    "series": [
        {
            "type": "map3D",
            "map": "china",
            "coordinateSystem": "geo3D",
            "label": {
                "show": false,
                "margin": 8,
                "formatter": function(data){return data.name + ' ' + data.value[2];}
            },
            "data": [],
            "showLegendSymbol": true,
            "emphasis": {}
        }
    ],
    "legend": [
        {
            "data": [
                ""
            ],
            "selected": {},
            "show": false,
            "padding": 5,
            "itemGap": 10,
            "itemWidth": 25,
            "itemHeight": 14,
            "backgroundColor": "transparent",
            "borderColor": "#ccc",
            "borderWidth": 1,
            "borderRadius": 0,
            "pageButtonItemGap": 5,
            "pageButtonPosition": "end",
            "pageFormatter": "{current}/{total}",
            "pageIconColor": "#2f4554",
            "pageIconInactiveColor": "#aaa",
            "pageIconSize": 15,
            "animationDurationUpdate": 800,
            "selector": false,
            "selectorPosition": "auto",
            "selectorItemGap": 7,
            "selectorButtonGap": 10
        }
    ],
    "tooltip": {
        "show": true,
        "trigger": "item",
        "triggerOn": "mousemove|click",
        "axisPointer": {
            "type": "line"
        },
        "showContent": true,
        "alwaysShowContent": false,
        "showDelay": 0,
        "hideDelay": 100,
        "enterable": false,
        "confine": false,
        "appendToBody": false,
        "transitionDuration": 0.4,
        "textStyle": {
            "fontSize": 14
        },
        "borderWidth": 0,
        "padding": 5,
        "order": "seriesAsc"
    },
    "geo3D": {
        "map": "\u5fb7\u56fd",
        "boxWidth": 100,
        "boxHeight": 100,
        "boxDepth": 80,
        "regionHeight": 3,
        "groundPlane": {
            "show": false,
            "color": "#aaa"
        },
        "instancing": false,
        "itemStyle": {
            "color": "rgb(5,101,123)",
            "borderColor": "rgb(62,215,213)",
            "borderWidth": 0.8,
            "opacity": 1
        },
        "label": {
            "show": false,
            "formatter": function(data){return data.name +  + data.value[2];}
        },
        "emphasis": {
            "label": {
                "show": false,
                "color": "#fff",
                "margin": 8,
                "fontSize": 10,
                "backgroundColor": "rgba(0,23,11,0)"
            }
        },
        "light": {
            "main": {
                "color": "#fff",
                "intensity": 1.2,
                "shadow": false,
                "shadowQuality": "high",
                "alpha": 40,
                "beta": 10
            },
            "ambient": {
                "color": "#fff",
                "intensity": 0.3
            },
            "ambientCubemap": {
                "diffuseIntensity": 0.5,
                "specularIntensity": 0.5
            }
        },
        "temporalSuperSampling": {
            "enable": "auto"
        },
        "zlevel": -10,
        "left": "auto",
        "top": "auto",
        "right": "auto",
        "bottom": "auto",
        "width": "auto",
        "height": "auto"
    },
    "title": [
        {
            "show": true,
            "target": "blank",
            "subtarget": "blank",
            "padding": 5,
            "itemGap": 10,
            "textAlign": "auto",
            "textVerticalAlign": "auto",
            "triggerEvent": false
        }
    ]
};
        chart_a89deb8db1fb42ce8c00f23e9a3bb018.setOption(option_a89deb8db1fb42ce8c00f23e9a3bb018);
    </script>
                <div id="goal"></div>
                    <script>
        var chart_eaa4cf6c1af94509803071b8f3657f5b = echarts.init(
            document.getElementById('goal'), 'white', {renderer: 'canvas'});
        var option_eaa4cf6c1af94509803071b8f3657f5b = {
    "animation": true,
    "animationThreshold": 2000,
    "animationDuration": 1000,
    "animationEasing": "cubicOut",
    "animationDelay": 0,
    "animationDurationUpdate": 300,
    "animationEasingUpdate": "cubicOut",
    "animationDelayUpdate": 0,
    "aria": {
        "enabled": false
    },
    "color": [
        "blue",
        "green",
        "yellow"
    ],
    "series": [
        {
            "type": "pie",
            "name": "\u8fdb\u7403\u6765\u6e90\u5360\u6bd4",
            "colorBy": "data",
            "legendHoverLink": true,
            "selectedMode": false,
            "selectedOffset": 10,
            "clockwise": true,
            "startAngle": 90,
            "minAngle": 0,
            "minShowLabelAngle": 0,
            "avoidLabelOverlap": true,
            "stillShowZeroSum": true,
            "percentPrecision": 2,
            "showEmptyCircle": true,
            "emptyCircleStyle": {
                "color": "lightgray",
                "borderColor": "#000",
                "borderWidth": 0,
                "borderType": "solid",
                "borderDashOffset": 0,
                "borderCap": "butt",
                "borderJoin": "bevel",
                "borderMiterLimit": 10,
                "opacity": 1
            },
            "data": [
                {
                    "name": "\u5927\u7981\u533a\u5185\u8fdb\u7403",
                    "value": 2
                },
                {
                    "name": "\u5c0f\u7981\u533a\u5185\u7981\u533a",
                    "value": 12
                },
                {
                    "name": "\u7981\u533a\u5916\u8fdb\u7403",
                    "value": 1
                }
            ],
            "radius": [
                "0%",
                "75%"
            ],
            "center": [
                "50%",
                "50%"
            ],
            "label": {
                "show": true,
                "margin": 8,
                "formatter": "{b}: {c}"
            },
            "labelLine": {
                "show": true,
                "showAbove": false,
                "length": 15,
                "length2": 15,
                "smooth": false,
                "minTurnAngle": 90,
                "maxSurfaceAngle": 90
            },
            "tooltip": {
                "show": true,
                "trigger": "item",
                "triggerOn": "mousemove|click",
                "axisPointer": {
                    "type": "line"
                },
                "showContent": true,
                "alwaysShowContent": false,
                "showDelay": 0,
                "hideDelay": 100,
                "enterable": false,
                "confine": false,
                "appendToBody": false,
                "transitionDuration": 0.4,
                "formatter": "{a} <br/>{b}: {c} ({d}%)",
                "textStyle": {
                    "fontSize": 14
                },
                "borderWidth": 0,
                "padding": 5,
                "order": "seriesAsc"
            },
            "rippleEffect": {
                "show": true,
                "brushType": "stroke",
                "scale": 2.5,
                "period": 4
            }
        }
    ],
    "legend": [
        {
            "data": [
                "\u5927\u7981\u533a\u5185\u8fdb\u7403",
                "\u5c0f\u7981\u533a\u5185\u7981\u533a",
                "\u7981\u533a\u5916\u8fdb\u7403"
            ],
            "selected": {},
            "show": true,
            "padding": 5,
            "itemGap": 10,
            "itemWidth": 25,
            "itemHeight": 14,
            "backgroundColor": "transparent",
            "borderColor": "#ccc",
            "borderWidth": 1,
            "borderRadius": 0,
            "pageButtonItemGap": 5,
            "pageButtonPosition": "end",
            "pageFormatter": "{current}/{total}",
            "pageIconColor": "#2f4554",
            "pageIconInactiveColor": "#aaa",
            "pageIconSize": 15,
            "animationDurationUpdate": 800,
            "selector": false,
            "selectorPosition": "auto",
            "selectorItemGap": 7,
            "selectorButtonGap": 10
        }
    ],
    "tooltip": {
        "show": true,
        "trigger": "item",
        "triggerOn": "mousemove|click",
        "axisPointer": {
            "type": "line"
        },
        "showContent": true,
        "alwaysShowContent": false,
        "showDelay": 0,
        "hideDelay": 100,
        "enterable": false,
        "confine": false,
        "appendToBody": false,
        "transitionDuration": 0.4,
        "textStyle": {
            "fontSize": 14
        },
        "borderWidth": 0,
        "padding": 5,
        "order": "seriesAsc"
    },
    "title": [
        {
            "show": true,
            "text": "\u5fb7\u56fd\u8fdb\u7403\u5206\u6790",
            "target": "blank",
            "subtarget": "blank",
            "padding": 5,
            "itemGap": 10,
            "textAlign": "auto",
            "textVerticalAlign": "auto",
            "triggerEvent": false
        }
    ]
};
        chart_eaa4cf6c1af94509803071b8f3657f5b.setOption(option_eaa4cf6c1af94509803071b8f3657f5b);
    </script>
            </div>
css代码如下。其中最重要的是overflow:hidden这句话,可以隐藏其他没有被切换的代码
/*展示国家地图和数据分析的图表*/
.show_state {
    position: relative;
    width: 100%;
    height: 74%;
    overflow: hidden;   /*很重要,用于隐藏其他要展示的内容*/
}

/*展示国家地图*/
#map {
    position: relative;
    top: -5%;
    width: 100%;
    height: 100%;
}

#goal {
    position: relative;
    top: 15%;
    left: 5%;
    width: 100%;
    height: 100%;
}

