import seaborn as sns
import matplotlib.pyplot as plt

# set_theme设置主题
#sns.set_theme(style="whitegrid") #白色+刻度线,无坐标轴标度
#sns.set_theme(style="white") #白色无刻度线,无坐标轴标度
#sns.set_theme(style="dark") #深色无刻度线,无坐标轴标度
sns.set_theme(style="ticks") #白色无刻度线,有坐标轴标度

# 设置绘图上下文  paper","talk","poster"
sns.set_context("talk",font_scale=1.1)
# palette调色板(离散型)
#sns.palplot(sns.color_palette("hls",10))#普通调色板 rocket_r:热力色  hls:RGB色
#sns.palplot(sns.hls_palette(10,l=6,s=9))#设置参数调色板(RGB色),l=亮度,s=饱和度
#sns.palplot(sns.color_palette("Paired",10))#带相近色调色板


# palette调色板(连续型),
# “xxx” / light_palette :由浅到深
# "xxx_r" / dark_palette :由浅到深
# sns.palplot(sns.color_palette("Blues_r"))
# sns.palplot(sns.light_palette("green"))
# sns.palplot(sns.dark_palette("purple"))

#sns.xkcd_rgb["xxx xxx"] 使用xkcd命名颜色
#plt.plot([0,1],[1,0],sns.xkcd_rgb["pale red"],lw=2)


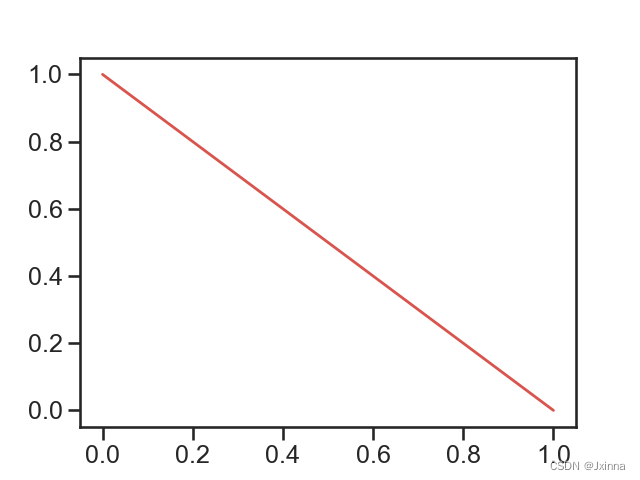
# palette: 传入字典型pal
# pal = dict(boy="red", girl="blue")

### cmap参数:
# Accent, Accent_r, Blues, Blues_r, BrBG, BrBG_r,
# BuGn, BuGn_r, BuPu, BuPu_r, CMRmap, CMRmap_r,
# Dark2, Dark2_r, GnBu, GnBu_r, Greens, Greens_r,
# Greys, Greys_r, OrRd, OrRd_r, Oranges, Oranges_r, PRGn,
# PRGn_r, Paired, Paired_r, Pastel1, Pastel1_r, Pastel2,
# Pastel2_r, PiYG, PiYG_r, PuBu, PuBuGn, PuBuGn_r, PuBu_r,
# PuOr, PuOr_r, PuRd, PuRd_r, Purples, Purples_r, RdBu,
# RdBu_r, RdGy, RdGy_r, RdPu, RdPu_r, RdYlBu, RdYlBu_r,
# RdYlGn, RdYlGn_r, Reds, Reds_r, Set1, Set1_r, Set2,
# Set2_r, Set3, Set3_r, Spectral, Spectral_r, Wistia,
# Wistia_r, YlGn, YlGnBu, YlGnBu_r, YlGn_r, YlOrBr, YlOrBr_r,
# YlOrRd, YlOrRd_r, afmhot, afmhot_r, autumn, autumn_r, binary,
# binary_r, bone, bone_r, brg, brg_r, bwr, bwr_r, cividis,
# cividis_r, cool, cool_r, coolwarm, coolwarm_r, copper,
# copper_r, cubehelix, cubehelix_r, flag, flag_r, gist_earth,
# gist_earth_r, gist_gray, gist_gray_r, gist_heat,
# gist_heat_r, gist_ncar, gist_ncar_r, gist_rainbow,
# gist_rainbow_r, gist_stern, gist_stern_r, gist_yarg,
# gist_yarg_r, gnuplot, gnuplot2, gnuplot2_r, gnuplot_r, gray,
# gray_r, hot, hot_r, hsv, hsv_r, icefire, icefire_r, inferno,
# inferno_r, jet, jet_r, magma, magma_r, mako, mako_r,
# nipy_spectral, nipy_spectral_r, ocean, ocean_r, pink, pink_r,
# plasma, plasma_r, prism, prism_r, rainbow, rainbow_r, rocket,
# rocket_r, seismic, seismic_r, spring, spring_r, summer, summer_r,
# tab10, tab10_r, tab20, tab20_r, tab20b, tab20b_r, tab20c,
# tab20c_r, terrain, terrain_r, twilight, twilight_r,
# twilight_shifted, twilight_shifted_r, viridis, viridis_r, vlag,
# vlag_r, winter, winter_r
import seaborn as sns
import matplotlib.pyplot as plt
# set_context: {paper, notebook, talk, poster}
sns.set_context("talk",font_scale=1.1)


### 回归分析
tips = sns.load_dataset("tips")
tips.head()
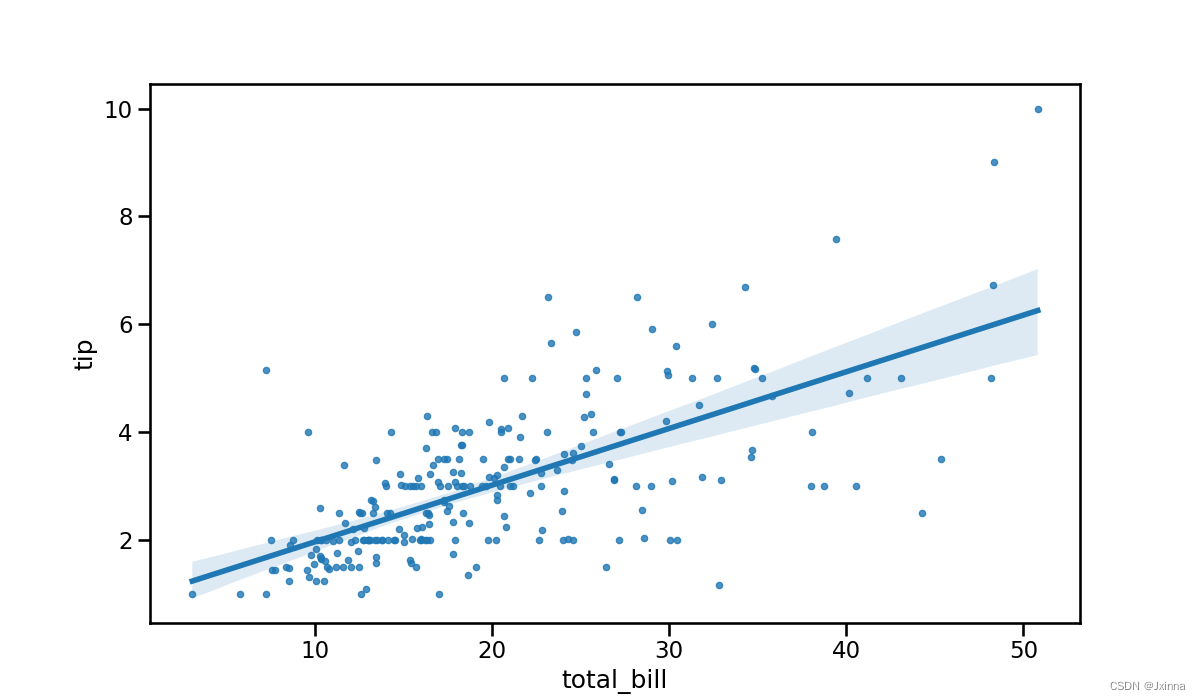
# regplot绘制回归曲线
# scatter_kws={"s": 20}: 设置散点大小
# line_kws={"lw": 4}: 设置回归线宽度
# jitters=0.2: 抖动,设置散点间距离
sns.regplot(x="total_bill", y="tip", data=tips,
            scatter_kws={"s": 20},
            line_kws={"lw": 4})


### 散点图
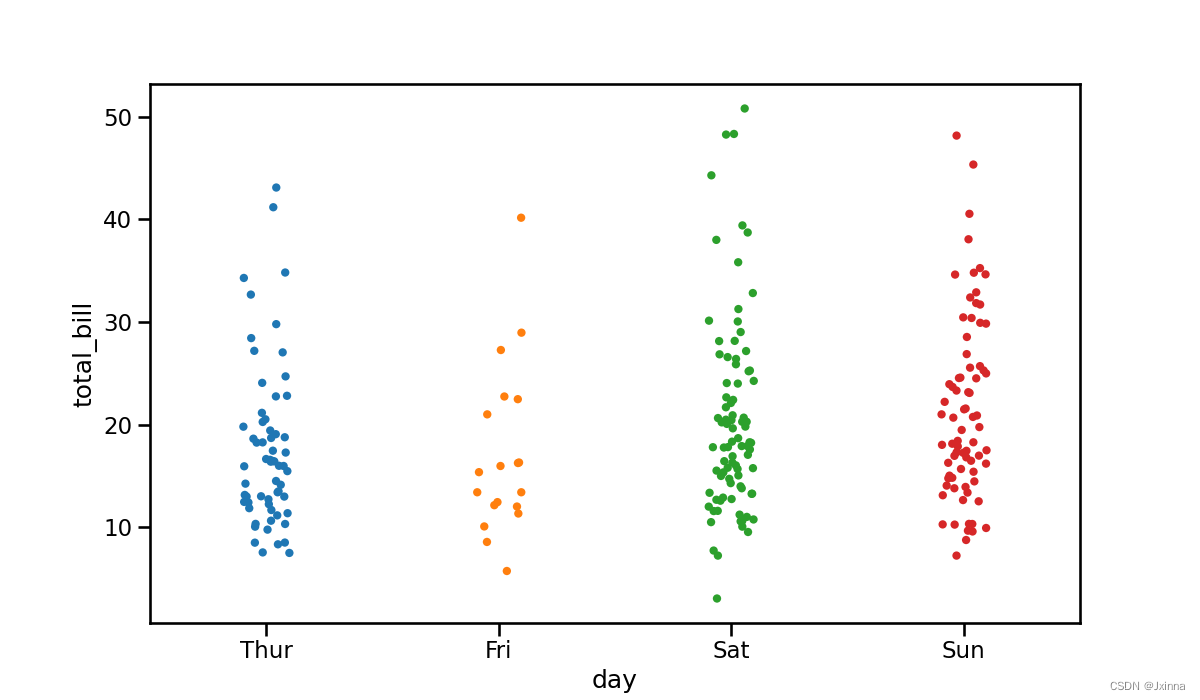
# stripplot绘制散点图
# jitter=True: 抖动,设置散点间距离
ax = sns.stripplot(x="day", y="total_bill",
              data=tips,
              jitter=True,
              size=6)
ax.figure.set_size_inches(12, 7)

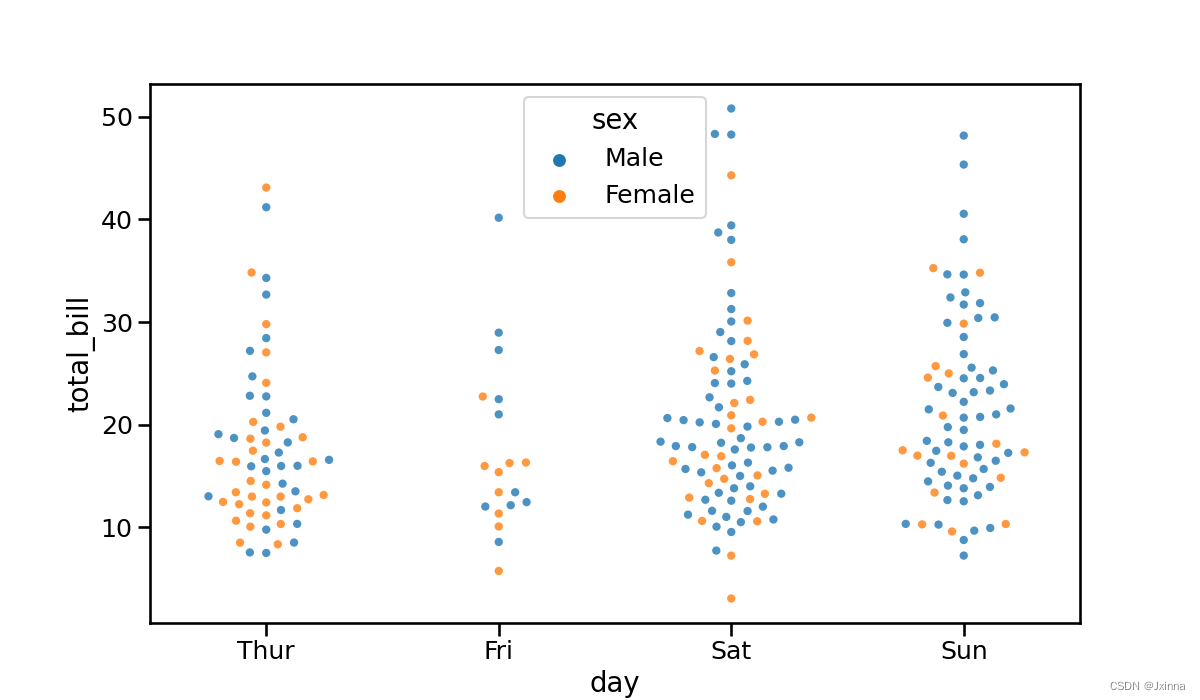
# swarmplot绘制树型散点图
# hue: 加类别
# alpha: 设置透明度
# size: 设置散点大小
ax = sns.swarmplot(x="day", y="total_bill", hue="sex",
                   data=tips,
                   alpha=0.8,
                   size=6)
ax.figure.set_size_inches(12, 7)


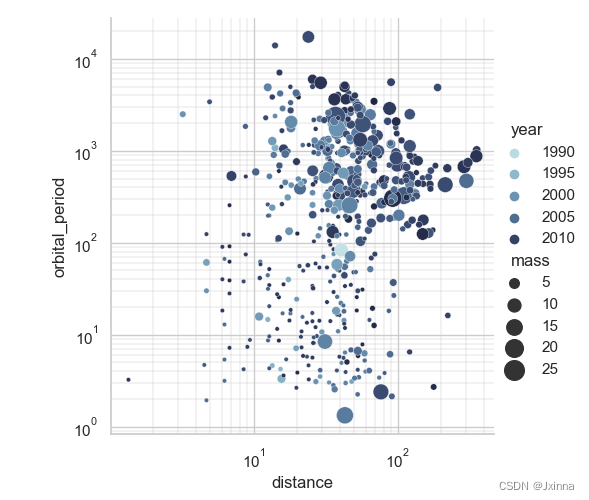
# relplot绘制散点图
sns.set_theme(style="whitegrid")
planets = sns.load_dataset("planets")
# 设置调色板cmap
cmap = sns.cubehelix_palette(rot=-.2, as_cmap=True)
# relplot默认绘制散点图
# kind: 设置散点图类型 scatter、line
g = sns.relplot(data=planets, x="distance", y="orbital_period",
                hue="year",
                size="mass",
                palette=cmap,
                kind='scatter',
                sizes=(10, 200))
# 设置坐标为指数型
g.set(xscale="log", yscale="log")
# 设置辅助线宽
g.ax.xaxis.grid(True, "minor", linewidth=.35)
g.ax.yaxis.grid(True, "minor", linewidth=.35)

# 保存
#plt.savefig("pick.svg",dpi=300)
plt.show()
import numpy as np
import pandas as pd
from pandas import Categorical
import seaborn as sns
import matplotlib.pyplot as plt


### 单变量分析
# 生成1000个正态分布的随机数
x = np.random.normal(size=100)
# displot绘制直方图、Kde(核密度估计)图、ECDF图(经验累积分布函数)
# bins=x: 将直方分为x份(在kind="hist"使用)
# kde=True: 加入核密度曲线(在kind="hist"使用)
# element='step':直方图->阶梯图
# kind="hist", "kde", "ecdf"
# log_scale=10: x轴为10指数形式
# height=x: 设置图像高度
# aspect=1.x: 设置图像比例
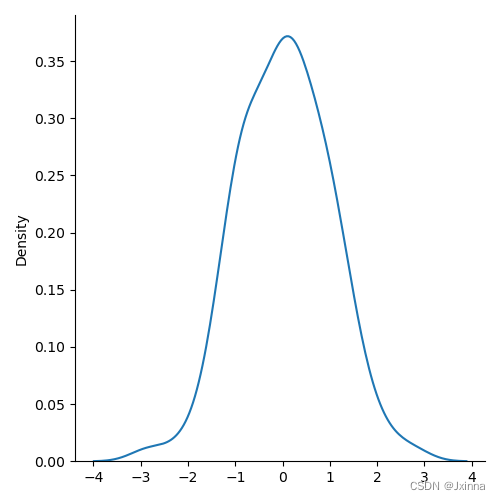
### 绘制kde图
sns.displot(x, kind='kde')

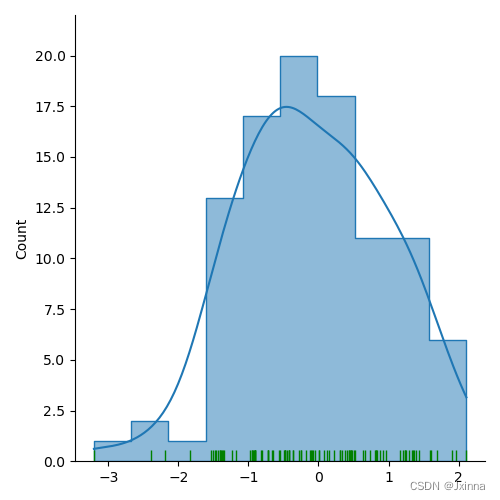
### 绘制直方图+kde图+rug图
# rug=True: 加入 rug图(轴上的垂直线),rug图是在坐标轴上用短线的疏密表示分布的图形
# rug_kws={'color': 'xxx'}: 设置rug图颜色
g = sns.displot(x, bins=10, element='step',
            kde=True,
            rug=True,
            rug_kws={'color': 'g'},
            kind='hist')

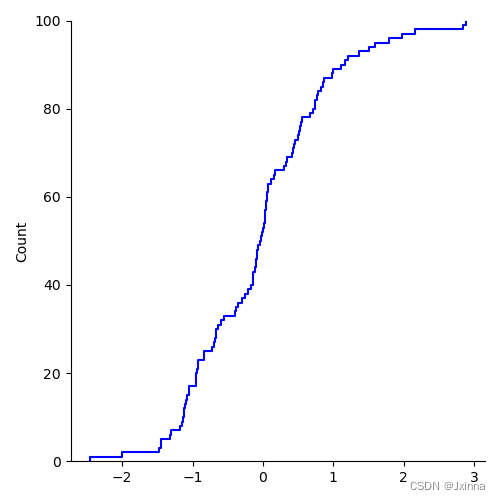
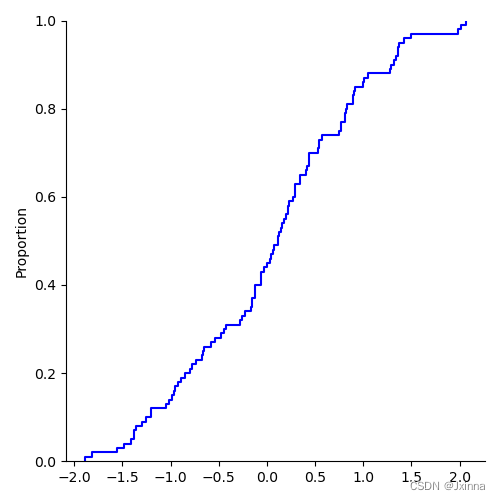
### 绘制ECDF图
# ecdf默认stat为概率密度proportion, stat="count"为累积计数
g = sns.displot(x, kind='ecdf', color='b', stat="count")

plt.show()
import numpy as np
import pandas as pd
from pandas import Categorical
import seaborn as sns
import matplotlib.pyplot as plt

### 双变量分析+单变量分析
rs = np.random.RandomState(11)
x = rs.gamma(2, size=1000)
y = -.5 * x + rs.normal(size=1000)
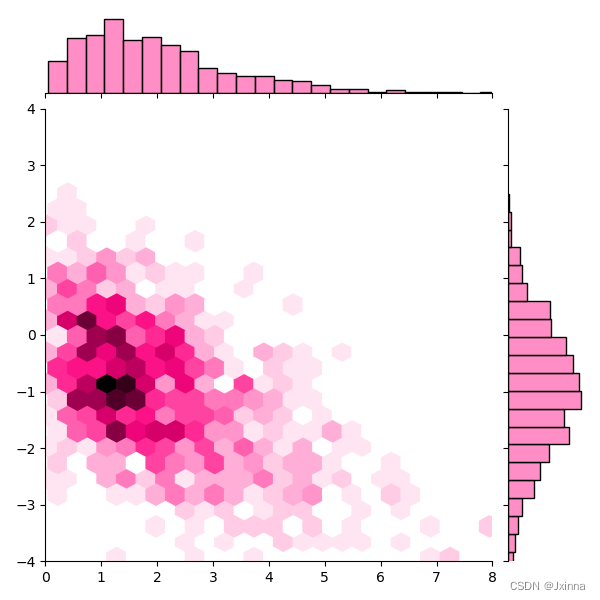
# jointplot绘制多变量图
# kind =
#       "hex": 蜂窝点(附有直方图)
#       "reg": 圆形点(显示分布状态,附带回归曲线),(附有直方图)
#       "resid": 圆形点(显示对称分布状态)
#       "scatter": 散点(附有直方图)
#       "hist": 方格点(附有直方图)
#       "kde": 等高线(附有核密度)
# color = 16进制颜色
sns.axes_style("ticks")
sns.jointplot(x=x, y=y, xlim=[0,8], ylim=[-4,4],
              kind="hex",
              color="#FF69B4")

plt.show()
import numpy as np
import pandas as pd
from pandas import Categorical
import seaborn as sns
import matplotlib.pyplot as plt

### 多变量下的双变量分析+单变量分析
iris = sns.load_dataset("iris")
# 找到异常点
cond = (iris['species'] == 'setosa') & (iris['sepal_width'] < 2.5)
# 剔除异常点后的数据集
iris = iris.loc[~cond]
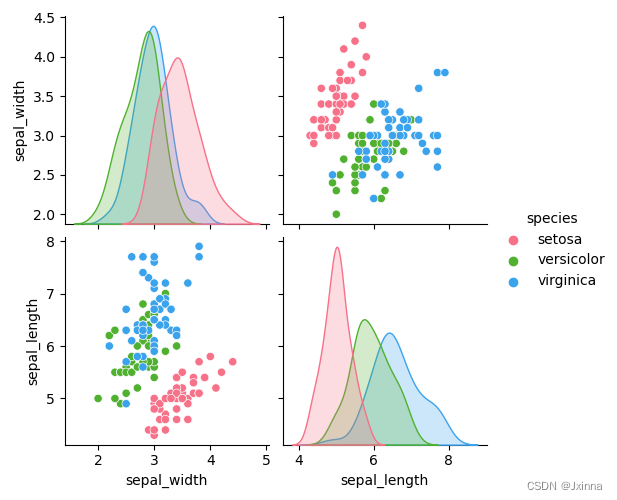
# pairplot绘制不同变量的散点图、直方图
# kind :
#       'scatter': 散点+直方图,
#       'kde': 等值线图+核密度图,
#       'hist': 像素散点+直方图,
#       'reg': 散点加线性回归+直方图
# hue="species": 根据不同类赋予不同的颜色,带类别标签
# palette="husl": 是一个色彩系统
# vars=['', '']: 只显示特定变量的子图
# x_vars=['', ''], y_vars=['', '']: 只显示不同特定变量的子图
sns.pairplot(iris, kind="scatter", hue="species",
             palette="husl",
             vars=['sepal_width', 'sepal_length'])

plt.show()
import numpy as np
import pandas as pd
from pandas import Categorical
import seaborn as sns
import matplotlib.pyplot as plt

### 使用FacetGrid进行多变量分析
tips = sns.load_dataset("tips")
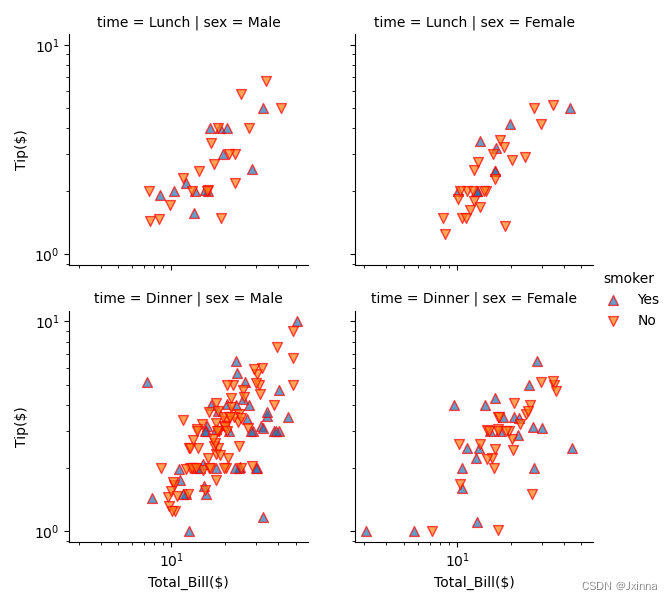
# FacetGrid
# row:  行(子图行数)
# col:  列(子图列数)
# hue:  分类变量
# hue_kws={"marker": "xx"}: 设置分类变量符号样式
g = sns.FacetGrid(tips, col="sex", row="time",
                  hue="smoker",
                  hue_kws={"marker": ["^", "v"]})
# plt.xxx: 指定图类型为xxx
# x, y: 指定x,y轴的变量
# s: 散点大小
# linewidth: 散点边框宽度
# edgecolor: 散点边框颜色
g.map(plt.scatter, "total_bill", "tip",
      alpha=0.7,
      s=50,
      linewidth=1,
      edgecolor="red")
# 设置图例
g.add_legend()
# 设置x、y坐标标签
g.set_axis_labels("Total_Bill($)", "Tip($)")
# 设置坐标范围
g.set(xticks=[10, 30, 50], yticks=[2, 6, 10])
# 设置为指数坐标
g.set(xscale="log", yscale="log")
# 设置子图间隔
g.fig.subplots_adjust(wspace=0.2, hspace=0.2)


# 自行调整数据顺序
days_order = tips.day.value_counts().index
days_order = Categorical(['Thur', 'Fri', 'Sat', 'Sun'])
# size: 大小
# aspect:  宽高比
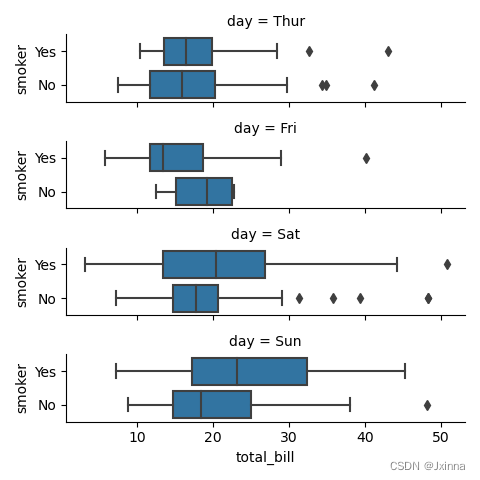
g = sns.FacetGrid(tips, row="day", row_order=days_order,
                  size=1.2,
                  aspect=4)
g.map(sns.boxplot, "total_bill", "smoker")

plt.show()
import numpy as np
import pandas as pd
from pandas import Categorical
import seaborn as sns
import matplotlib.pyplot as plt

### 使用PairGrid进行多变量分析
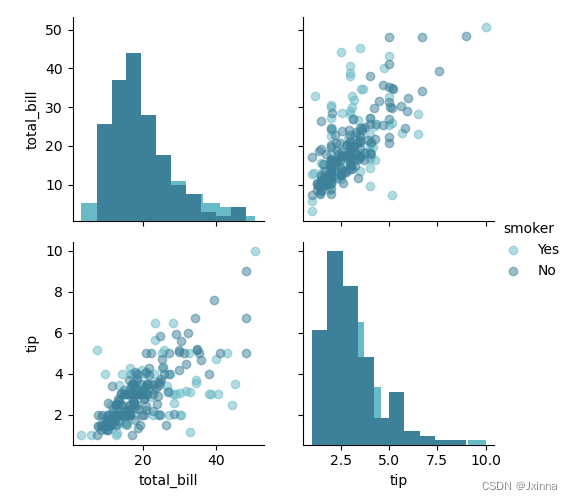
g = sns.PairGrid(tips, vars=["total_bill", "tip"],
                 hue="smoker",
                 palette="GnBu_d")
# map_diag: 对角线绘制直方图
g.map_diag(plt.hist)
# map_offdiag: 非对角线绘制散点图
g.map_offdiag(plt.scatter, alpha=0.5)
# 设置图例
g.add_legend()

plt.show()
import numpy as np
import pandas as pd
import seaborn as sns
import matplotlib.pyplot as plt
sns.set_theme(style="ticks")

### 箱型图、小提琴图、柱状图、点图

tips = sns.load_dataset("tips")
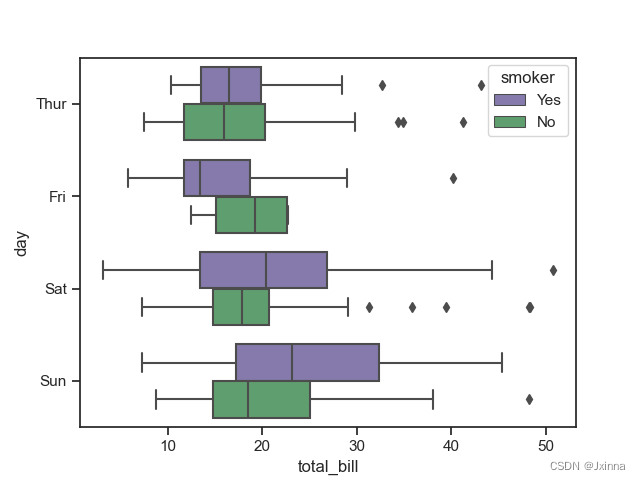
# boxplot绘制箱型图
# orient="h":  设置箱型图的横轴方向
sns.boxplot(x="total_bill", y="day", hue="smoker",
            palette=["m", "g"],
            data=tips,
            orient="h")

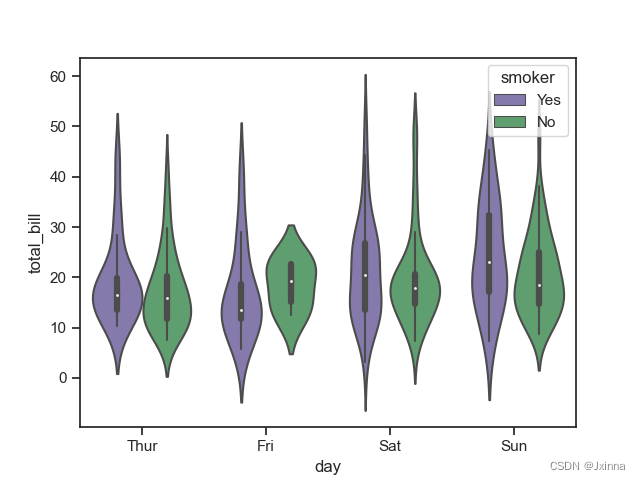
# violinplot绘制小提琴图
# split=True:  是否将每个小提琴图的数据分开绘制
sns.violinplot(x="day", y="total_bill", hue="smoker",
               palette=["m", "g"],
               data=tips)

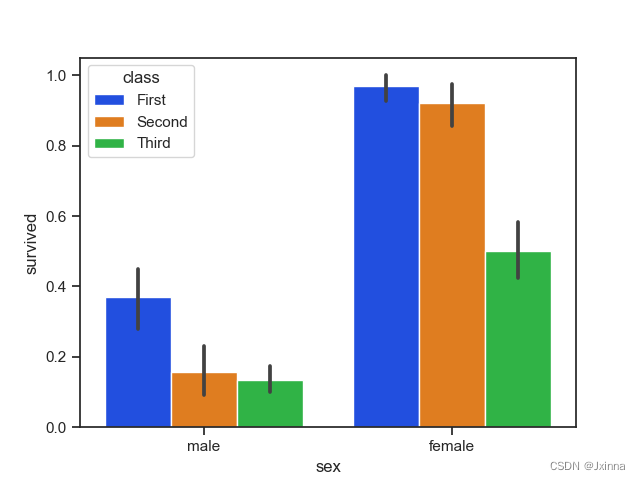
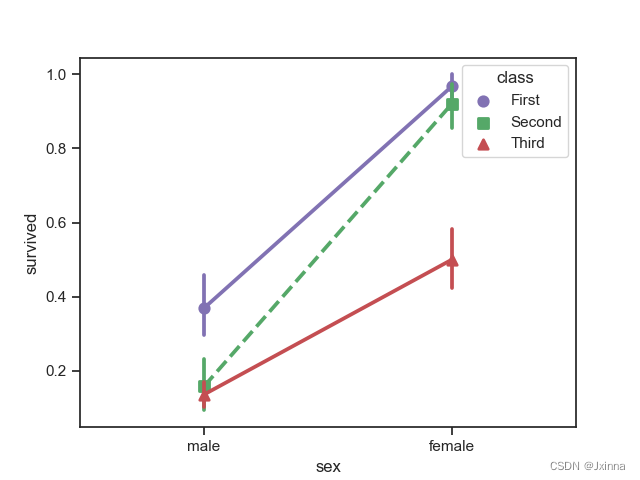
titanic = sns.load_dataset("titanic")
# barplot绘制柱状图
sns.barplot(x="sex", y="survived", hue="class",
            palette="bright",
            data=titanic)

# pointplot绘制点图
# markers: 设置点形状
# linestyles: 设置线形状
sns.pointplot(x="sex", y="survived", hue="class",
              palette={"First": "m", "Second": "g", "Third": "r"},
              data=titanic,
              markers=["o", "s", "^"],
              linestyles=["-", "--", "-"])
import numpy as np
import pandas as pd
from pandas import Categorical
import seaborn as sns
import matplotlib.pyplot as plt
sns.set_theme(style="white")

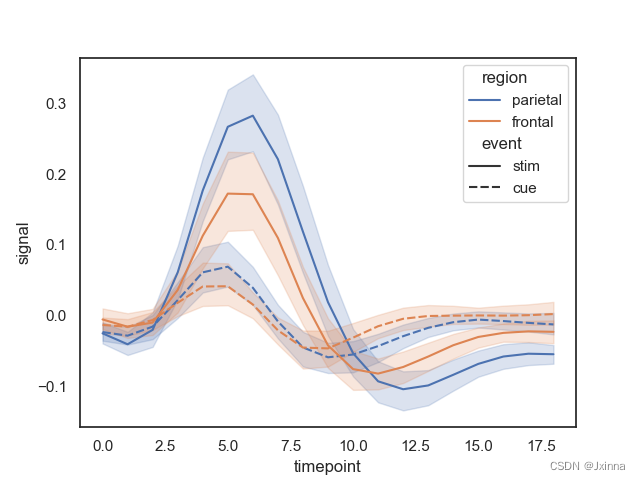
fmri = sns.load_dataset("fmri")
# lineplot绘制带误差带的时间序列图
# lineplot默认estimator="mean",即带误差带
sns.lineplot(data=fmri, x="timepoint", y="signal",
             hue="region",
             style="event")


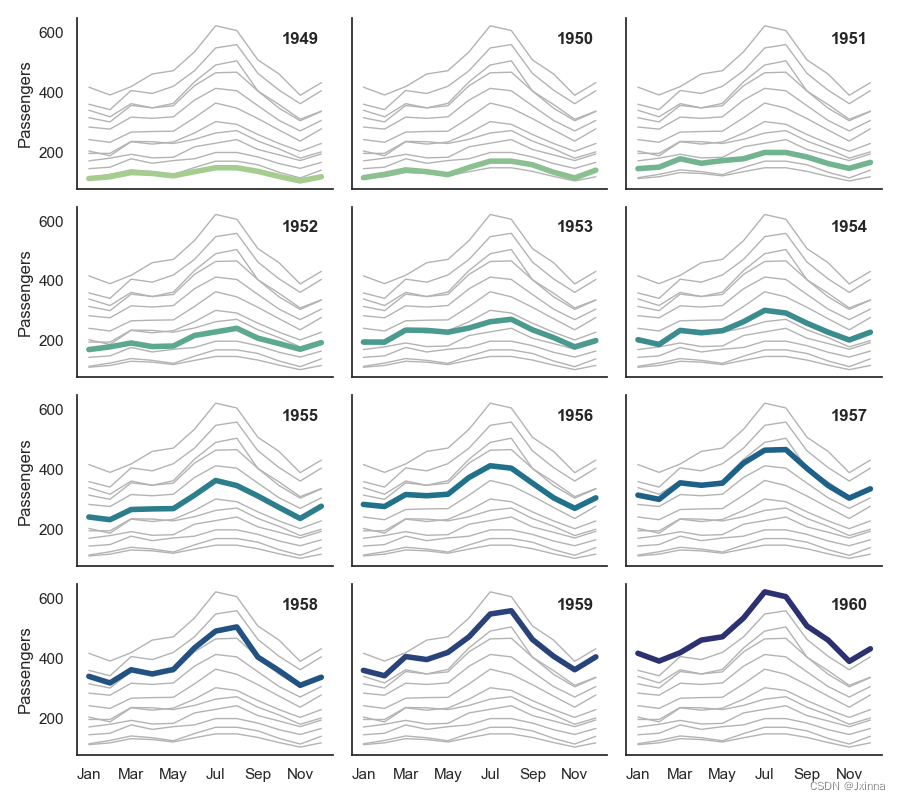
flights = sns.load_dataset("flights")
# relplot+kind="line"绘制折线图
# col_wrap=x: 每行最多显示子图个数为x
# zorder: 子图的绘制顺序
g = sns.relplot(data=flights, x="month", y="passengers",
                col="year", hue="year",
                kind="line", palette="crest",
                linewidth=4, zorder=5,
                col_wrap=3, height=2,
                aspect=1.5, legend=False)
# 遍历year
for year, ax in g.axes_dict.items():
    # ax.text(): 文本注释,只能填写文本
    # ax.arrow(): 箭头标记,不能填写文本
    # ax.annotate(): 箭头注释,在箭头的位置可以填写文本
    # x,y: 注释的坐标位置
    # s: 注释的内容
    # fontweight: 设置文本粗细
    # transform=ax.transAxes: 设置文本位置
    ax.text(x=.8, y=.85, s=year, transform=ax.transAxes, fontweight="bold")
    # estimator=None: 不带误差带
    # units="year": 将每一个year的所有折线图绘制出来
    sns.lineplot(data=flights, x="month", y="passengers",
                 units="year",
                 estimator=None,
                 color=".7",
                 linewidth=1,
                 ax=ax)
# 将x轴的刻度标签的频率降低到原来的1/2,即将原来每个刻度标签的间隔调整为原来的两倍
ax.set_xticks(ax.get_xticks()[::2])
g.set_titles("")
g.set_axis_labels("", "Passengers")
# tight_layout(): 自动调整子图参数
g.tight_layout()


plt.show()
import numpy as np
import pandas as pd
from pandas import Categorical
import seaborn as sns
import matplotlib.pyplot as plt


### 热力图分析
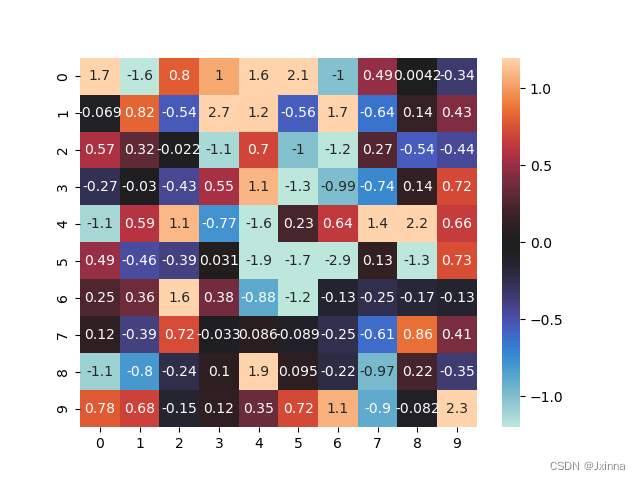
datas = np.random.rand(10, 10)
datae = np.random.randn(10, 10)
# heatmap绘制热力图
# annot=True: 在热力图每个方格写入数据
# vmin: 热力图取值最小值
# vmax: 热力图取值最大值
# center:  热力图中间值
sns.heatmap(datae, annot=True,
            vmin=-1.2,
            vmax=1.2,
            center=0)


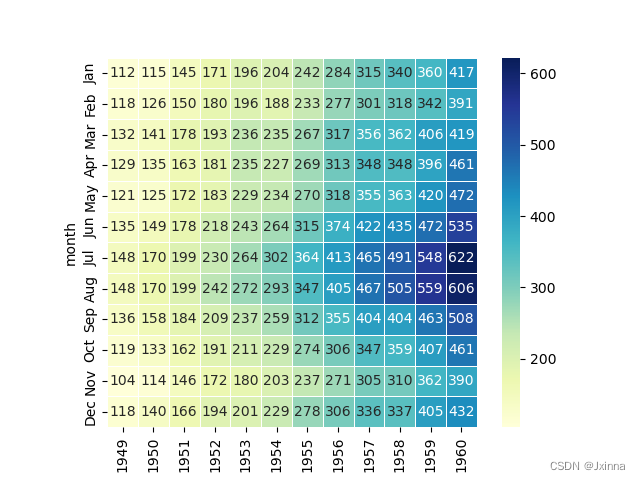
flight = sns.load_dataset("flights")
# pivot
# index: 索引/y
# columns: 列/x
# values: 值
flight = flight.pivot("month", "year", "passengers")
# square=True: 设置每个方格为正方形
# fmt="d": 字符串格式代码
# linewidth: 设置方格间距
# cmap: 设置颜色
ax = sns.heatmap(flight, annot=True, square=True,
                 fmt="d",
                 linewidth=0.5,
                 cmap="YlGnBu")


plt.show()
