1.概述
QwtPlot类是Qwt库中最重要的类之一,用于创建和管理绘图窗口。
QwtPlot类具有以下主要功能:
- 提供一个绘图窗口,可以在其中绘制简单或复杂的二维数据图。
- 支持多种类型的图表,包括曲线图、柱状图、散点图等。
- 能够自定义图表的外观,包括线条颜色、填充颜色、图例等。
- 支持坐标轴的自定义,包括坐标轴标签、刻度间隔、刻度线风格等。
- 提供交互式功能,如放大、缩小、拖动等。
- 支持多个图层,可以在同一个绘图窗口中叠加绘制不同的图表。
- 支持导出图表为图片文件。 使用QwtPlot类,可以轻松地创建和管理绘图窗口,并将数据以图表的形式进行可视化展示。通过QwtPlot类提供的丰富功能,用户可以灵活地配置图表的样式和外观,以满足自己的需求。无论是简单的曲线图还是复杂的多图层图表,QwtPlot类都能提供强大的功能和易用的接口。
2.常用接口介绍
2.1设置标题
void setTitle (const QString &)2.2设置绘图窗口的背景色
void setCanvasBackground (const QBrush &)2.3插入一个图例,并指定其位置
void insertLegend (QwtAbstractLegend *, LegendPosition=QwtPlot::RightLegend, double ratio=-1.0)2.4设置坐标轴的标题
void setAxisTitle (QwtAxisId, const QString &)2.5设置坐标轴的刻度范围和步长
void setAxisScale (QwtAxisId, double min, double max, double stepSize=0)2.6启用或禁用坐标轴自动缩放
void setAxisAutoScale (QwtAxisId, bool on=true)2.7设置坐标轴的最大次刻度线数
void setAxisMaxMinor (QwtAxisId, int maxMinor)2.8设置坐标轴的最大主刻度线数
void setAxisMaxMajor (QwtAxisId, int maxMajor)2.9返回绘图窗口的布局管理器,可以通过该方法来访问和操作图表中的特定元素
QwtPlotLayout * plotLayout ()2.10重新绘制绘图窗口,用于更新图表显示
virtual void replot ()2.11返回图例
QwtAbstractLegend * legend ()3.代码示例
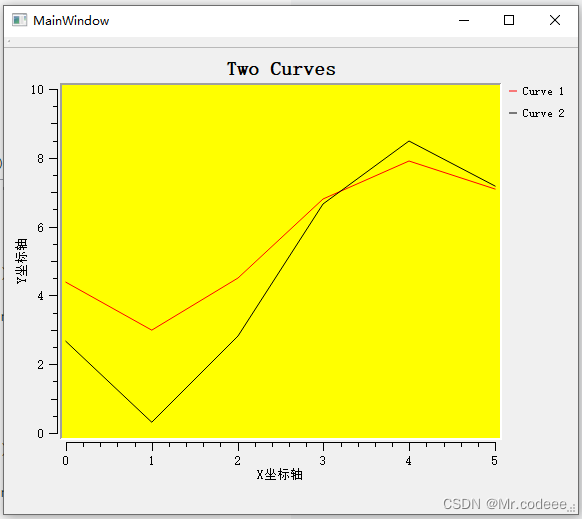
#include "mainwindow.h"
#include "ui_mainwindow.h"
#include "qwt_plot.h"
#include "qwt_plot_curve.h"
#include "qwt_text.h"
#include "qwt_legend.h"

MainWindow::MainWindow(QWidget *parent) :
    QMainWindow(parent),
    ui(new Ui::MainWindow)
{
    ui->setupUi(this);

    QwtPlot *plot = new QwtPlot(QwtText("Two Curves"),this);
    //设置背景色
    plot->setCanvasBackground(QBrush(QColor(Qt::yellow)));

    //添加图例
    QwtLegend *legend = new QwtLegend();
    plot->insertLegend(legend);

    //设置坐标轴标题
    plot->setAxisTitle(QwtAxis::YLeft,QwtText("Y坐标轴"));
    plot->setAxisTitle(QwtAxis::XBottom,QwtText("X坐标轴"));
    plot->setAxisScale(QwtAxis::YLeft, 0, 10);//设置左Y轴范围

    // add curves1
    QwtPlotCurve *curve1 = new QwtPlotCurve( "Curve 1" );
    curve1->setRenderHint( QwtPlotItem::RenderAntialiased );
    curve1->setPen( Qt::red );
    curve1->setLegendAttribute( QwtPlotCurve::LegendShowLine );
    curve1->setYAxis( QwtAxis::YLeft );
    curve1->attach( plot );

    // add curves2
    QwtPlotCurve *curve2 = new QwtPlotCurve( "Curve 2" );
    curve2->setRenderHint( QwtPlotItem::RenderAntialiased );
    curve2->setPen( Qt::black );
    curve2->setLegendAttribute( QwtPlotCurve::LegendShowLine );
    curve2->setYAxis( QwtAxis::YRight );
    curve2->attach( plot );

    //设置数据
    QPolygonF points;
    points << QPointF( 0.0, 4.4 ) << QPointF( 1.0, 3.0 )
           << QPointF( 2.0, 4.5 ) << QPointF( 3.0, 6.8 )
           << QPointF( 4.0, 7.9 ) << QPointF( 5.0, 7.1 );
    curve1->setSamples(points);

    QPolygonF points2;
    points2 << QPointF( 0.0, 4.6 ) << QPointF( 1.0, 3.2 )
           << QPointF( 2.0, 4.7 ) << QPointF( 3.0, 7.0 )
           << QPointF( 4.0, 8.1 ) << QPointF( 5.0, 7.3 );
    curve2->setSamples(points2);

    // finally, refresh the plot
    plot->replot();

    ui->verticalLayout->addWidget(plot);
}

MainWindow::~MainWindow()
{
    delete ui;
}

