效果图 西藏的区域规划以及柱状图
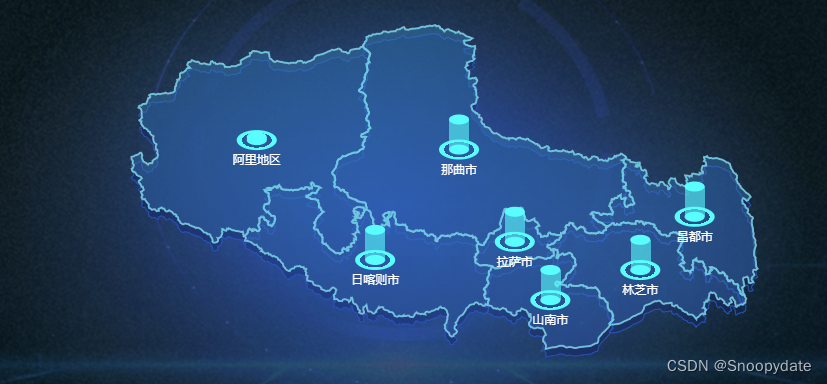
一、下载区域地图的js文件
区域地图可以在中国的区域地图 这里下载
二、实现代码
一个普通的html可以参考
实现广东省的区域地图并标注柱状图
三、vue里具体实现代码
1.做一个有具体宽高的dom
<template>
  <div class="box">
        <div id="centerMap"></div>
  </div>
</template>
    #centerMap{
      width: 100%;
      height: 550px;
    }
2.定义方法
created() {
this.centerChart()
}
centerChart(){
var myChart = echarts.init(document.getElementById('centerMap'));
var option = {}
var geoCoordMap = {
阿里地区: [82.564653, 33.063726],
那曲市: [89.24948, 32.783399],
拉萨市: [91.091762, 30.037072],
日喀则市: [86.477854, 29.498529],
山南市: [92.266609, 28.303935],
林芝市: [95.239298, 29.198982],
昌都市: [97.035183, 30.783725],
}
var customerBatteryCityData = [{
name: "阿里地区",
value: 70
}, {
name: "那曲市",
value: 701
}, {
name: "拉萨市",
value: 702
}, {
name: "日喀则市",
value: 703
}, {
name: "山南市",
value: 704
}, {
name: "林芝市",
value: 705
}, {
name: "昌都市",
value: 706
}]
// 获取json格式的数据 地图数据
$.getJSON('/西藏自治区.json', function(geoJson) {
echarts.registerMap('xizang', geoJson);
var option = {
// backgroundColor: '#131C38',
tooltip: {
trigger: 'item',
show: true,
enterable: true,
textStyle: {
fontSize: 20,
color: '#fff'
},
backgroundColor: 'rgba(0,2,89,0.8)',
formatter: '{b}<br />{c}'
},
geo: [{
map: 'xizang',
aspectScale: 0.9,
roam: false, // 是否允许缩放
zoom: 1.2, // 默认显示级别
layoutSize: '95%',
layoutCenter: ['55%', '50%'],
itemStyle: {
normal: {
areaColor: {
type: 'linear-gradient',
x: 0,
y: 400,
x2: 0,
y2: 0,
colorStops: [{
offset: 0,
color: 'rgba(37,108,190,0.3)' // 0% 处的颜色
}, {
offset: 1,
color: 'rgba(15,169,195,0.3)' // 50% 处的颜色
}],
global: true // 缺省为 false
},
borderColor: '#4ecee6',
borderWidth: 1
},
emphasis: {
areaColor: {
type: 'linear-gradient',
x: 0,
y: 300,
x2: 0,
y2: 0,
colorStops: [{
offset: 0,
color: 'rgba(37,108,190,1)' // 0% 处的颜色
}, {
offset: 1,
color: 'rgba(15,169,195,1)' // 50% 处的颜色
}],
global: true // 缺省为 false
}
}
},
emphasis: {
itemStyle: {
areaColor: '#0160AD'
},
label: {
show: 0,
color: '#fff'
}
},
zlevel: 3
}, {
map: 'xizang',
aspectScale: 0.9,
roam: false, // 是否允许缩放
zoom: 1.2, // 默认显示级别
layoutSize: '95%',
layoutCenter: ['55%', '50%'],
itemStyle: {
normal: {
borderColor: 'rgba(192,245,249,.6)',
borderWidth: 2,
shadowColor: '#2C99F6',
shadowOffsetY: 0,
shadowBlur: 120,
areaColor: 'rgba(29,85,139,.2)'
}
},
zlevel: 2,
silent: true
}, {
map: 'xizang',
aspectScale: 0.9,
roam: false, // 是否允许缩放
zoom: 1.2, // 默认显示级别
layoutSize: '95%',
layoutCenter: ['55%', '51.5%'],
itemStyle: {
// areaColor: '#005DDC',
areaColor: 'rgba(0,27,95,0.4)',
borderColor: '#004db5',
borderWidth: 1
},
zlevel: 1,
silent: true
}],
series: [
// map
{
geoIndex: 0,
// coordinateSystem: 'geo',
showLegendSymbol: true,
type: 'map',
roam: true,
label: {
normal: {
show: false,
textStyle: {
color: '#fff'
}
},
emphasis: {
show: false,
textStyle: {
color: '#fff'
}
}
},
itemStyle: {
normal: {
borderColor: '#2ab8ff',
borderWidth: 1.5,
areaColor: '#12235c'
},
emphasis: {
areaColor: '#2AB8FF',
borderWidth: 0,
color: 'red'
}
},
map: 'xizang', // 使用
data: customerBatteryCityData
// data: this.difficultData //热力图数据 不同区域 不同的底色
},
// 柱状体的主干
{
type: 'lines',
zlevel: 5,
effect: {
show: false,
// period: 4, //箭头指向速度,值越小速度越快
// trailLength: 0.02, //特效尾迹长度[0,1]值越大,尾迹越长重
// symbol: 'arrow', //箭头图标
// symbol: imgDatUrl,
symbolSize: 5 // 图标大小
},
lineStyle: {
width: 20, // 尾迹线条宽度
color: 'rgb(22,255,255, .6)',
opacity: 1, // 尾迹线条透明度
curveness: 0 // 尾迹线条曲直度
},
label: {
show: 0,
position: 'end',
formatter: '245'
},
silent: true,
data: lineData()
},
// 柱状体的顶部
{
type: 'scatter',
coordinateSystem: 'geo',
geoIndex: 0,
zlevel: 5,
label: {
show: true,
formatter: function() {
return ``
},
position: "top"
},
symbol: 'circle',
symbolSize: [20, 10],
itemStyle: {
color: 'rgb(22,255,255, 1)',
opacity: 1
},
silent: true,
data: scatterData()
},
// 柱状体的底部
{
type: 'scatter',
coordinateSystem: 'geo',
geoIndex: 0,
zlevel: 4,
label: {
// 这儿是处理的
formatter: '{b}',
position: 'bottom',
color: '#fff',
fontSize: 12,
distance: 10,
show: true
},
symbol: 'circle',
symbolSize: [20, 10],
itemStyle: {
// color: '#F7AF21',
color: 'rgb(22,255,255, 1)',
opacity: 1
},
silent: true,
data: scatterData2()
},
// 底部外框
{
type: 'scatter',
coordinateSystem: 'geo',
geoIndex: 0,
zlevel: 4,
label: {
show: false
},
symbol: 'circle',
symbolSize: [40, 20],
itemStyle: {
color: {
type: 'radial',
x: 0.5,
y: 0.5,
r: 0.5,
colorStops: [{
offset: 0,
color: 'rgb(22,255,255, 0)' // 0% 处的颜色
}, {
offset: 0.75,
color: 'rgb(22,255,255, 0)' // 100% 处的颜色
}, {
offset: 0.751,
color: 'rgb(22,255,255, 1)' // 100% 处的颜色
}, {
offset: 1,
color: 'rgb(22,255,255, 1)' // 100% 处的颜色
}],
global: false // 缺省为 false
},
opacity: 1
},
silent: true,
data: scatterData2()
}
]
}
myChart.setOption(option);
})
// 动态计算柱形图的高度(定一个max)
function lineMaxHeight() {
const maxValue = Math.max(...customerBatteryCityData.map(item => item.value))
return 0.9 / maxValue
}
// 柱状体的主干
function lineData() {
return customerBatteryCityData.map((item) => {
return {
coords: [geoCoordMap[item.name],
[geoCoordMap[item.name][0], geoCoordMap[item.name][1] + item.value * lineMaxHeight()]
]
}
})
}
// 柱状体的顶部
function scatterData() {
return customerBatteryCityData.map((item) => {
return [geoCoordMap[item.name][0], geoCoordMap[item.name][1] + item.value * lineMaxHeight()]
})
}
// 柱状体的底部
function scatterData2() {
return customerBatteryCityData.map((item) => {
return {
name: item.name,
value: geoCoordMap[item.name]
}
})
}
if (option) {
myChart.setOption(option);
}
}
``




![2023年中国润滑油分散剂市场需求量及行业竞争现状分析[图]](https://img-blog.csdnimg.cn/img_convert/1b72b774330bd8e81b6607249d943e4f.png)
