一、需求说明
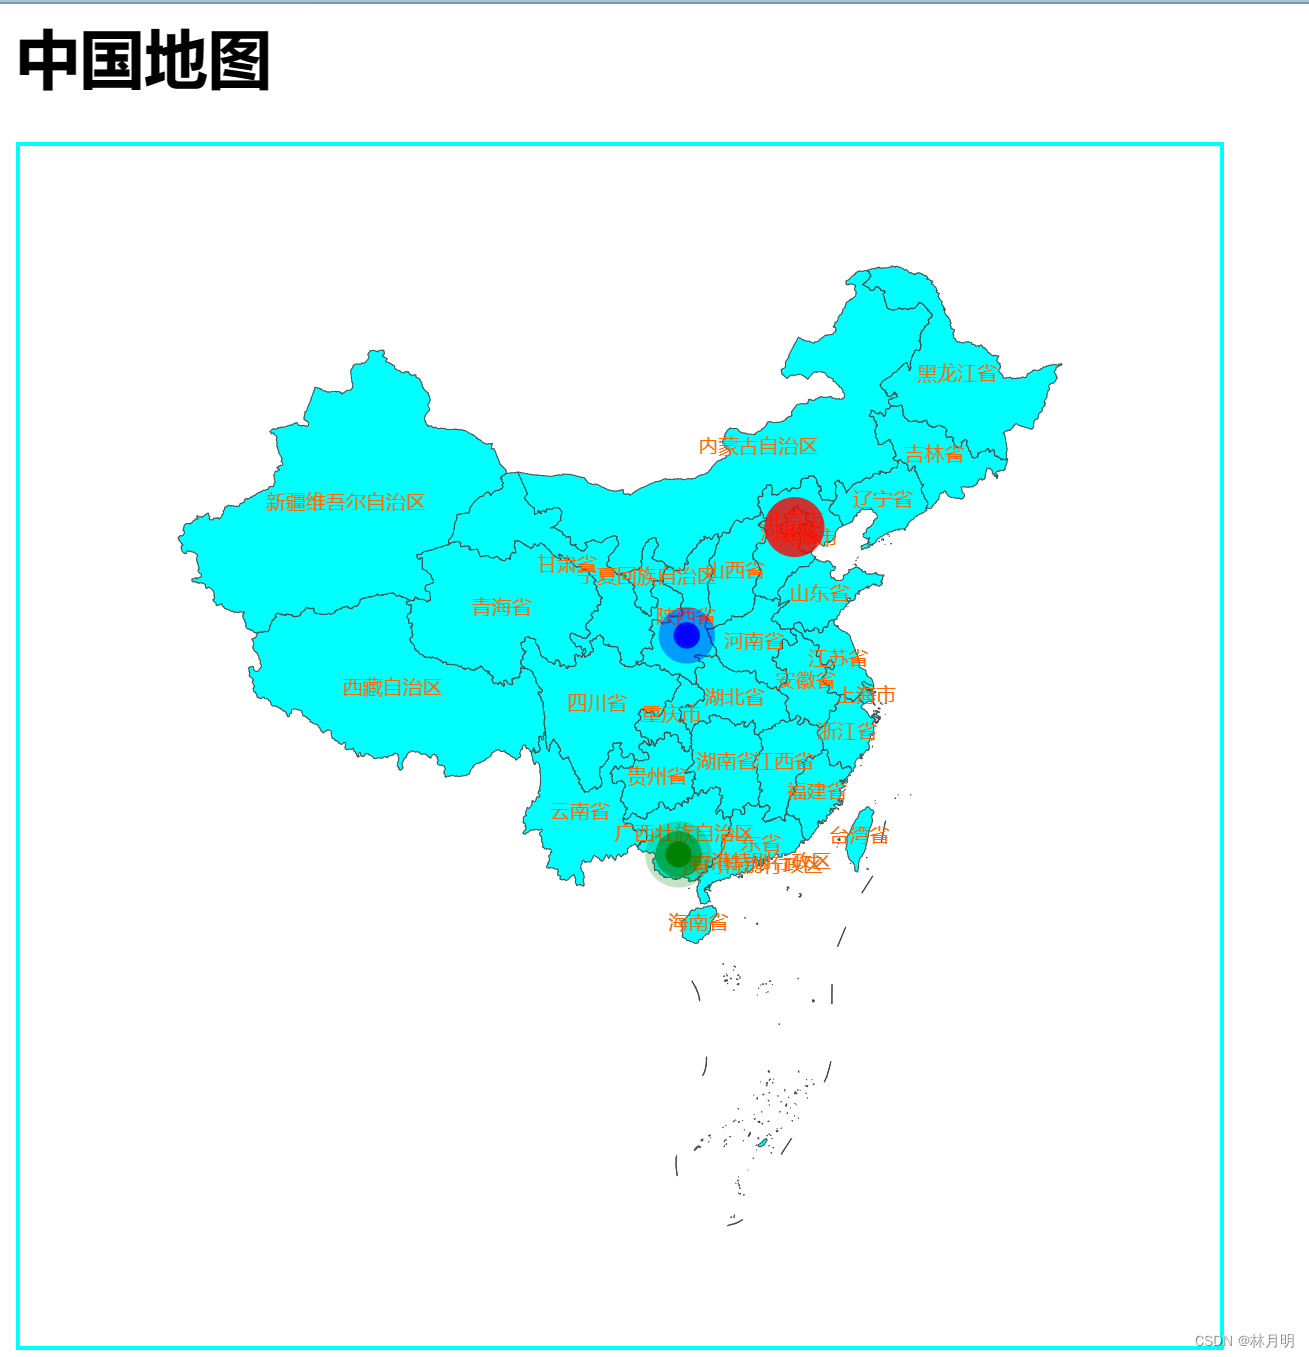
将地图中北京市、陕西市、南宁市分别以实心圆、涟漪圆、涟漪圆标记出来
二、代码实践
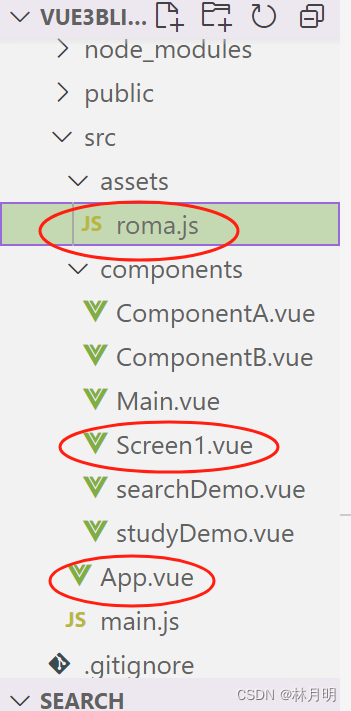
涉及三个文件
1、App.vue:
<template>
  <Screen1/>
</template>
<script>
import Screen1 from "./components/Screen1.vue";
export default{
  components:{
    Screen1
  }
}
</script>
2、roma.js
export let cmap=
{//粘贴地图数据,此处省略}
3、Screen1.vue
<template>
    <div class="about">
        <h1>中国地图</h1>
        <div id="myecharts" ref="demoh"></div>
    </div>
</template>
<script>
import * as echarts from "echarts";
// 引用的就是中国各省份的矢量数据
import {cmap} from "../assets/roma.js"

export default {
    mounted() {
        let myChart = echarts.init(this.$refs.demoh);
        echarts.registerMap("chinaMap",cmap)//使用 registerMap 注册的地图名称。
        let option = {
            geo:{//地理坐标系组件。地理坐标系组件用于地图的绘制
                type:"map",
                map:"chinaMap",//使用 registerMap 注册的地图名称
                // 默认设置完地图是固定死的不能拖动
                roam:true,//否开启鼠标缩放和平移漫游。默认不开启。
                //zoom :5,//当前视角的缩放比例。越大比例越大
                //center:[116.46,39.92],//当前视角的中心点,用经纬度表示108.956239,34.268309
                label:{//地图上显示文字提示信息
                    show:true,
                    color:"#ff6600",   //地图省份字体的颜色
                    fontSize:10//字体大小
                 },
                itemStyle:{//地图区域的多边形 图形样式。
                //areaColor:"#ff6600",//地图区域的颜色。
                areaColor:"rgb(0, 255, 255)",
                },
            },
            series: [
                //散点图
                {
                    type: "scatter",
                    data:[
                        {
                            name:"北京市",//数据项的名字
                            value:[
                                116.46,
                                39.92,
                                4000
                            ],
                        },
                    ],
                    coordinateSystem:"geo",
                    symbolSize:30,
                    // label:{
                    //     show:true
                    // },
                    itemStyle:{
                        color:"red"
                    }
                },

                {
                    type: "effectScatter", //涟漪效果
                    coordinateSystem:"geo",
                    data:[
                        {
                            name:"陕西市",//数据项的名字
                            value:[
                                108.95,
                                34.26,
                            ],
                        },
                    ],
                    //设置涟漪效果
                    rippleEffect:{
                        number:2,//波动
                        scale:4
                    },
                    itemStyle:{
                        color:"blue"
                    }
                } ,

                {
                    type: "effectScatter", //涟漪效果
                    coordinateSystem:"geo",
                    data:[
                        {
                            name:"广西",//数据项的名字
                            value:[
                                108.37,
                                22.82,
                            ],
                        },
                    ],
                    //设置涟漪效果
                    rippleEffect:{
                        number:3,//波动
                        scale:4
                    },
                    itemStyle:{
                        color:"green"
                    }
                }

            ]
    };
    myChart.setOption(option);
    },
};
</script>
    <style scoped>#myecharts
     {
        width: 600px;
        height: 600px;
        border: 2px
        solid rgb(0, 255, 255);
     }
     </style>
三、效果展示
四、知识技巧
1、geo 地理坐标系组件,地理坐标系组件用于地图的绘制
2、涟漪效果
type: "effectScatter", //采用涟漪效果
//设置涟漪效果
rippleEffect:{
number:2,//波动
scale:4,//大小
},
五、学习教程
https://www.bilibili.com/video/BV14u411D7qK?p=36&vd_source=841fee104972680a6cac4dbdbf144b50







![[Android]问题解决-Device must be bootloader unlocked](https://img-blog.csdnimg.cn/f51ed7373b234c4a8fda588a164d1ff6.png)
