splitLine设置坐标轴网格线的样式
- show:是否显示网格线。默认为true。
- lineStyle:线条样式,包括类型(type)、颜色(color)、宽度(width)等。例如,可以设置为dashed或solid,颜色可以是’#113d5e’等,宽度可以设置成1等。
yAxis属性
ECharts组件yAxis属性在官方文档中给出了以下几种配置项:
- min:y轴的最小值,可以是数字或者函数。
- max:y轴的最大值,可以是数字或者函数。
- interval:两个刻度之间的间隔,可以是数字或者函数。
- type:坐标轴类型,可以是’value’、‘category’、‘time’或者’log’。默认为’value’。
- show:是否显示Y轴。
- name:坐标轴名称。
- nameLocation:坐标轴名称显示位置,可以是’start’、‘middle’、‘center’或’end’。
- nameTextStyle:坐标轴名称的文字样式,包括字体大小、颜色等。
- nameGap:坐标轴名称与轴线之间的距离。
- nameRotate:坐标轴名字旋转的角度。
- inverse:是否是反向坐标轴。
核心代码
 const option = {
  grid: {
    left: "3%",
    right: "4%",
    bottom: "3%",
    containLabel: true,
  },
  toolbox: {
    feature: {
      saveAsImage: {},
    },
  },
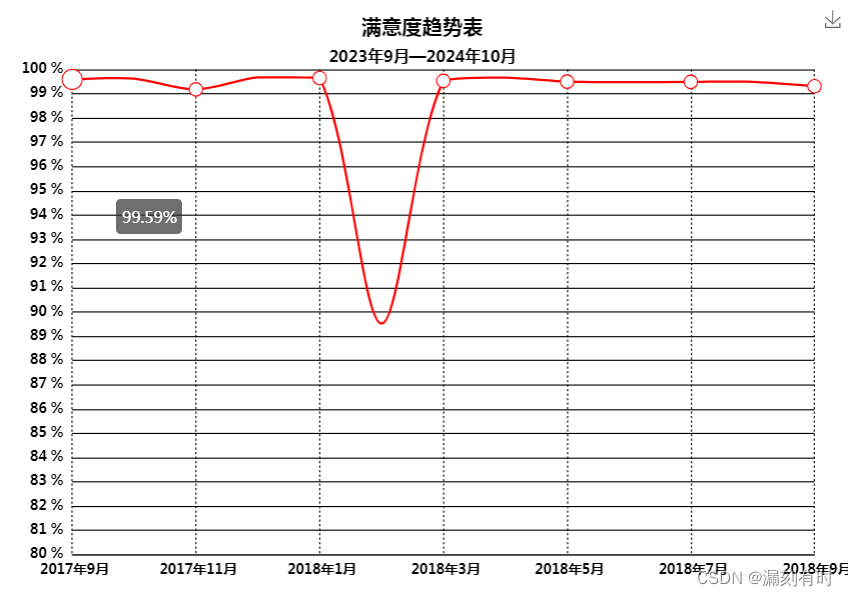
  title: {
    text: "满意度趋势表",
    subtext: "2023年9月—2024年10月",
    left: "center",
    y: "10",
    subtextStyle: {
      color: "#000",
      fontSize: "14",
      fontWeight: "bold",
    },
    textStyle: {
      color: "#000",
    },
  },
  tooltip: {
    trigger: "axis",
    formatter: "{c}%",
  },

  xAxis: {
    type: "category",
    boundaryGap: false,
    axisTick: {
      show: false,
    },
    axisLabel: {
      textStyle: {
        color: "#000",
        fontWeight: "bold",
      },
    },
    splitLine: {
      //网格线
      show: true,
      lineStyle: {
        color: ["#000"],
        type: "dotted",
      },
    },
    data: [
      " 2017年9月",
      " 2017年10月",
      " 2017年11月",
      " 2017年12月",
      " 2018年1月",
      " 2018年2月",
      " 2018年3月",
      " 2018年4月",
      " 2018年5月",
      " 2018年6月",
      " 2018年7月",
      " 2018年8月",
      " 2018年9月",
    ],
  },
  yAxis: {
    min: 80,
    max: 100,
    interval: 1,
    axisTick: {
      show: false,
    },
    axisLine: {
      show: false,
      //    onZero:false
    },
    axisLabel: {
      formatter: "{value} %",
      textStyle: {
        color: "#000",
        fontWeight: "bold",
      },
    },
    splitLine: {
      //网格线
      show: true,
      lineStyle: {
        color: ["#000"],
        type: "solid",
      },
    },
  },
  series: [
    {
      name: "剩余额度",
      type: "line",
      smooth: true,
      symbolSize: 12,
      color: ["#FF0000"],
      data: [
        "99.59",
        "99.62",
        "99.18",
        "99.68",
        "99.65",
        "89.52",
        "99.53",
        "99.66",
        "99.50",
        "99.48",
        "99.49",
        "99.49",
        "99.31",
      ],
      label: {
        normal: {
          show: false,
          position: "top", //值显示
        },
      },
    },
  ],
};
@漏刻有时

