Theil-Sen Median + Mann-Kendall
- 1. Theil-Sen Median + Mann-Kendall 原理
- 1.1 Theil-Sen Median
- 1.2 Mann-Kendall
- 2. GEE code
1. Theil-Sen Median + Mann-Kendall 原理
1.1 Theil-Sen Median
Theil-Sen Median方法又称为Sen斜率估计,是一种稳健的非参数统计的趋势计算方法。该方法计算效率高,对于测量误差和利群数据不敏感,适用于长时间序列数据的趋势分析。其计算公式为:

式中,n为研究图层数,即n=22; ρ为趋势度,当ρ<0时,表示NDVI随时间呈下降趋势,当ρ>0时,表示NDVI随时间呈上升趋势。
1.2 Mann-Kendall
Mann-Kendall(MK) 检验是一种非参数的时间序列趋势性检验方法,其不需要测量值服从正太分布,不受缺失值和异常值的影响,适用于长时间序列数据的趋势显著检验。检验公式:
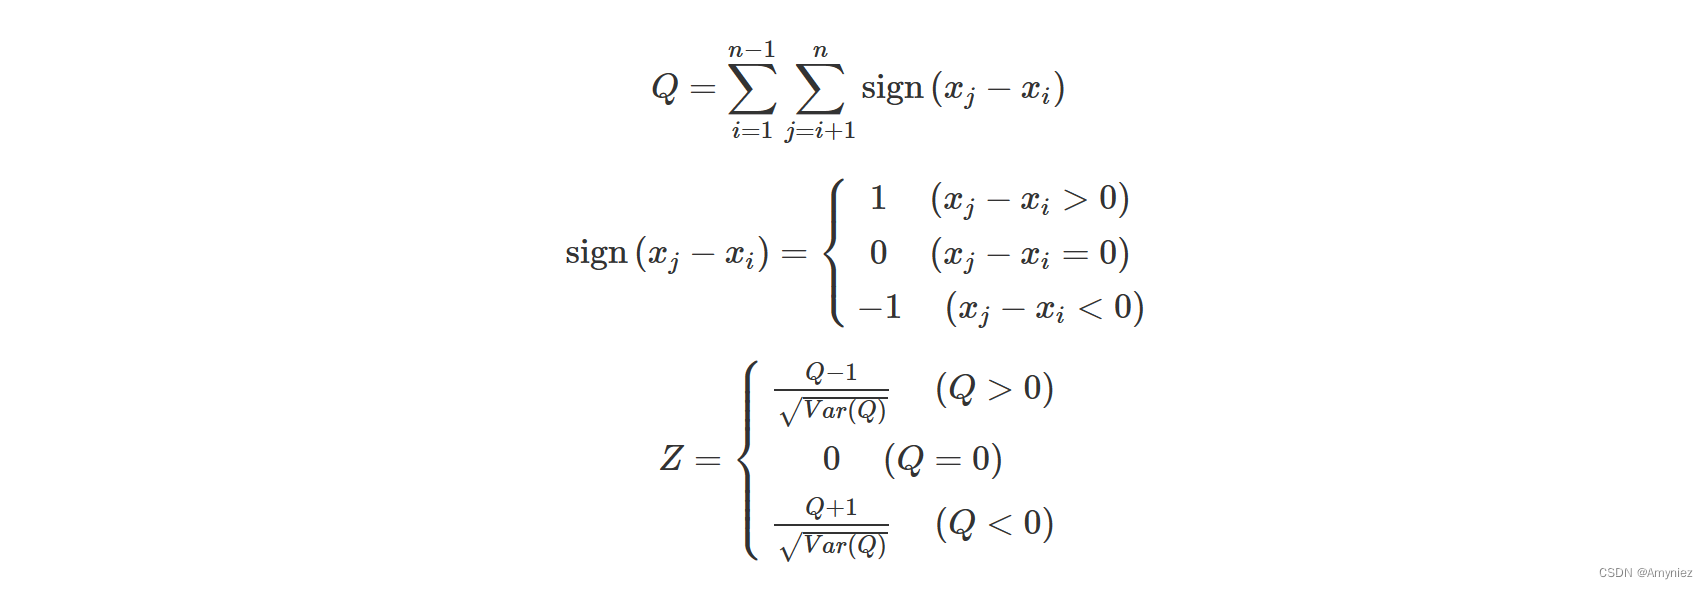
式中,Q为检验统计量;Z为标准化后的检验统计量;Var(Q)为方差,在给定的α显著性水平下,若Z<Za/2,则表示通过了相应置信度的显著性检验。
方差计算公式:

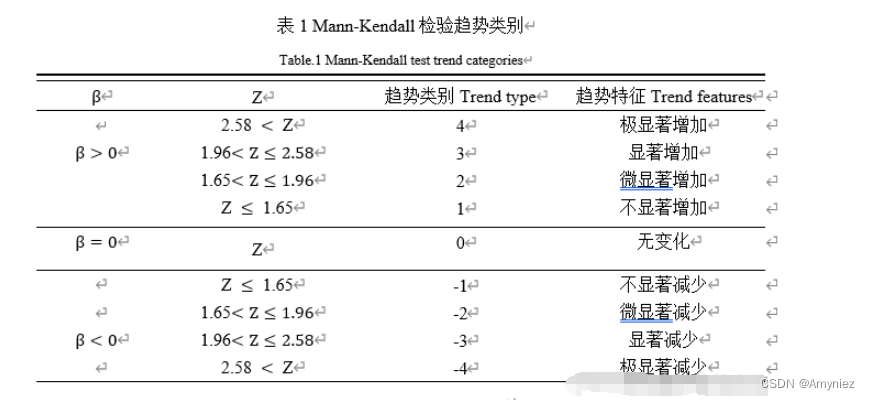
2. GEE code
var imageCollection = ee.ImageCollection("MODIS/006/MOD13Q1");
var table = ee.FeatureCollection("users/cduthes1991/boundry/China_province_2019");
var roi = table.filter(ee.Filter.eq('provinces','sichuan'));
Map.centerObject(roi,5.8)

var styling = {color:"red",fillColor:"00000000"}
Map.addLayer(roi.style(styling),{},"geometry")


var imgCol = ee.ImageCollection("MODIS/006/MOD13Q1")
                        .filterDate('2022-1-1','2022-12-31')
                        .filterBounds(roi)
                        .select('NDVI')
                        .map(function(image){
                          var imgsub = image;
                          return image.clip(roi)
                        });
var palette = ['red', 'yellow', 'green'];

// Theil-Sen Median斜率估计 + Mann-Kendall趋势分析
// 做一个筛选器,筛选出右边比左边小的部分
var afterFilter = ee.Filter.lessThan({
    leftField: 'system:index',
    rightField: 'system:index'
});

// 做一个连接,让primary中所有元素和secondary做对比
// 将secondary中的year大于当前primary元素的加入到primary的after属性中
var joined = ee.ImageCollection(ee.Join.saveAll('after').apply({
    primary: imgCol,
    secondary: imgCol,
    condition: afterFilter
})).aside(print);


// 1、实现Theil-Sen Median斜率估计
var sen_slop = function (i, j) {  // i和j均为图像
    return ee.Image(j).subtract(i)
        .divide(ee.Image(j).date().difference(ee.Image(i).date(), 'year'))
        .rename('slope')
        .float();
};

// 两个map实现双重循环,先取出当前ndvi(current)的after属性(也就是大于当前的日期),
// 然后利用sen_slop函数计算current和after的sen斜率
var sen = ee.ImageCollection(joined.map(function (current) {
    var afterCollection = ee.ImageCollection.fromImages(current.get("after"))
    return afterCollection.map(function (after) {
        return ee.Image(sen_slop(current, after));
    })
}).flatten());


var sensSlope = sen.reduce(ee.Reducer.median(), 2); // Set parallelScale.
Map.addLayer(sensSlope, {palette: palette}, 'sensSlope');

// 将sensSlope中的像素值进行修改,将正值改为2,负值改为1;
// 以便图像可视化、遥感图像分类或不同区域或特征的标记
var classify = sensSlope.where(sensSlope.gt(0), 2)  // 将原图像中所有正值的像素修改为2
    .where(sensSlope.lt(0), 1)                      // 将原图像中所有负值的像素修改为1
Map.addLayer(classify, { min: 1, max: 2, palette: ['red', 'green'] }, 'Image classify to 0 and 1')

// 图像导出
Export.image.toDrive({
        image:sensSlope,
        description:'Sen_Median',
		   region:roi,
        scale:250,
        maxPixels:1e13,
        folder:'LUCC'
      })


// 2、实现Mann-Kendall趋势分析
// 构建符号函数sgn
var sign = function (i, j) {
    return ee.Image(j).neq(i)
        .multiply(ee.Image(j).subtract(i).clamp(-1, 1)).int();
};

// 符号函数求和
var kendall = ee.ImageCollection(joined.map(function (current) {
    var afterCollection = ee.ImageCollection.fromImages(current.get('after'));
    return afterCollection.map(function (image) {
        return ee.Image(sign(current, image));
    });
	// Set parallelScale to avoid User memory limit exceeded.
}).flatten()
).sum();

Map.addLayer(kendall, {min:-200, max:200, palette: palette}, 'kendall');   // 根据需要拉伸


// Values that are in a group (ties). Set all else to zero.
// 找到那些至少在两个图像对中像素值相等的位置,并将这些位置的像素值保留,其他位置的像素值设为0
// 个人认为基本所有像元都能保留,像素值为0的像元很少
var groups = imgCol.map(function (i) {
    var matches = imgCol.map(function (j) {
        return i.eq(j);
    }).sum();                // 基于布尔类型的图像生成一个新的图像,其中像素值表示该像元上像素值相等图层数量
    return i.multiply(matches.gt(1)); // 创建一个新图像,只保留那些在至少两个图像对中像素值相等的位置,并将其他位置的像素值设为0。
});


// Compute tie group sizes in a sequence. The first group is discarded.
var group = function (array) {
    var length = array.arrayLength(0);     // 获取array的长度,通常是数组的第一个维度(行数或索引)的长度

	// Array of indices. These are 1-indexed.
	// 将包含一个多维数组,其中每个元素的值表示其在数组中的索引
	// 所有元素初始化为1,使用一系列数组操作来生成一个长度为length的一维数组,每个元素的值都是1。
    var indices = ee.Image([1])
        .arrayRepeat(0, length)           // 将现有数组在指定维度上复制多次,即第0维(行数或索引)上重复length次
        .arrayAccum(0, ee.Reducer.sum())  // 对数组中的值进行累积计算,
        .toArray(1);

    var sorted = array.arraySort();   // 升序排序
    var left = sorted.arraySlice(0, 1);
    var right = sorted.arraySlice(0, 0, -1);
    // Indices of the end of runs.
    var mask = left.neq(right)
        // Always keep the last index, the end of the sequence.
        .arrayCat(ee.Image(ee.Array([[1]])), 0);

    var runIndices = indices.arrayMask(mask);
    // Subtract the indices to get run lengths.

    var groupSizes = runIndices.arraySlice(0, 1)
        .subtract(runIndices.arraySlice(0, 0, -1));
    return groupSizes;

};

// var(s)计算
var factors = function (image) {
    return image.expression('b() * (b() - 1) * (b() * 2 + 5)');
};


var groupSizes = group(groups.toArray());

var groupFactors = factors(groupSizes);

var groupFactorSum = groupFactors.arrayReduce('sum', [0])
    .arrayGet([0, 0]);

var count = joined.count();

var kendallVariance = factors(count)
    .subtract(groupFactorSum)
    .divide(18)
    .float()
    .rename('kendallVariance');

//Map.addLayer(kendallVariance, {}, 'kendallVariance');


// Compute Z-statistics.
var zero = kendall.multiply(kendall.eq(0));
var pos = kendall.multiply(kendall.gt(0)).subtract(1);
var neg = kendall.multiply(kendall.lt(0)).add(1);

// Z values
var z = zero
    .add(pos.divide(kendallVariance.sqrt()))
    .add(neg.divide(kendallVariance.sqrt()))
    .rename('z');
//Map.addLayer(z, {min: -2, max: 2}, 'z');


var qs = z.where(z.lte(1.65).and(sensSlope.lt(0)), -1)
    .where(z.gt(1.65).and(z.lte(1.96)).and(sensSlope.lt(0)), -2)
    .where(z.gt(1.96).and(z.lte(2.58)).and(sensSlope.lt(0)), -3)
    .where(z.gt(2.58).and(sensSlope.lt(0)), -4)
    .where(z.lte(1.65).and(sensSlope.lt(0)), 1)
    .where(z.gt(1.65).and(z.lte(1.96)).and(sensSlope.gt(0)), 2)
    .where(z.gt(1.96).and(z.lte(2.58)).and(sensSlope.gt(0)), 3)
    .where(z.gt(2.58).and(sensSlope.gt(0)), 4)

// 红色、绿色、蓝色、黄色、青色、品红色
var palette_qs = ['FF0000', '00FF00', '0000FF', 'FFFF00', '00FFFF', 'FF00FF'];
Map.addLayer(qs, { min: -1, max: 4, palette: palette_qs}, 'QS')


// 图像导出
Export.image.toDrive({
    image: qs,
    description: 'QS_Values',
	region: roi,
    scale: 250,
    maxPixels: 1e13,
	folder: 'LUCC'
})
结果展示:
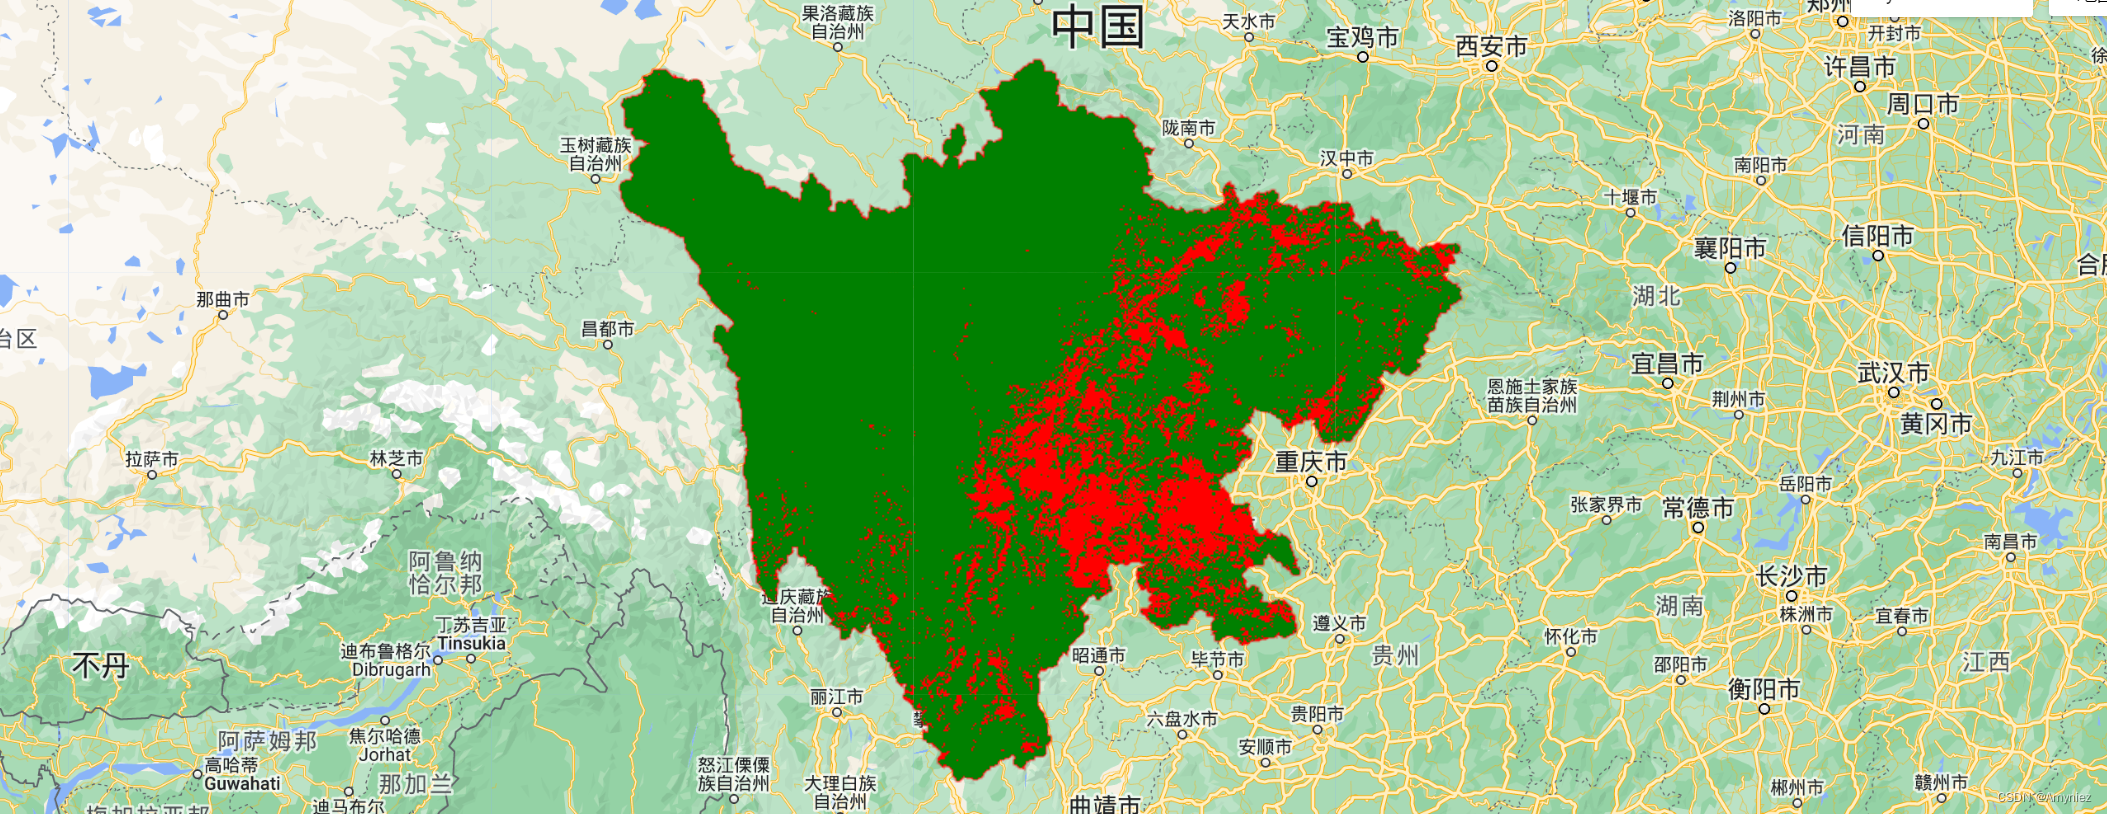
1、sensSlope斜率估计图层:绿色表示斜率增加,红色表示斜率降低
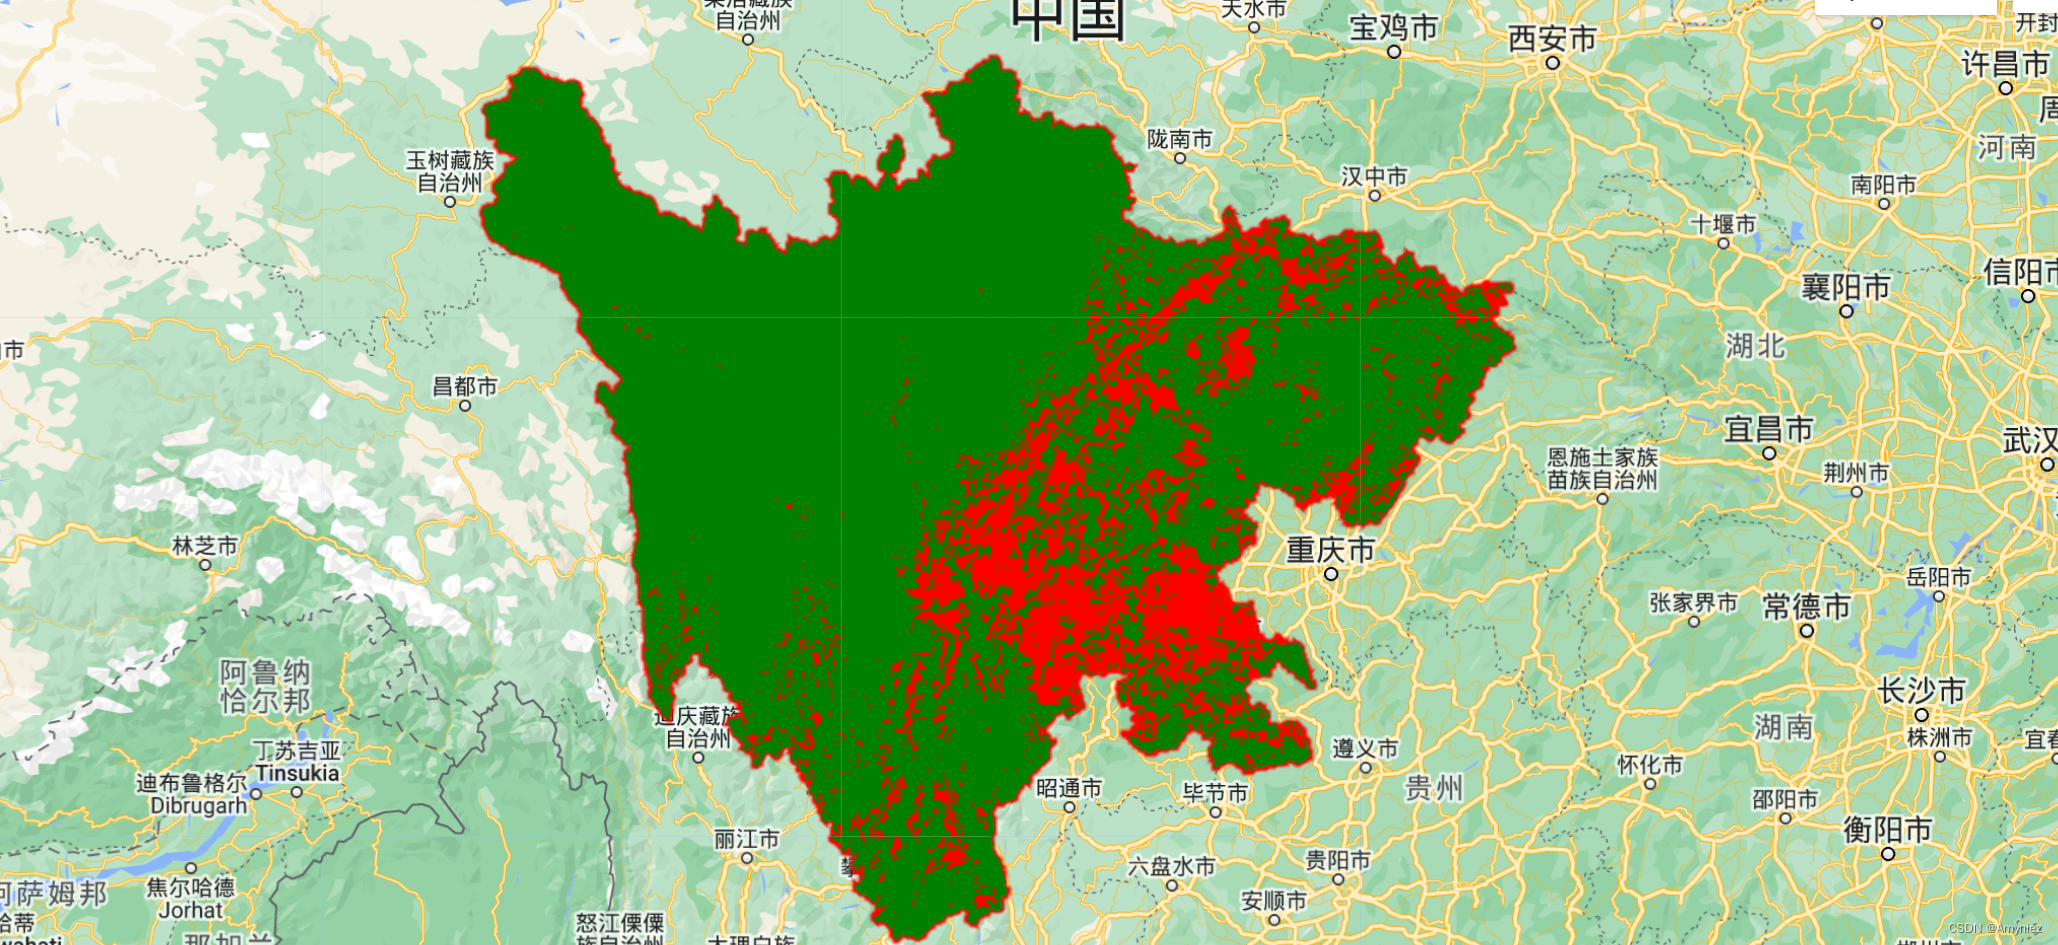
2、二值图像分类:
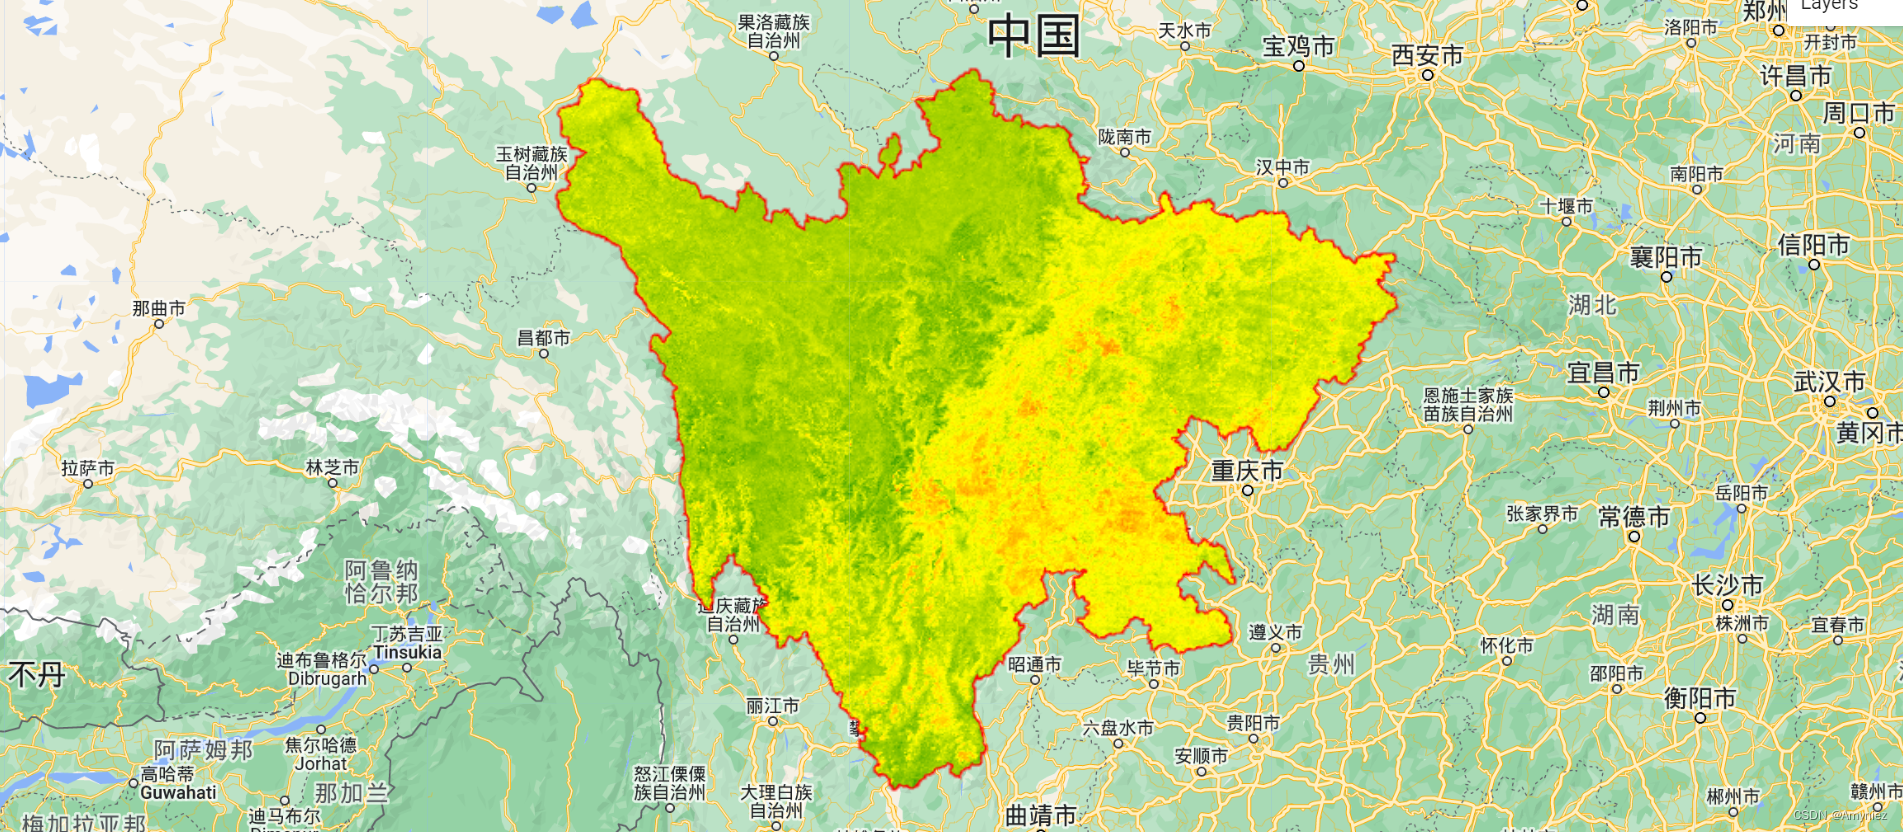
3、Kendall趋势检验:主要展示哪些像元发生了变化,颜色越深,数值越大,则变化越大
4、Z统计值图:
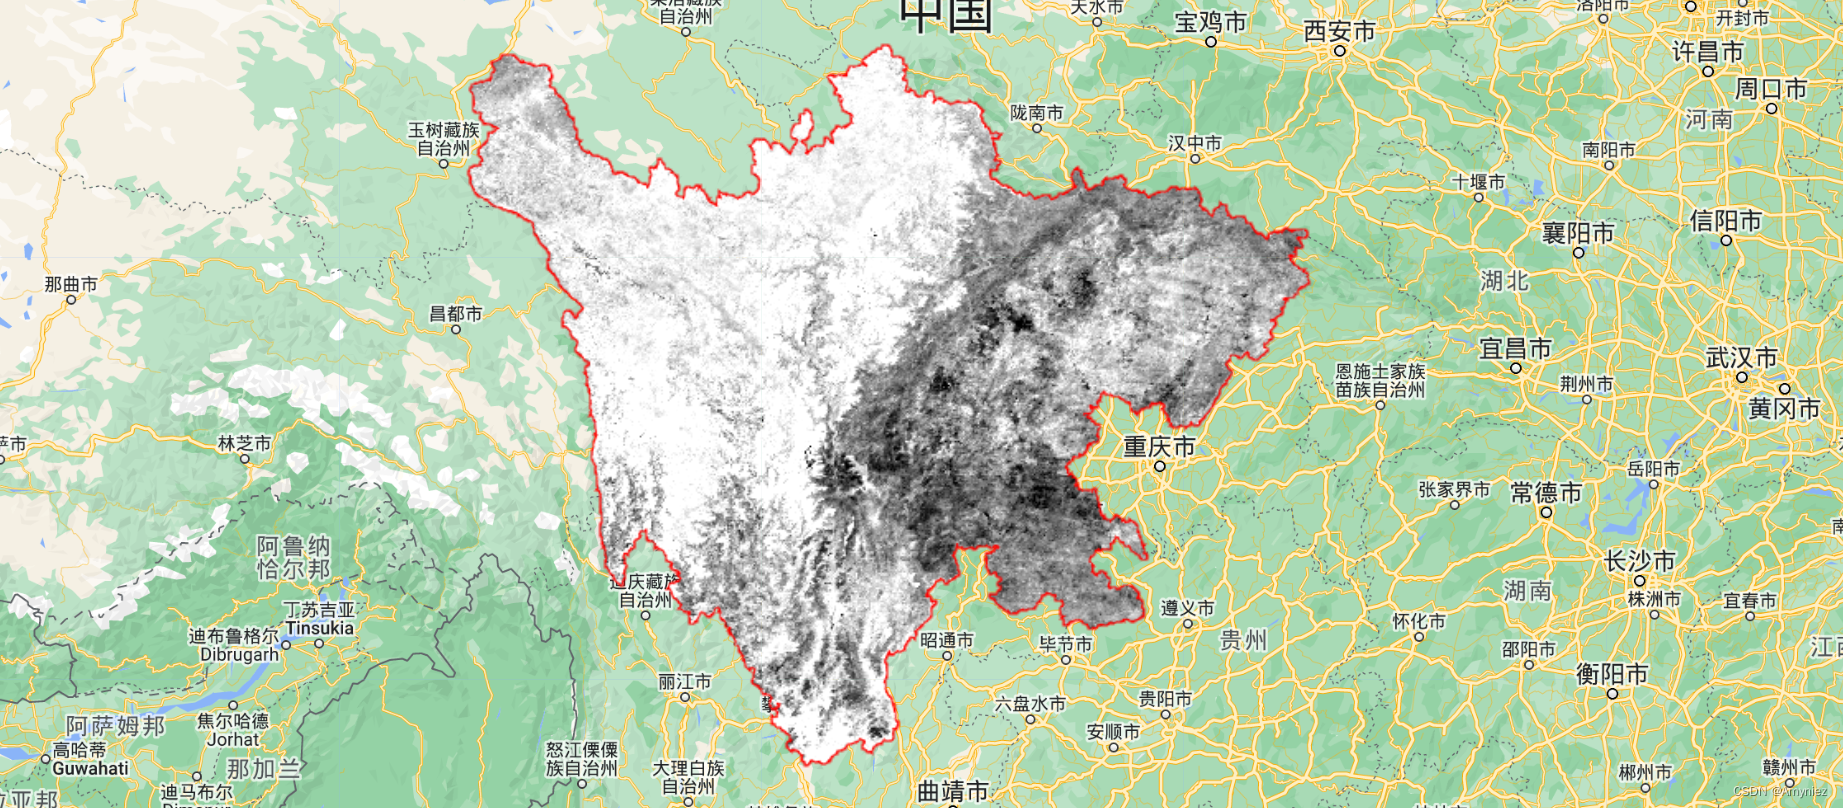
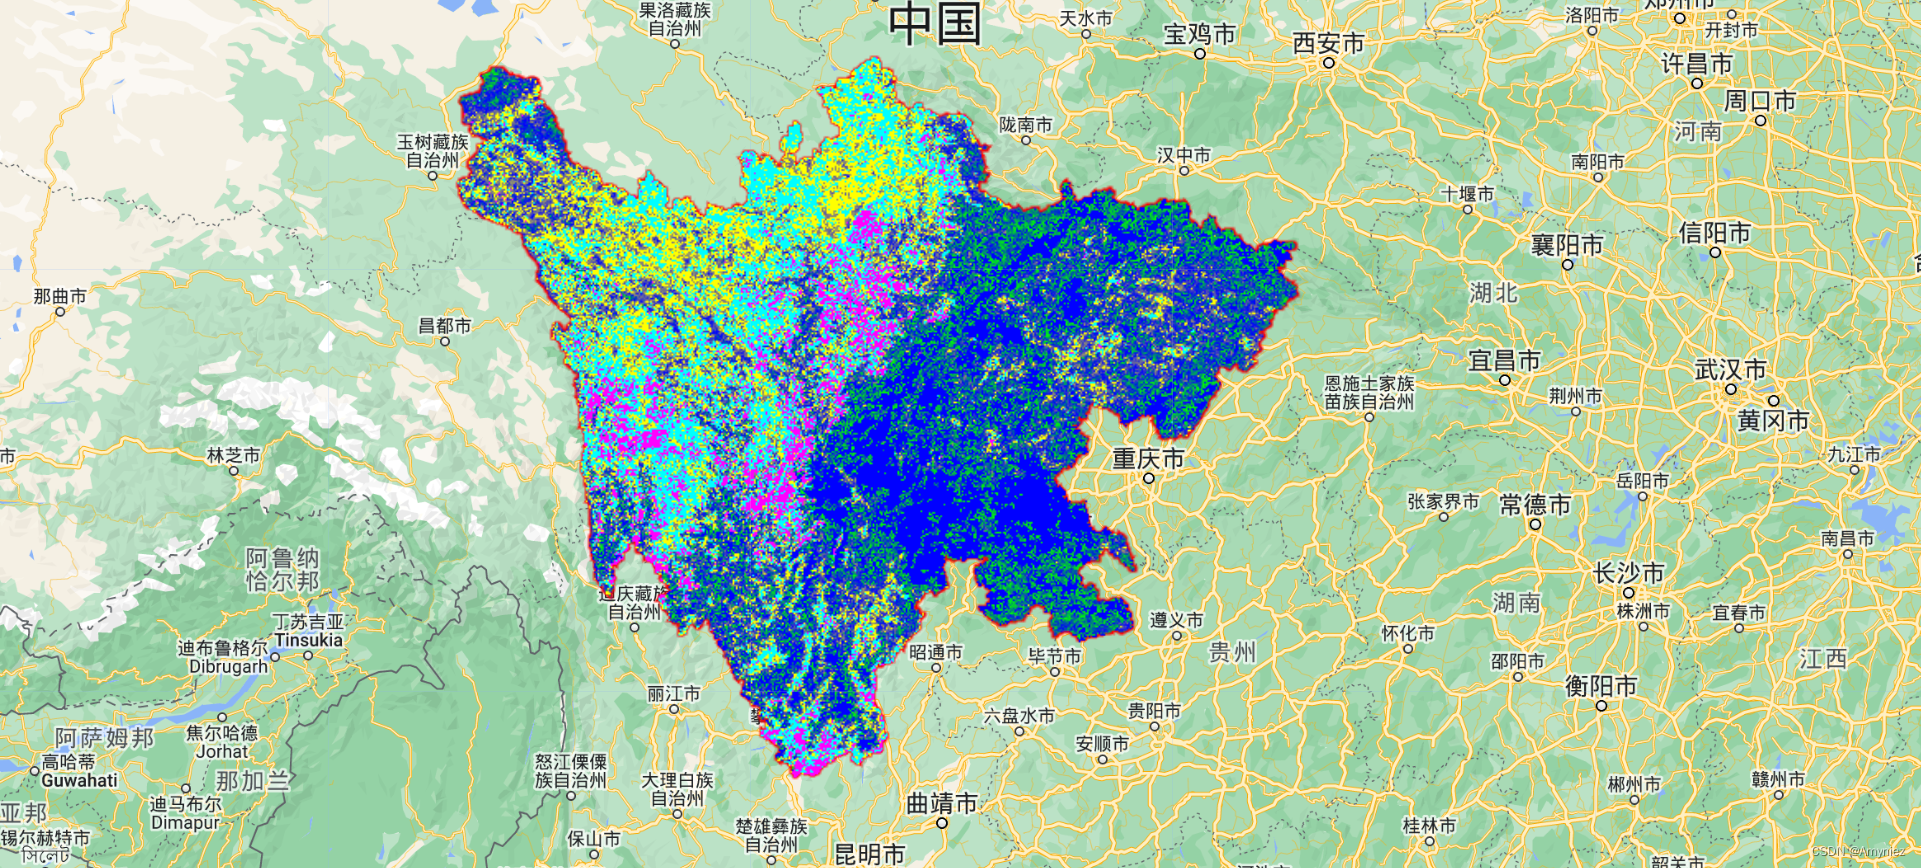
5、NDVI趋势变化图:通过Z统计值分类得到
