python – 在2x2的子图中绘制三个子图,并使第三个子图居中
基于python,绘制一个2x2的子图范围,但是只显示3个子图,并使得第三个子图居中显示’
思路:
- 建立一个2x2的子图
- 前两个正常画,其中第三个子图跨越两行。
- 第三个子图通过
set_position来调整大小和位置,使其视觉上看起来居中显示
以下是封装的绘图函数:
from matplotlib import ticker
import matplotlib.pyplot as plt
import cartopy.feature as cfeature
from cartopy.mpl.ticker import LongitudeFormatter, LatitudeFormatter
import cartopy.crs as ccrs
import numpy as np
import  cmaps
from matplotlib.gridspec import GridSpec
def make_map(ax, title):
    ax.set_extent(box, crs=ccrs.PlateCarree())
    land = cfeature.NaturalEarthFeature('physical',
                                        'land',
                                        '50m',
                                        edgecolor='gray',
                                        facecolor='None',
                                        )
    ax.add_feature(land)  # set land color
    ax.coastlines()  # set coastline resolution
    gl = ax.gridlines(draw_labels=True,
                      linewidth=0.5,
                      color='gray',
                      alpha=0.5,
                      linestyle='--')

    gl.top_labels = False  # 不显示上边界的标签
    gl.right_labels = False  # 不显示右边界的标签
    gl.xlocator = ticker.MultipleLocator(base=30)
    gl.ylocator = ticker.MultipleLocator(base=30)
    ax.set_title(title, fontsize=25, loc='center')
    # ax.tick_params(which='both',
    #                direction='out',
    #                length=8,
    #                width=0.99,
    #                pad=0.2,
    #                labelsize=20,
    #                bottom=True, left=True, right=True, top=True)

    return ax
- 封装函数的好处在于重复绘制相关格式的子图时,减少重复代码
- 上述封装的绘图函数,可以实现:1、指定显示的绘图空间范围;2、陆地投影、海岸线;3、网格以及默认标签;4、标题;5、最小刻度线间隔
- 由于这里关于刻度线使用的是
gridlines,对于刻度线的朝向和长短暂时没有找到好的方法进行控制,这个是投影地图上的一个bug感觉,在proplot这个绘图函数里面也有类似的问题;解决办法呢,需要自己手动添加tick,然后通过tick_params来实现;
如下所示:
def make_map(ax, title):
    ax.set_extent(box, crs=ccrs.PlateCarree())
    land = cfeature.NaturalEarthFeature('physical',
                                        'land',
                                        '50m',
                                        edgecolor='gray',
                                        facecolor='None',
                                        )
    ax.add_feature(land)  # set land color
    ax.coastlines()  # set coastline resolution

    ax.set_xticks(np.arange(-90, 91, 30), crs=ccrs.PlateCarree())
    ax.set_yticks(np.arange(-30, 31, 30), crs=ccrs.PlateCarree())
    ax.xaxis.set_major_formatter(LongitudeFormatter(zero_direction_label=False))
    ax.yaxis.set_major_formatter(LatitudeFormatter())

    ax.xaxis.set_minor_locator(ticker.AutoMinorLocator(n=5) )
    ax.yaxis.set_minor_locator(ticker.AutoMinorLocator(n=3))
    ax.xaxis.set_major_formatter(lon_formatter)
    ax.yaxis.set_major_formatter(lat_formatter)
    ax.set_title(title, fontsize=25, loc='center')
    ax.tick_params(which='both',
                    direction='out',
                    length=8,
                    width=0.99,
                    pad=0.2,
                    labelsize=20,
                    bottom=True, left=True, right=True, top=True)

    return ax
然后,对于子图的设置,这里使用的是GridSpec 对象,代码如下所示,
proj = ccrs.PlateCarree(central_longitude=0)

fig = plt.figure(figsize=(16, 8), dpi=200)
gs = GridSpec(2, 2, figure=fig, width_ratios=[1, 1], height_ratios=[1, 1])
ax = [plt.subplot(gs[0, 0], projection=proj), plt.subplot(gs[0, 1], projection=proj),
      plt.subplot(gs[1, :2], projection=proj)]

title = ['Zonal Wind', 'Meridional Wind', 'Height']
box = [-91, 91, -35, 35]

for i, var in enumerate([u, v, h]):
    make_map(ax[i], title[i])
    plot = ax[i].contourf(lon, lat, var.T, cmap=cmaps.BlueWhiteOrangeRed,transform=ccrs.PlateCarree())
    ax[i].set_extent(box, crs=ccrs.PlateCarree())

# 设置第三个子图的位置
ax[2].set_position([0.25, 0.1, 0.5, 0.8])

# 调整子图间距
plt.subplots_adjust(hspace=0.4)
得到的绘图结果就是下面这个样子:
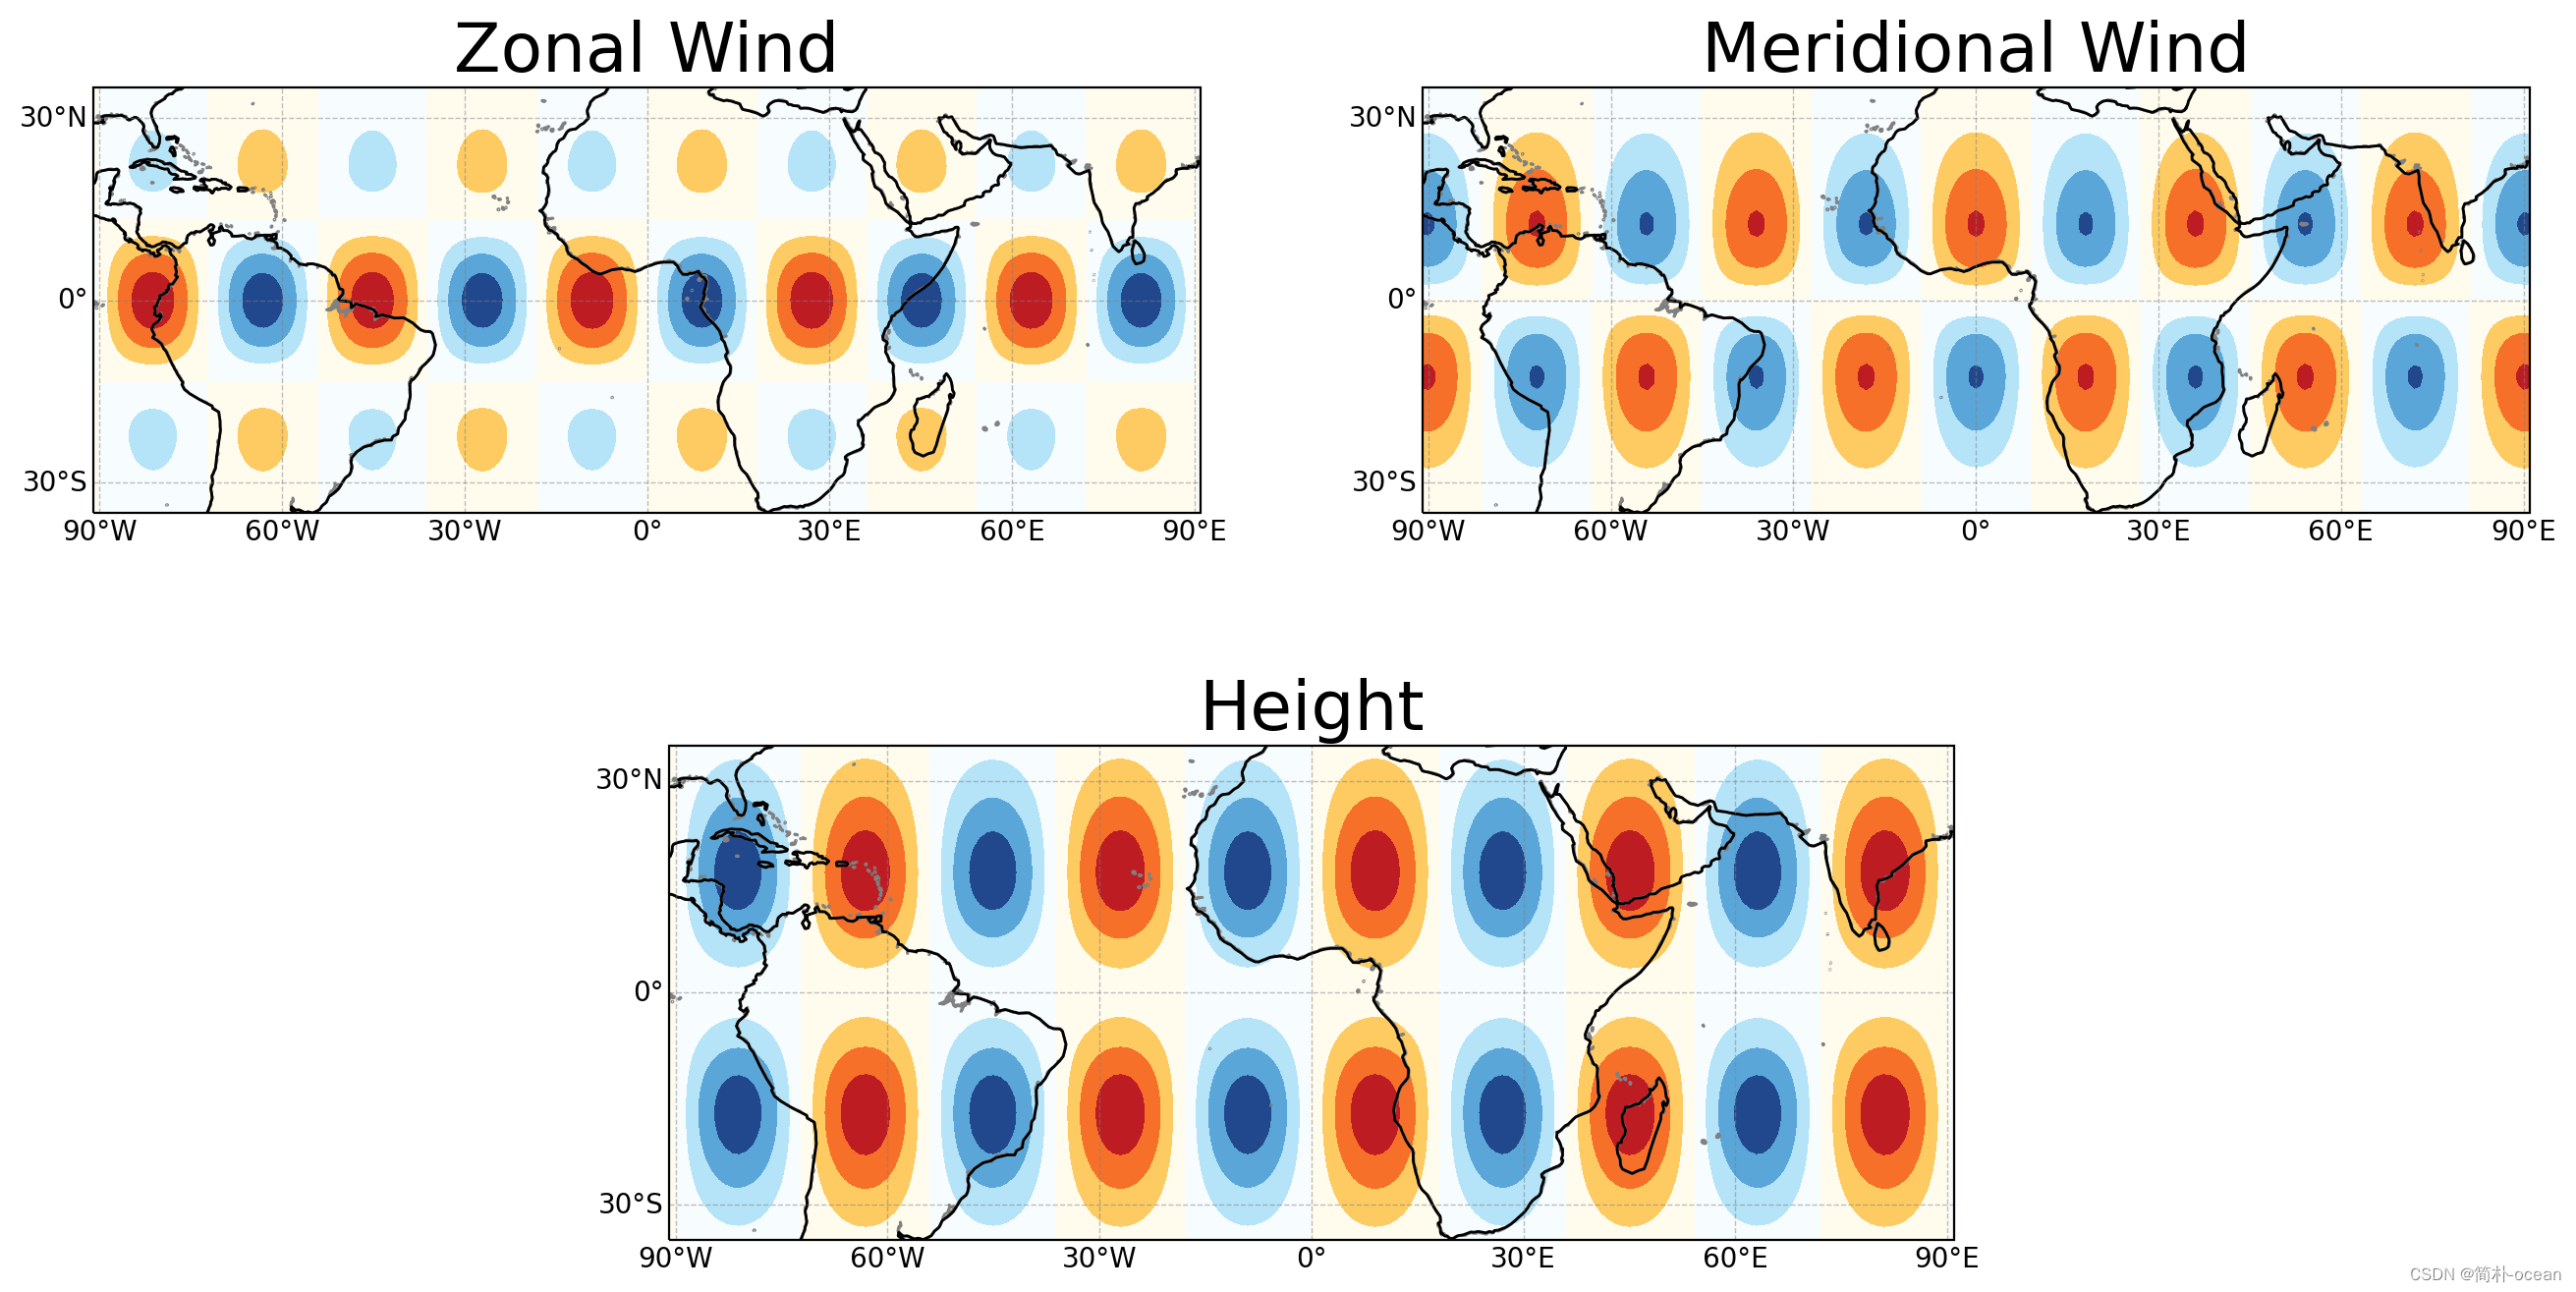
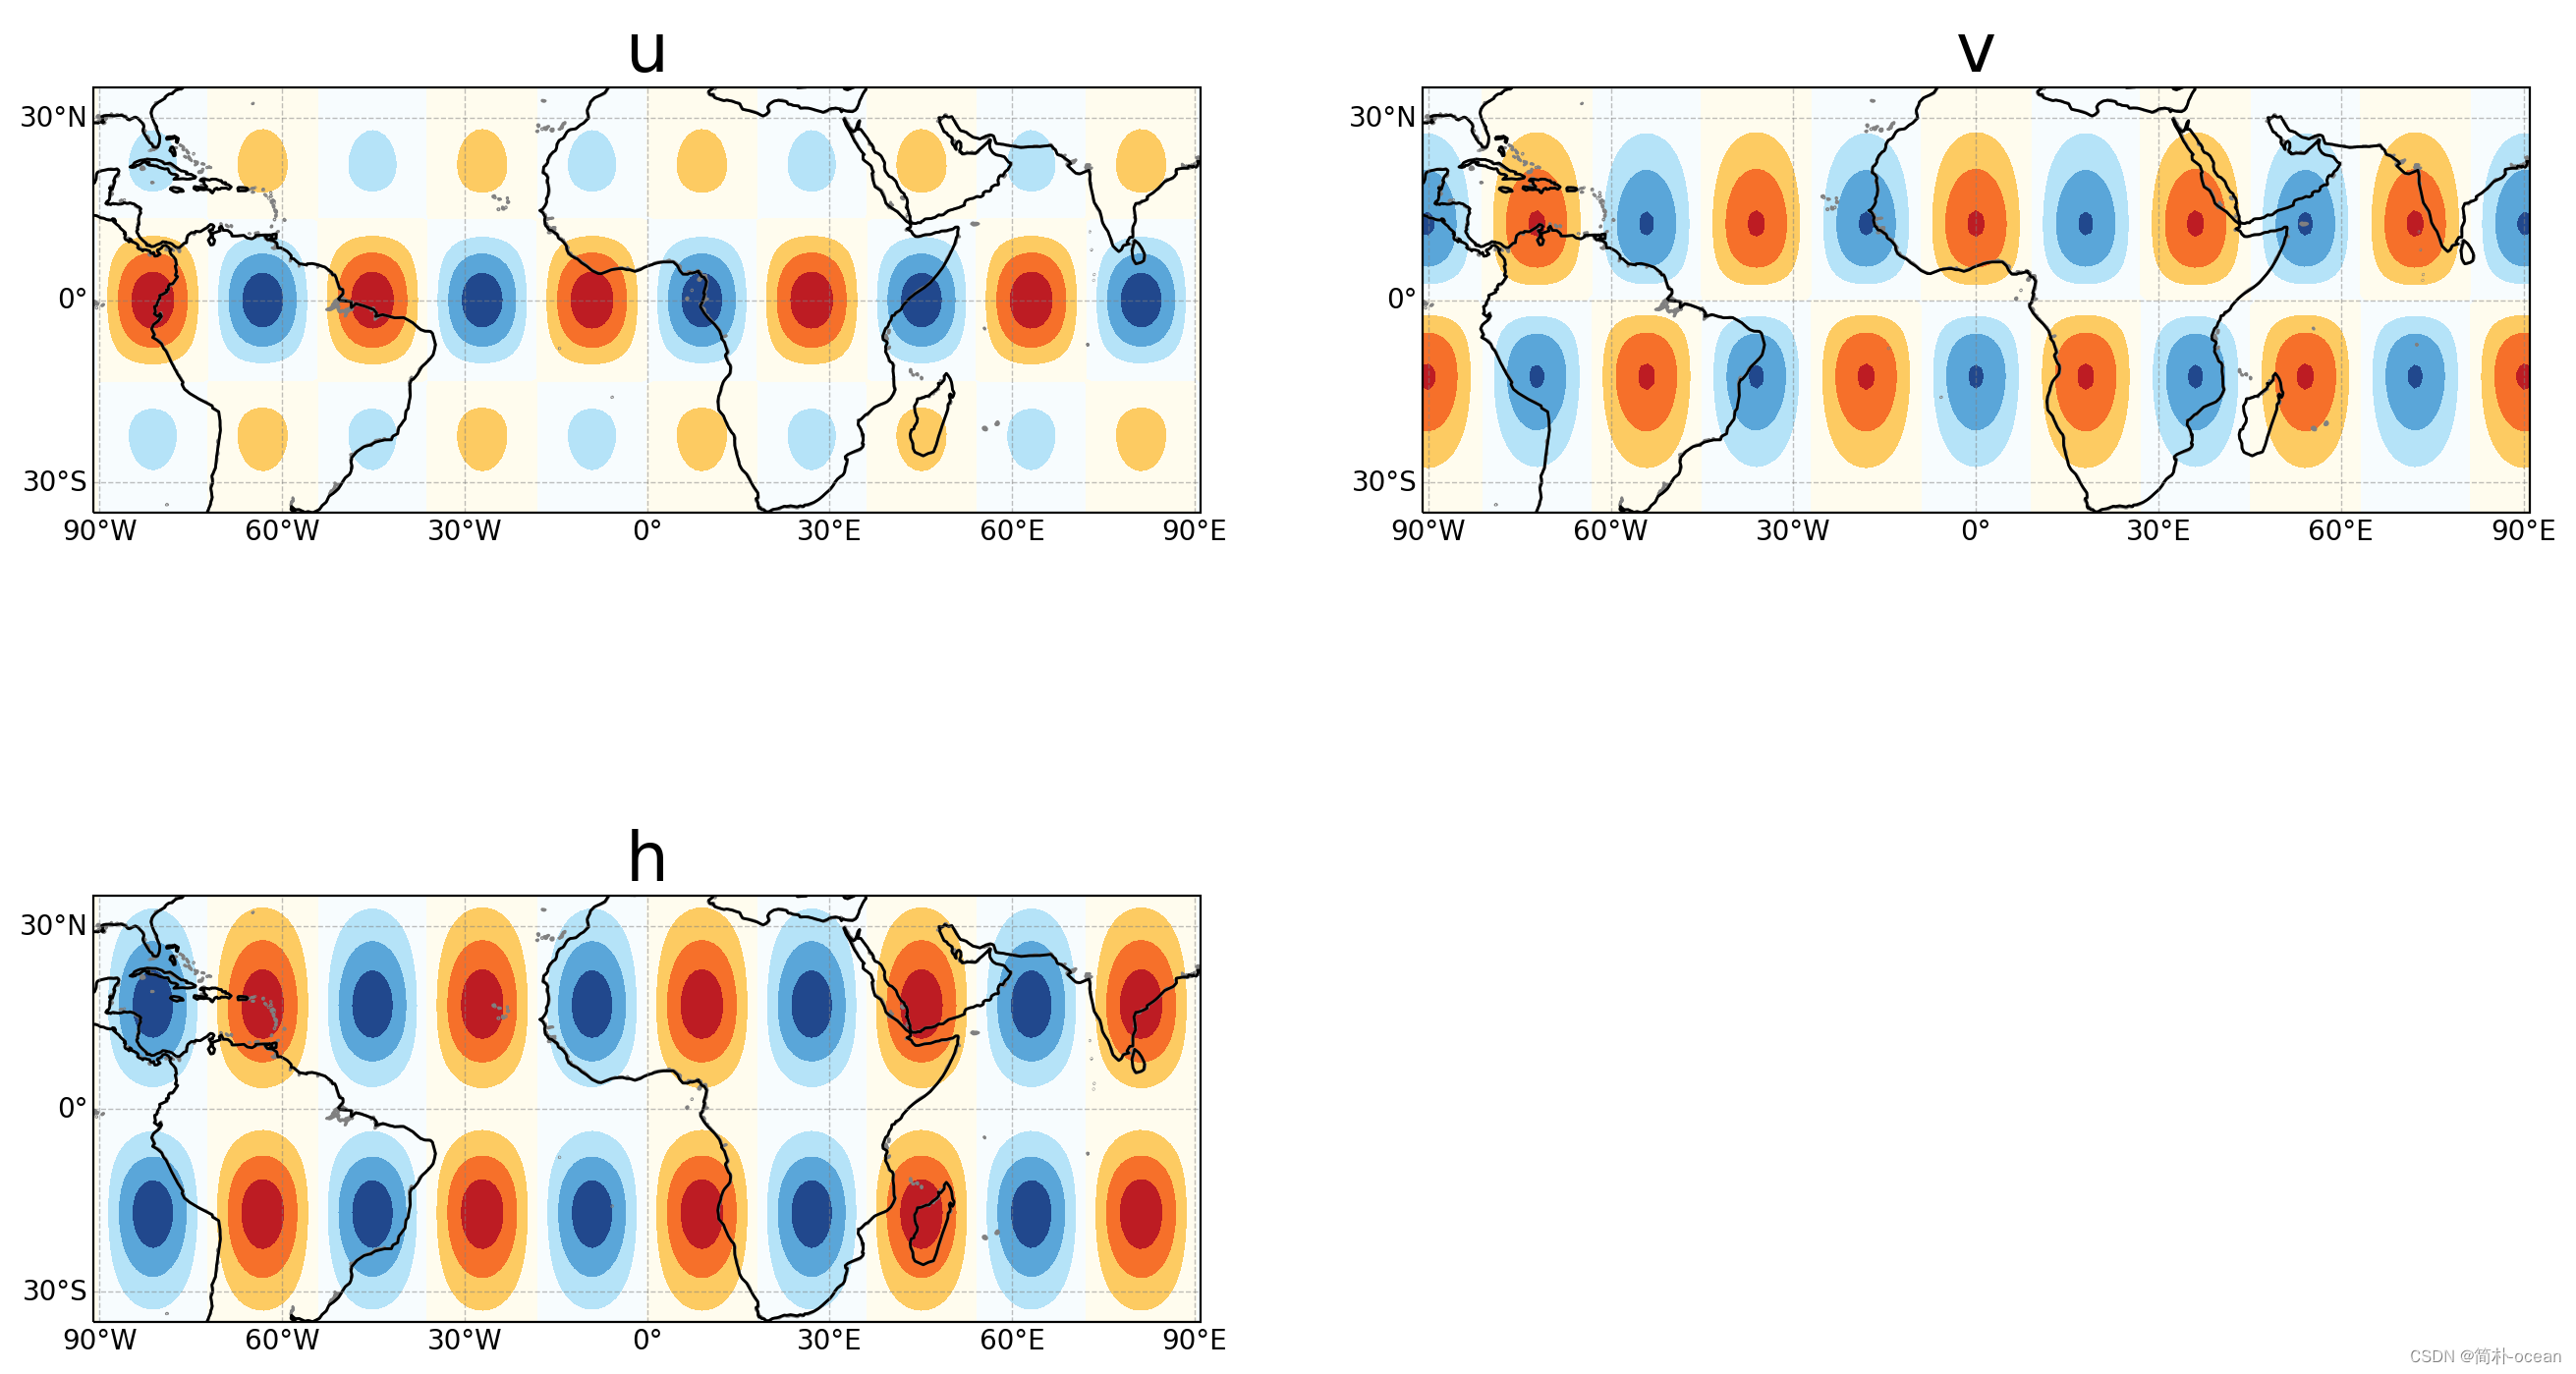
这里仅仅做一个尝试,当然,没有必要非得让它居中嘛:
proj = ccrs.PlateCarree(central_longitude=0)

fig, ax = plt.subplots(nrows=2, ncols=2, figsize=(16, 10), dpi=200,
                       subplot_kw={'projection': proj})

title = ['u', 'v', 'h']
box = [-91, 91, -35, 35]

for i, var in enumerate([u, v, h]):
    print(i)
    make_map(ax.flatten()[i], title[i])
    plot = ax.flatten()[i].contourf(lon, lat, var.T,
                                    cmap=cmaps.BlueWhiteOrangeRed,
                                    transform=ccrs.PlateCarree())
    ax.flatten()[i].set_extent(box, crs=ccrs.PlateCarree())
    # 删除最后一个子图
fig.delaxes(ax.flatten()[3])

# fig.subplots_adjust(hspace=0.1)

# 显示图形
plt.show()

# 显示图形
plt.show()
就下面这样也很好,或者干脆就是一个1x3或者3x1的子图分布也可以,实在不行,后期通过ai也可以任意拼接
全部的绘图代码:
def make_map(ax, title):
    ax.set_extent(box, crs=ccrs.PlateCarree())
    land = cfeature.NaturalEarthFeature('physical',
                                        'land',
                                        '50m',
                                        edgecolor='gray',
                                        facecolor='None',
                                        )
    ax.add_feature(land)  # set land color
    ax.coastlines()  # set coastline resolution
    gl = ax.gridlines(draw_labels=True,
                      linewidth=0.5,
                      color='gray',
                      alpha=0.5,
                      linestyle='--')

    gl.top_labels = False  # 不显示上边界的标签
    gl.right_labels = False  # 不显示右边界的标签
    gl.xlocator = ticker.MultipleLocator(base=30)
    gl.ylocator = ticker.MultipleLocator(base=30)
    ax.set_title(title, fontsize=25, loc='center')

    return ax
proj = ccrs.PlateCarree(central_longitude=0)
fig = plt.figure(figsize=(16, 8), dpi=200)
gs = GridSpec(2, 2, figure=fig, width_ratios=[1, 1], height_ratios=[1, 1])
ax = [plt.subplot(gs[0, 0], projection=proj), plt.subplot(gs[0, 1], projection=proj),
      plt.subplot(gs[1, :2], projection=proj)]

title = ['Zonal Wind', 'Meridional Wind', 'Height']
box = [-91, 91, -35, 35]

for i, var in enumerate([u, v, h]):
    make_map(ax[i], title[i])
    plot = ax[i].contourf(lon, lat, var.T, cmap=cmaps.BlueWhiteOrangeRed,transform=ccrs.PlateCarree())
    ax[i].set_extent(box, crs=ccrs.PlateCarree())

# 设置第三个子图的位置
ax[2].set_position([0.25, 0.1, 0.5, 0.8])

# 调整子图间距
plt.subplots_adjust(hspace=0.4)
plt.show()
![[开源项目推荐]privateGPT使用体验和修改](https://img-blog.csdnimg.cn/9f6324be5ab54dd1ad34a500acbf1b18.png)
