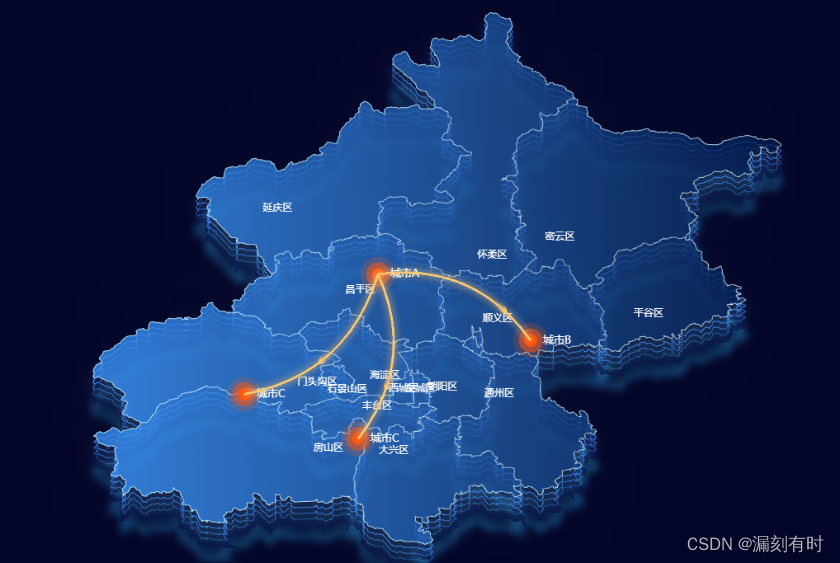
        echarts.registerMap("丹东", getData());
      let data = getData().features.map((item) => {

        return {

          name: item.properties.name,
        };
      });

      const points = [
            [116.289929,40.265374],
            [116.754101,40.063877],
            [116.229504,39.764735],
            [115.883434,39.899721]
    ]
      let option = {

        backgroundColor:"#030528",
        geo: [
          {

            map: "丹东",
            aspectScale: 1,
            zoom: 0.65,
            layoutCenter: ["50%", "50%"],
            layoutSize: "180%",
            show: true,
            roam: false,
            label: {

              emphasis: {

                show: false,
              },
            },
            itemStyle: {

              normal: {

                borderColor: "#c0f3fb",
                borderWidth: 1,
                shadowColor: "#8cd3ef",
                shadowOffsetY: 10,
                shadowBlur: 120,
                areaColor: "transparent",
              },
            }
          },
          // 重影
          {

            type: "map",
            map: "丹东",
            zlevel: -1,
            aspectScale: 1,
            zoom: 0.65,
            layoutCenter: ["50%", "51%"],
            layoutSize: "180%",
            roam: false,
            silent: true,
            itemStyle: {

              normal: {

                borderWidth: 1,
                // borderColor:"rgba(17, 149, 216,0.6)",
                borderColor: "rgba(58,149,253,0.8)",
                shadowColor: "rgba(172, 122, 255,0.5)",
                shadowOffsetY: 5,
                shadowBlur: 15,
                areaColor: "rgba(5,21,35,0.1)",
              },
            },
          },
          {

            type: "map",
            map: "丹东",
            zlevel: -2,
            aspectScale: 1,
            zoom: 0.65,
            layoutCenter: ["50%", "52%"],
            layoutSize: "180%",
            roam: false,
            silent: true,
            itemStyle: {

              normal: {

                borderWidth: 1,
                // borderColor: "rgba(57, 132, 188,0.4)",
                borderColor: "rgba(58,149,253,0.6)",
                shadowColor: "rgba(65, 214, 255,0.6)",
                shadowOffsetY: 5,
                shadowBlur: 15,
                areaColor: "rgba(5,21,35,0.1)",
              },
            },
          },
          {

            type: "map",
            map: "丹东",
            zlevel: -3,
            aspectScale: 1,
            zoom: 0.65,
            layoutCenter: ["50%", "53%"],
            layoutSize: "180%",
            roam: false,
            silent: true,
            itemStyle: {

              normal: {

                borderWidth: 1,
                // borderColor: "rgba(11, 43, 97,0.8)",
                borderColor: "rgba(58,149,253,0.4)",
                shadowColor: "rgba(29, 111, 165,1)",
                shadowOffsetY: 15,
                shadowBlur: 10,
                areaColor: "rgba(5,21,35,0.1)",
              },
            },
          },
          {

            type: "map",
            map: "丹东",
            zlevel: -4,
            aspectScale: 1,
            zoom: 0.65,
            layoutCenter: ["50%", "54%"],
            layoutSize: "180%",
            roam: false,
            silent: true,
            itemStyle: {

              normal: {

                borderWidth: 5,
                // borderColor: "rgba(11, 43, 97,0.8)",
                borderColor: "rgba(5,9,57,0.8)",
                shadowColor: "rgba(29, 111, 165,0.8)",
                shadowOffsetY: 15,
                shadowBlur: 10,
                areaColor: "rgba(5,21,35,0.1)",
              },
            },
          },
        ],
        series: [
          {

            name: "丹东市数据",
            type: "map",
            map: "丹东", // 自定义扩展图表类型
            aspectScale: 1,
            zoom: 0.65, // 缩放
            showLegendSymbol: true,
            label: {

              normal: {

                show: true,
                textStyle: {
    color: "#fff", fontSize: "120%" },
              },
              emphasis: {

                show: false,
              },
            },
            itemStyle: {

              normal: {

                areaColor: {

                  type: "linear",
                  x: 1200,
                  y: 0,
                  x2: 0,
                  y2: 0,
                  colorStops: [
                    {

                      offset: 0,
                      color: "rgba(3,27,78,0.75)", // 0% 处的颜色
                    },
                    {

                      offset: 1,
                      color: "rgba(58,149,253,0.75)", // 50% 处的颜色
                    },
                  ],
                  global: true, // 缺省为 false
                },
                borderColor: "#fff",
                borderWidth: 0.2,
              },
              emphasis: {

                show: false,
                color: "#fff",
                areaColor: "rgba(0,254,233,0.6)",
              },
            },
            layoutCenter: ["50%", "50%"],
            layoutSize: "180%",
            markPoint: {

              symbol: "none",
            },
            data: data,
          },
          {

              type: 'lines',
                zlevel: 2,
                effect