一、说明
当我们的数据标签具有比另一个类别更多的类别时,我们说我们有数据不平衡。 如果数据集数据不平恒,如何评估分类器的效果?如果分类器不好,如何改进分类器?本篇将讲述不平衡数据下,混淆矩阵的应用。
二、数据的
我们的数据是不平衡的,因为在我们的训练数据中,徒步旅行者、动物、树木和岩石的数量大不相同。我们可以通过将这些数据制成表格来看到这一点:
<span style="color:rgba(0, 0, 0, 0.8)"><span style="background-color:#ffffff"><span style="background-color:#f9f9f9"><span style="color:#242424">Label     Hiker     Animal     Tree     Rock
Count      <span style="color:#1c00cf">400</span>       <span style="color:#1c00cf">200</span>        <span style="color:#1c00cf">800</span>      <span style="color:#1c00cf">800</span></span></span></span></span>
请注意,大多数数据都是树木或岩石。平衡数据集没有这个问题。例如,如果我们试图预测一个物体是徒步旅行者、动物、树木还是岩石,理想情况下,我们希望所有类别的数量相等,如下所示:
Label     Hiker     Animal     Tree     Rock
Count 550 550 550 550 如果我们只是试图预测一个物体是否是徒步旅行者,理想情况下,我们需要相同数量的徒步旅行者和非徒步旅行者对象:
Label     Hiker     Non-Hiker
Count     1100        1100
三、为什么数据不平衡很重要?
数据不平衡很重要,因为模型可以在不需要的时候学会模仿这些不平衡。例如,假设我们训练了一个逻辑回归模型来识别对象是远足者还是非远足者r。如果训练数据在很大程度上由“远足者”标签主导,那么训练将使模型偏向于几乎总是返回“远足者”标签。然而,在现实世界中,我们可能会发现无人机遇到的大多数东西都是树木。有偏见的模型可能会将许多这些树标记为徒步旅行者。
之所以出现这种现象,是因为默认情况下,成本函数确定是否给出了正确的响应。这意味着对于有偏差的数据集,模型达到最佳性能的最简单方法是几乎忽略所提供的特征,并且始终或几乎总是返回相同的答案。这可能会产生毁灭性的后果。例如,假设我们的徒步旅行者/非徒步旅行者模型是在每 1000 个样本中只有一个包含徒步旅行者的数据上进行训练的。一个学会了每次都返回“非徒步旅行者”的模型的准确率为 99.9%!这个统计数据看起来很出色,但该模型毫无用处,因为它永远不会告诉我们是否有人在山上,如果雪崩发生,我们将不知道如何营救他们。
四、混淆矩阵中的偏差
混淆矩阵是识别数据不平衡或模型偏差的关键。在理想情况下,测试数据具有近似偶数个标签,并且模型所做的预测也大致分布在标签上。对于 1000 个样本,一个无偏但经常得到错误答案的模型可能如下所示:

我们可以看出输入数据是无偏的,因为行总和相同(每行 500),表明一半标签是“true”,一半是“false”。同样,我们可以看到该模型给出了公正的响应,因为它一半时间返回 true,另一半时间返回 false。
相比之下,有偏差的数据大多包含一种标签,如下所示:

同样,有偏差的模型主要产生一种标签,如下所示:

五、模型偏差不是准确性
请记住,偏见不是准确性。例如,前面的一些示例有偏差,而其他示例则没有偏差,但它们都显示了一个模型,该模型在 50% 的时间内都能获得正确的答案。作为一个更极端的例子,下面的矩阵显示了一个不准确的无偏模型:

请注意行数和列数加起来如何达到 500,表明两个数据都是平衡的,并且模型没有偏差。不过,这个模型几乎所有的响应都是错误的!
当然,我们的目标是让模型准确无误,例如:

但我们需要确保我们的准确模型没有偏见,仅仅因为数据是:

在此示例中,请注意实际标签大多为 false(左列,显示数据不平衡),并且模型也经常返回 false(顶行,显示模型偏差)。此模型不擅长正确给出 true 响应。
六、避免数据不平衡的后果
避免数据不平衡后果的一些简单方法是:
- 通过更好的数据选择来避免它。
- 对数据进行重采样,使其包含少数标注分类的重复项。
- 对成本函数进行更改,使其优先处理不太常见的标签。例如,如果对树给出了错误的响应,则成本函数可能返回 1;而如果对 Hiker 做出错误的响应,它可能会返回 10。
在本练习中,我们将仔细研究不平衡的数据集,它们对预测的影响以及如何解决它们。我们还将使用混淆矩阵来评估模型更新。
七、数据可视化
就像在前面的练习中一样,我们使用一个数据集来表示在山上发现的不同类别的对象:
import pandas
!wget https://raw.githubusercontent.com/MicrosoftDocs/mslearn-introduction-to-machine-learning/main/graphing.py
!wget https://raw.githubusercontent.com/MicrosoftDocs/mslearn-introduction-to-machine-learning/main/Data/snow_objects.csv
!wget https://raw.githubusercontent.com/MicrosoftDocs/mslearn-introduction-to-machine-learning/main/Data/snow_objects_balanced.csv

#Import the data from the .csv file
dataset = pandas.read_csv('snow_objects.csv', delimiter="\t")

# Let's have a look at the data
dataset
size roughness color motion label
0 50.959361 1.318226 green 0.054290 tree
1 60.008521 0.554291 brown 0.000000 tree
2 20.530772 1.097752 white 1.380464 tree
3 28.092138 0.966482 grey 0.650528 tree
4 48.344211 0.799093 grey 0.000000 tree
... ... ... ... ... ...
2195 1.918175 1.182234 white 0.000000 animal
2196 1.000694 1.332152 black 4.041097 animal
2197 2.331485 0.734561 brown 0.961486 animal
2198 1.786560 0.707935 black 0.000000 animal
2199 1.518813 1.447957 brown 0.000000 animal
2200 rows × 5 columns回想一下,我们有一个不平衡的数据集。有些类比其他类更频繁:
import graphing # custom graphing code. See our GitHub repo for details

# Plot a histogram with counts for each label
graphing.multiple_histogram(dataset, label_x="label", label_group="label", title="Label distribution")
八、使用二元分类
在这里,我们将构建一个二元分类模型。我们想预测雪中的物体是“徒步旅行者”还是“非徒步旅行者”。为此,我们首先需要向数据集添加另一列,并将其设置为true,其中原始标签为hiker,并将其设置为false,并将其设置为其他任何内容:
# Add a new label with true/false values to our dataset
dataset["is_hiker"] = dataset.label == "hiker"

# Plot frequency for new label
graphing.multiple_histogram(dataset, label_x="is_hiker", label_group="is_hiker", title="Distribution for new binary label 'is_hiker'")
现在我们的数据集中只有两类标签,但我们使其更加不平衡。
让我们使用 is_hiker 作为目标变量来训练随机森林模型,然后在训练集和测试集上测量其准确性:
from sklearn.ensemble import RandomForestClassifier
from sklearn.model_selection import train_test_split
# import matplotlib.pyplot as plt
# from sklearn.metrics import plot_confusion_matrix
from sklearn.metrics import accuracy_score

# Custom function that measures accuracy on different models and datasets
# We will use this in different parts of the exercise
def assess_accuracy(model, dataset, label):
    """
    Asesses model accuracy on different sets
    """
    actual = dataset[label]
    predictions = model.predict(dataset[features])
    acc = accuracy_score(actual, predictions)
    return acc

# Split the dataset in an 70/30 train/test ratio.
train, test = train_test_split(dataset, test_size=0.3, random_state=1, shuffle=True)

# define a random forest model
model = RandomForestClassifier(n_estimators=1, random_state=1, verbose=False)

# Define which features are to be used (leave color out for now)
features = ["size", "roughness", "motion"]

# Train the model using the binary label
model.fit(train[features], train.is_hiker)

print("Train accuracy:", assess_accuracy(model,train, "is_hiker"))
print("Test accuracy:", assess_accuracy(model,test, "is_hiker"))
Train accuracy: 0.9532467532467532
Test accuracy: 0.906060606060606准确性对于训练集和测试集来说都很好,但请记住,此指标并不是成功的绝对衡量标准。我们应该绘制一个混淆矩阵,看看模型的实际表现:
# sklearn has a very convenient utility to build confusion matrices
from sklearn.metrics import confusion_matrix
import plotly.figure_factory as ff

# Calculate the model's accuracy on the TEST set
actual = test.is_hiker
predictions = model.predict(test[features])

# Build and print our confusion matrix, using the actual values and predictions
# from the test set, calculated in previous cells
cm = confusion_matrix(actual, predictions, normalize=None)

# Create the list of unique labels in the test set, to use in our plot
# I.e., ['True', 'False',]
unique_targets = sorted(list(test["is_hiker"].unique()))

# Convert values to lower case so the plot code can count the outcomes
x = y = [str(s).lower() for s in unique_targets]

# Plot the matrix above as a heatmap with annotations (values) in its cells
fig = ff.create_annotated_heatmap(cm, x, y)

# Set titles and ordering
fig.update_layout(  title_text="<b>Confusion matrix</b>",
                    yaxis = dict(categoryorder = "category descending")
                    )

fig.add_annotation(dict(font=dict(color="black",size=14),
                        x=0.5,
                        y=-0.15,
                        showarrow=False,
                        text="Predicted label",
                        xref="paper",
                        yref="paper"))

fig.add_annotation(dict(font=dict(color="black",size=14),
                        x=-0.15,
                        y=0.5,
                        showarrow=False,
                        text="Actual label",
                        textangle=-90,
                        xref="paper",
                        yref="paper"))

# We need margins so the titles fit
fig.update_layout(margin=dict(t=80, r=20, l=120, b=50))
fig['data'][0]['showscale'] = True
fig.show()
混淆矩阵向我们表明,尽管报告了指标,但该模型并不是非常精确。在测试集中存在的660个样本(占总样本的30%)中,它预测了29个假阴性和33个假阳性。
更重要的是,看看底行,它显示了当模型被显示有关徒步旅行者的信息时发生了什么:它几乎有40%的时间得到错误的答案。这意味着它无法正确识别山上近40%的人!如果我们使用这个模型对平衡集合进行预测会发生什么?
让我们加载一个数据集,其中包含相同数量的“徒步旅行者”和“非徒步旅行者”的结果,然后使用该数据进行预测:
# Load and print umbiased set
#Import the data from the .csv file
balanced_dataset = pandas.read_csv('snow_objects_balanced.csv', delimiter="\t")

#Let's have a look at the data
graphing.multiple_histogram(balanced_dataset, label_x="label", label_group="label", title="Label distribution")
这个新数据集在类之间是平衡的,但出于我们的目的,我们希望它在徒步旅行者和非徒步旅行者之间保持平衡。为简单起见,让我们将徒步旅行者加上非徒步旅行者的随机抽样。
# Add a new label with true/false values to our dataset
balanced_dataset["is_hiker"] = balanced_dataset.label == "hiker"

hikers_dataset = balanced_dataset[balanced_dataset["is_hiker"] == 1]
nonhikers_dataset = balanced_dataset[balanced_dataset["is_hiker"] == False]
# take a random sampling of non-hikers the same size as the hikers subset
nonhikers_dataset = nonhikers_dataset.sample(n=len(hikers_dataset.index), random_state=1)
balanced_dataset = pandas.concat([hikers_dataset, nonhikers_dataset])

# Plot frequency for "is_hiker" labels
graphing.multiple_histogram(balanced_dataset, label_x="is_hiker", label_group="is_hiker", title="Label distribution in balanced dataset")
请注意,对于两个类,is_hiker标签具有相同的 true 和 false 数。我们现在使用的是类平衡数据集。让我们使用之前训练的模型在此集合上运行预测:
# Test the model using a balanced dataset
actual = balanced_dataset.is_hiker
predictions = model.predict(balanced_dataset[features])

# Build and print our confusion matrix, using the actual values and predictions
# from the test set, calculated in previous cells
cm = confusion_matrix(actual, predictions, normalize=None)

# Print accuracy using this set
print("Balanced set accuracy:", assess_accuracy(model,balanced_dataset, "is_hiker"))
Balanced set accuracy: 0.754正如预期的那样,我们使用不同的集合时准确性明显下降。再次,让我们直观地分析它的性能:
# plot new confusion matrix
# Create the list of unique labels in the test set to use in our plot
unique_targets = sorted(list(balanced_dataset["is_hiker"].unique()))

# Convert values to lower case so the plot code can count the outcomes
x = y = [str(s).lower() for s in unique_targets]

# Plot the matrix above as a heatmap with annotations (values) in its cells
fig = ff.create_annotated_heatmap(cm, x, y)

# Set titles and ordering
fig.update_layout(  title_text="<b>Confusion matrix</b>",
                    yaxis = dict(categoryorder = "category descending")
                    )

fig.add_annotation(dict(font=dict(color="black",size=14),
                        x=0.5,
                        y=-0.15,
                        showarrow=False,
                        text="Predicted label",
                        xref="paper",
                        yref="paper"))

fig.add_annotation(dict(font=dict(color="black",size=14),
                        x=-0.15,
                        y=0.5,
                        showarrow=False,
                        text="Actual label",
                        textangle=-90,
                        xref="paper",
                        yref="paper"))

# We need margins so the titles fit
fig.update_layout(margin=dict(t=80, r=20, l=120, b=50))
fig['data'][0]['showscale'] = True
fig.show()

混淆矩阵证实了使用此数据集的准确性很差,但是当我们在早期的训练和测试集中拥有如此出色的指标时,为什么会发生这种情况?
回想一下,第一个模型严重不平衡。徒步旅行者课程约占结果的22%。当这种不平衡发生时,分类模型没有足够的数据来学习少数类的模式,因此会偏向多数类!
不平衡集可以通过多种方式解决:
- 改进数据选择
- 对数据集
进行重采样 - 使用加权类 - >我们将在练习中重点讨论这个问题
九、使用类权重平衡数据集
我们可以根据多数类和少数类的分布为其分配不同的权重,并修改我们的训练算法,使其在训练阶段考虑这些信息。
然后,当少数类被错误分类时,它将惩罚错误,实质上是“强迫”模型更好地学习其特征和模式。
要使用加权类,我们必须使用原始训练集重新训练模型,但这次告诉算法在计算误差时使用权重:
# Import function used in calculating weights
from sklearn.utils import class_weight

# Retrain model using class weights
# Using class_weight="balanced" tells the algorithm to automatically calculate weights for us
weighted_model = RandomForestClassifier(n_estimators=1, random_state=1, verbose=False, class_weight="balanced")
# Train the weighted_model using binary label
weighted_model.fit(train[features], train.is_hiker)

print("Train accuracy:", assess_accuracy(weighted_model,train, "is_hiker"))
print("Test accuracy:", assess_accuracy(weighted_model, test, "is_hiker"))
Train accuracy: 0.962987012987013
Test accuracy: 0.9090909090909091使用加权类后,列车精度几乎保持不变,而测试精度则略有提高(约1%)。让我们再次使用平衡预测集看看结果是否得到改善:
print("Balanced set accuracy:", assess_accuracy(weighted_model, balanced_dataset, "is_hiker"))

# Test the weighted_model using a balanced dataset
actual = balanced_dataset.is_hiker
predictions = weighted_model.predict(balanced_dataset[features])

# Build and print our confusion matrix, using the actual values and predictions
# from the test set, calculated in previous cells
cm = confusion_matrix(actual, predictions, normalize=None)
Balanced set accuracy: 0.761平衡集的准确度提高了大约 4%,但我们仍然应该尝试可视化和理解新结果。
十、最终混淆矩阵
现在,我们可以使用在加权类数据集上训练的模型绘制最终的混淆矩阵,表示对平衡数据集的预测:
# Plot the matrix above as a heatmap with annotations (values) in its cells
fig = ff.create_annotated_heatmap(cm, x, y)

# Set titles and ordering
fig.update_layout(  title_text="<b>Confusion matrix</b>",
                    yaxis = dict(categoryorder = "category descending")
                    )

fig.add_annotation(dict(font=dict(color="black",size=14),
                        x=0.5,
                        y=-0.15,
                        showarrow=False,
                        text="Predicted label",
                        xref="paper",
                        yref="paper"))

fig.add_annotation(dict(font=dict(color="black",size=14),
                        x=-0.15,
                        y=0.5,
                        showarrow=False,
                        text="Actual label",
                        textangle=-90,
                        xref="paper",
                        yref="paper"))

# We need margins so the titles fit
fig.update_layout(margin=dict(t=80, r=20, l=120, b=50))
fig['data'][0]['showscale'] = True
fig.show()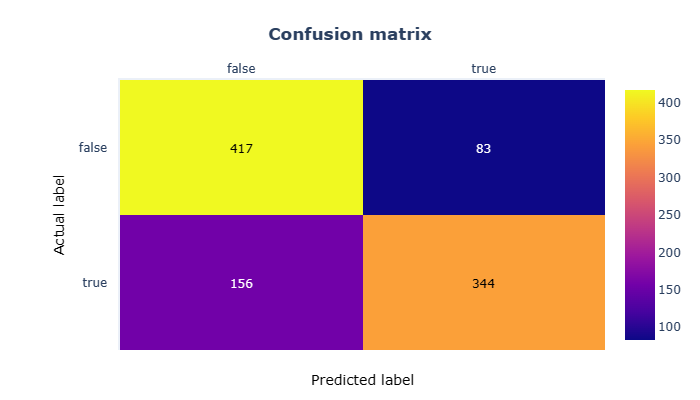
虽然结果可能看起来有点令人失望,但我们现在有21%的错误预测(FNs + FPs),而之前的实验为25%。
正确预测(TPs + TNs)从74.7%上升到78.7%。全方位的 4% 改善是否显着?
请记住,我们用于训练模型的数据相对较少,并且对于不同的样本,我们可用的特征可能仍然非常相似(例如,徒步旅行者和动物往往很小,不粗糙并且移动很多),尽管我们做出了努力,但模型仍然难以做出正确的预测。
我们只需要更改一行代码即可获得更好的结果,因此似乎值得付出努力!
十一、总结
在本练习中,我们讨论了以下概念:
- 创建新的标签字段,以便我们可以使用具有多个类的数据集执行二元分类。
- 不平衡集合上的训练如何对性能产生负面影响,尤其是在使用来自平衡数据集的看不见的数据时。
- 使用混淆矩阵评估二元分类模型的结果。
- 在训练模型和评估结果时使用加权类来解决类不平衡问题。

