一、说明
到目前为止,在我们的讨论中,我已经交替使用了“傅里叶变换”和“快速傅里叶变换(FFT)”。在这一点上,值得注意的是区别!FFT 是“离散”傅里叶变换 (DFT) 的有效算法实现。“离散”表示我们可以将变换应用于一系列点,而不是完整的连续信号。在数据科学应用中,我们通常有一组样本,而不是一个连续的输入函数,所以我们通常对DFT感兴趣!
二、傅里叶变换函数
2.1 np.fft.fft
FFT将时域或空间域中的实数或复数信号作为输入,并返回离散傅里叶变换。正如我们所讨论的,np.abs允许我们恢复频率分量的幅度,np.angle允许我们恢复相位。
我们之前已经见过这个功能(请参阅本系列前面的故事)!我们将回到这个笔记,但它足够重要,说两次!傅里叶变换可以应用于复杂的输入信号。对于复杂输入,傅里叶变换返回的负频率项对于完全重建信号是必要的。对于实际输入(如我们在本系列中到目前为止研究的输入),只需要正频率项。您仍然可以在实值信号上使用完整的FFT,只要知道您可以使用重复值较少的RFFT(请参阅下面的更多上下文)。
索引 0: 第一个值有时称为“DC”项(来自电气工程领域的“直流电”),并用作偏移项。它不会振荡,对应于 0Hz(因此是直流)。它只是信号的总和!
如果 N 是偶数,则索引 1 到 ((N/2) -1,否则为 1 到 ((N-1)/2): 正频率分量按越来越正的顺序排列。
如果 N 是偶数,则索引 (N/2) 到 (N-1),否则 ((N+1)/2) 到 (N-1): 负频率分量以递减的负(即越来越正)的顺序排列。
提示!如果您对哪些元素对应于哪些频率感到困惑,请查看np.fft.fftfreq!它会告诉你频率的顺序,例如 np.fft.fftfreq(5) 告诉我们频率箱中心 0.、0.2、0.4、-0.4 和 -0.2。
2.2 np.fft.ifft
IFFT将傅里叶变换作为输入,并返回时域或空间域中的真实或复杂的重建信号。
正如我们所讨论的,逆FFT允许我们从频域转换回时间/空间域。正如预期的那样,如果我们将IFFT应用于信号的FFT,我们最终会回到起点。
arr = np.random.normal(loc=0, scale=10, size=20)
np.allclose(np.fft.ifft(np.fft.fft(arr)), arr)
# >>> True
IFFT(FFT(x)) ≈ x,反性质成立!
2.3 np.fft.fftshift
FFT移位将傅里叶变换作为输入,并将值从“标准”顺序重新排序为“自然”顺序:最负到零再到最正。
如果将组件按自然顺序排序,则可视化和推理FFT的结果会容易得多。标准订单可能会非常混乱!
np.fft.fftfreq(5)
# >>> array([ 0. ,  0.2,  0.4, -0.4, -0.2])

np.fft.fftshift(np.fft.fftfreq(5))
# >>> array([-0.4, -0.2,  0. ,  0.2,  0.4])
FFTSHIFT将频率中心从最负到最正排列。
2.4 np.fft.ifftshift
FFT移位将傅里叶变换作为输入,并将值从“自然”顺序重新排序为“标准”顺序:直流项,然后是正频率,然后是负频率。
np.fft.fftfreq(5)
# >>> array([ 0. ,  0.2,  0.4, -0.4, -0.2])

np.fft.fftshift(np.fft.fftfreq(5))
# >>> array([-0.4, -0.2,  0. ,  0.2,  0.4])

np.fft.ifftshift(np.fft.fftshift(np.fft.fftfreq(5)))
# >>> array([ 0. ,  0.2,  0.4, -0.4, -0.2])
IFFTSHIFT恢复了“标准”订单。
2.5 np.fft.rfft
RFFT将时域或空间域中的实数信号作为输入,并返回离散傅里叶变换。
真实信号的FFT具有本文前面提到的有趣特性:正负频率分量相互镜像。从形式上讲,这意味着真实信号的傅里叶变换是“埃尔米特变换”。其数学原因令人着迷,我希望在以后的文章中对其进行扩展。不过,就目前而言,我们只需要注意到这是真的。RFFT允许我们跳过这些多余的术语!
arr = np.random.normal(loc=0, scale=10, size=5)
np.fft.fftfreq(len(arr))
# >>> [ 0.   0.2  0.4 -0.4 -0.2 ]

arr_fft = np.fft.fft(arr)  # rounded for display
# >>> [ -2. +0.j -11.+14.j   4.+14.j   4.-14.j -11.-14.j ]
# Notice that the neg. and pos. frequency components are mirrored!

arr_rfft = np.fft.rfft(arr)  # rounded for display
# >>> [ -2. +0.j -11.+14.j   4.+14.j ]
# For a real signal, we can just look at the pos. frequency components
RFFT利用埃尔米特对称性来跳过重复的负频率分量。
2.6 np.fft.irfft
IRFFT 将实值函数的傅里叶变换作为输入,并返回时域或空间域中的真实重建信号。
arr = np.random.normal(loc=0, scale=10, size=20)
np.allclose(np.fft.irfft(np.fft.rfft(arr)), arr)
# >>> True
IRFFT(RFFT(x)) ≈ x,反性质成立!
2.7 np.fft.fft2
FFT2 将时域或空间域中的实数或复数 2D 信号作为输入,并返回离散傅里叶变换。正如我们所讨论的,np.abs允许我们恢复频率分量的幅度,np.angle允许我们恢复相位。
在之前的一篇文章中,我们证明了我们可以使用相同的逻辑来分解2D信号中频率分量的幅度和角度(如图像!np.fft.fft2 允许我们这样做:计算输入的二维快速傅里叶变换。
2.8 np.fft.ifft2
IFFT将傅里叶变换作为输入,并在时域或空间域中返回真实或复杂的2D重建信号。
正如预期的那样,我们有一个用于二维输入的类似逆变换!
arr2 = np.random.normal(loc=0, scale=10, size=(20, 20))
np.allclose(np.fft.ifft2(np.fft.fft2(arr2)), arr2)
# >>> True
IFFT2(FFT2(x)) ≈ x,二维反性质成立!
2.9 np.fft.fftn
我们可以将FFT扩展到三维,四维,五维输入!事实上,对于 n 维输入,有一个 n 维 FFT...
2.10 np.fft.ifftn
...相应地,n维逆变换。
arr3 = np.random.normal(loc=0, scale=10, size=(20, 20, 20))
np.allclose(np.fft.ifftn(np.fft.fftn(arr3)), arr3)
IFFTN(FFTN(x)) ≈ x,n-D 反性质成立!
感谢您加入,因为我们已经完成了这个系列!接下来我想写一些关于傅里叶变换实现的内容;如果您有兴趣或希望我解释其他概念,请在下面发表评论。
您可能还对我关于傅里叶直觉的其他一些文章感兴趣!
三、教授(并学习)几何傅里叶变换
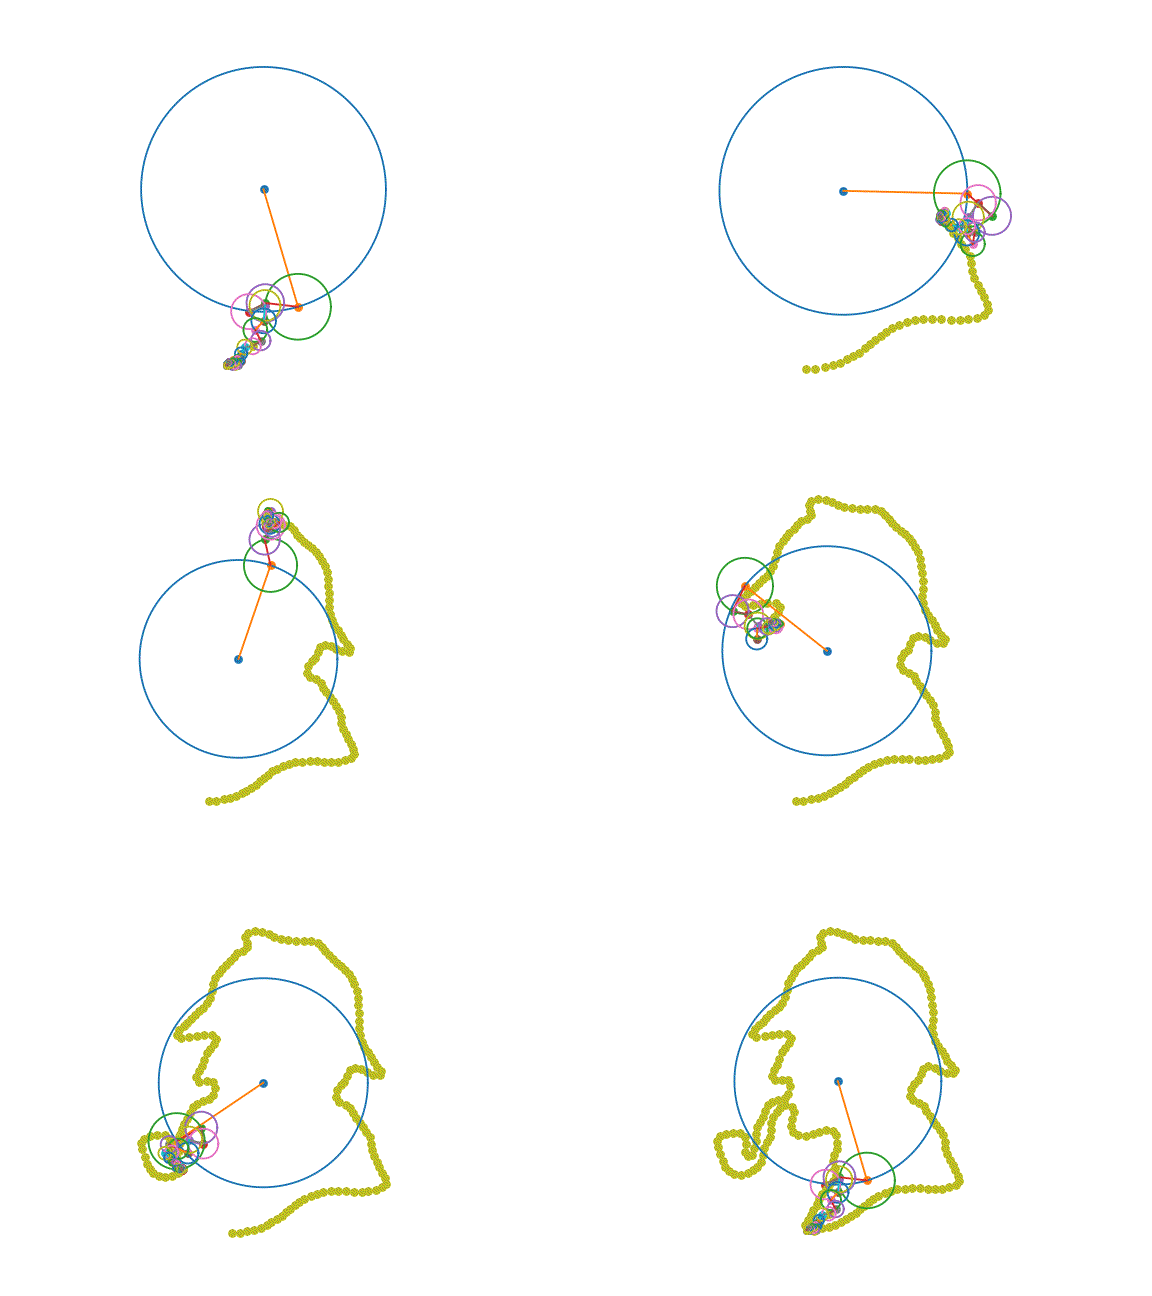
图片由作者提供。用傅里叶变换勾勒出我们最喜欢的侦探!
3.1 介绍
在其他文章中,我写过关于傅里叶变换在确定真实或复杂信号的频率分量方面的应用。
为了进一步建立我们的直觉,让我们学习用傅里叶变换绘画!
3.2 定义振荡器
我们已经在其他上下文中讨论了频率、相位和幅度,但值得快速复习一下!
- https://towardsdatascience.com/the-fourier-transform-1-ca31adbfb9ef
- https://towardsdatascience.com/the-fourier-transform-2-understanding-phase-angle-a85ad40a194e
频率是旋转速率,即给定振荡器的旋转速度。相位表示旋转的起始位置,即圆上开始旋转的点。幅度是信号中存在的给定频率的量,即振荡器的大小。
在上面的可视化中,每个旋转的圆圈都是一个振荡器。每个振荡器以固定的速度旋转:其频率。每个振荡器都从其旋转的给定点开始:其相位。每个振荡器都有一个特定的半径:其幅度。
我们可以从傅里叶变换中获取所有这些信息。傅里叶变换的绝对值(np.abs)给了我们量级。傅里叶变换的相位(np.angle)给了我们相位。这为我们提供了设置一些振荡器来绘制轮廓所需的所有信息!
- https://towardsdatascience.com/the-fourier-transform-3-magnitude-and-phase-encoding-in-complex-data-8184e2ef75f0
四、 使用傅里叶变换绘制草图
4.1 将轮廓转换为复杂信号
首先,我们需要从图像中获取轮廓。我决定使用Canny边缘检测从图像中提取边缘(在上面的示例中,是夏洛克·福尔摩斯的绘图)。
# see full context at https://github.com/peterbbryan/fourier-sketcher

@staticmethod
def _from_jpeg(path_str: str) -> Image:
    """ Load image at path. """

    return Image.open(path_str)

@property
def binary_mask(self):
    """ Binary mask from image. """

    im = np.array(self._image)  # pylint: disable=invalid-name
    edges = cv.Canny(im, 100, 150)  # pylint:disable=no-member

    return np.array(edges).astype(np.bool)
这将为我们提供一个指示图像边缘的 2D 二进制数组。现在,我们需要将这些点表示为围绕原点的复杂坐标。x 轴表示实部,y 轴表示虚部。
- https://towardsdatascience.com/mind-your-is-and-q-s-the-basics-of-i-q-data-d1f2b0dd81f4
# see full context at https://github.com/peterbbryan/fourier-sketcher

@property
def complex_sequence(self) -> np.ndarray:
    """ Binary pixel coordinates as complex sequence. """

    # row/col to x/y will impart a directional flip on coordinates
    locs = np.argwhere(np.flipud(self.binary_mask)).astype(np.complex128)
    n_rows, n_cols = self.binary_mask.shape

    # center about the origin
    rows = locs[:, 0] - (n_rows // 2)
    columns = locs[:, 1] - (n_cols // 2)

    # represent y values with i
    rows *= 1j

    # restructure to x, y order
    return rows + columns
4.2. 重新排序以最小化连续点之间的距离
现在,我们需要对点进行排序,以使进度尽可能顺利。在实践中,我发现排序以最小化从一个点到下一个点的差异是一个很好的方法!
# see full context at https://github.com/peterbbryan/fourier-sketcher

@staticmethod
def _sort_points(
    complex_sequence: np.ndarray, stopping_threshold: float = 10
) -> np.ndarray:
    """
    Arrange points so that neighbors are near each other in sequence.
    Args:
        complex_sequence: Points as complex array.
    Returns:
        Sorted points to minimize sequential differences.
    """

    reordered: List[np.complex128] = []
    current_point = complex_sequence[0]
    complex_sequence[0] = np.inf

    while len(reordered) < complex_sequence.shape[0]:

        if np.min(np.abs(complex_sequence - current_point)) > stopping_threshold:
            break

        min_dist_ind = np.argmin(np.abs(complex_sequence - current_point))
        reordered.append(current_point)
        current_point = complex_sequence[min_dist_ind]
        complex_sequence[min_dist_ind] = np.inf

    return np.array(reordered)
4.3. 调用傅里叶变换
现在,我们将应用傅里叶变换来提取与每个频率相关的幅度和相位信息。由于可视化所有振荡器的速度很慢,我们将过滤掉self._n_oscillators上面的所有频率分量。
# see full context at https://github.com/peterbbryan/fourier-sketcher

def _get_frequency_components(self) -> Tuple[np.ndarray, np.ndarray]:
    """
    Get frequency components from outline.
    Returns:
        Tuple of frequency values and bin centers.
    """

    complex_sequence = self._sort_points(self._edger.complex_sequence)

    fft_values = np.fft.fft(complex_sequence)
    fft_bins = np.fft.fftfreq(len(fft_values), d=1 / (len(fft_values)))

    # make this less stupid
    fft_values = fft_values[np.abs(fft_bins) <= (self._n_oscillators / 2)]
    fft_bins = fft_bins[np.abs(fft_bins) <= (self._n_oscillators / 2)]

    fft_bins = fft_bins[np.argsort(-np.abs(fft_values))]
    fft_values = fft_values[np.argsort(-np.abs(fft_values))]

    return fft_values, fft_bins
4.5 素描
我们剩下要做的就是将碎片和情节结合起来......
# see full context at https://github.com/peterbbryan/fourier-sketcher

def _get_arr_from_fig(self, dpi: int = 90) -> np.ndarray:
    """
    Get np.ndarray from a figure.
    Args:
        fig: Matplotlib Figure.
        dpi: Resolution.
    Returns:
        Numpy array of image contents.
    """

    buf = io.BytesIO()
    self._fig.savefig(buf, format="png", dpi=dpi)
    buf.seek(0)
    img_arr = np.frombuffer(buf.getvalue(), dtype=np.uint8)
    buf.close()
    img = cv2.imdecode(img_arr, 1)  # pylint: disable=no-member
    img = cv2.cvtColor(img, cv2.COLOR_BGR2RGB)  # pylint: disable=no-member

    return img

@staticmethod
def _make_plot(points: List[Tuple[float, float]]) -> None:
    """
    Plot outline so far.
    Args:
        points: x, y points to plot.
    """

    plt.scatter(*list(zip(*points)), linewidth=1)

    plt.draw()
    plt.axis("square")
    plt.axis("off")

def make_gif(self, path_str: str) -> None:
    """
    Make gif of outline.
    Args:
        path_str: Path to write gif to.
    """

    plt.ion()

    fft_values, fft_bins = self._get_frequency_components()
    plots, points = [], []

    for step in tqdm.tqdm(np.linspace(0, 2 * np.pi, self._n_steps)):

        edge = (0.0, 0.0)

        for i in range(self._n_oscillators):

            mag = np.abs(fft_values[i])
            ang = np.angle(fft_values[i])

            oscillator = self._get_oscillator(frequency=fft_bins[i], phase=ang)
            circle = self._get_circle(
                center=edge, radius=mag, angle=oscillator.angle(step)
            )
            circle.draw()
            edge = circle.edge_point

            if i == self._n_oscillators - 1:
                points.append(edge)

        self._make_plot(points)

        plot_img_np = self._get_arr_from_fig()
        plots.append(Image.fromarray(plot_img_np))

        plt.clf()

    self._write_gif(plots, path_str)
...创建 GIF!
# see full context at https://github.com/peterbbryan/fourier-sketcher

@staticmethod
def _write_gif(
    plots: List[Image.Image],
    path_str: str,
    last_frame_repeats: int = 100,
    duration: int = 60,
) -> None:
    """
    Write animated gif.
    Args:
        plots: Output plots to write.
        path_str: Path to output gif.
        last_frame_repeats: Number of repeats of last still.
        duration: Duration in seconds.
    """

    for _ in range(last_frame_repeats):
        plots.append(plots[-1])

    plots[0].save(
        path_str, save_all=True, append_images=plots[1:], duration=duration, loop=0,
    )
五、结论
傅里叶变换是数据科学中的关键构建块,但学习起来并不容易!仅使用 FFT 将 2D 动画拼凑在一起是建立理解的好方法。
下一步是什么?接下来,我想介绍一下使傅里叶变换成为可能的数学。如果您想解释其他主题,请在评论中回复!例如......彼得·巴雷特·布莱恩


