Mapbox gl HTML经纬度点渲染,动态轨迹播放,自定义图形以及轨迹上显示箭头方向
- 1. 效果图
- 2. 源码
- 2.1 line.html
- 2.2line_arrow.html
- 参考
今天要排查个问题,需要显示多个经纬度点连接成线段的方向,于是尝试下展示。
1. mapbox渲染经纬度点,线,多线,面
2. 运动轨迹增加箭头方向
3. 增加一个图像(如小车等)本文用的tomcat小猫图标,实行运动轨迹可控制,开始,播放,停止
1. 效果图
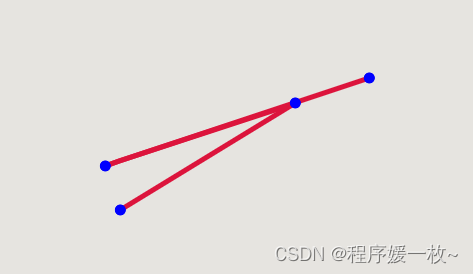
线渲染:

点、线渲染:
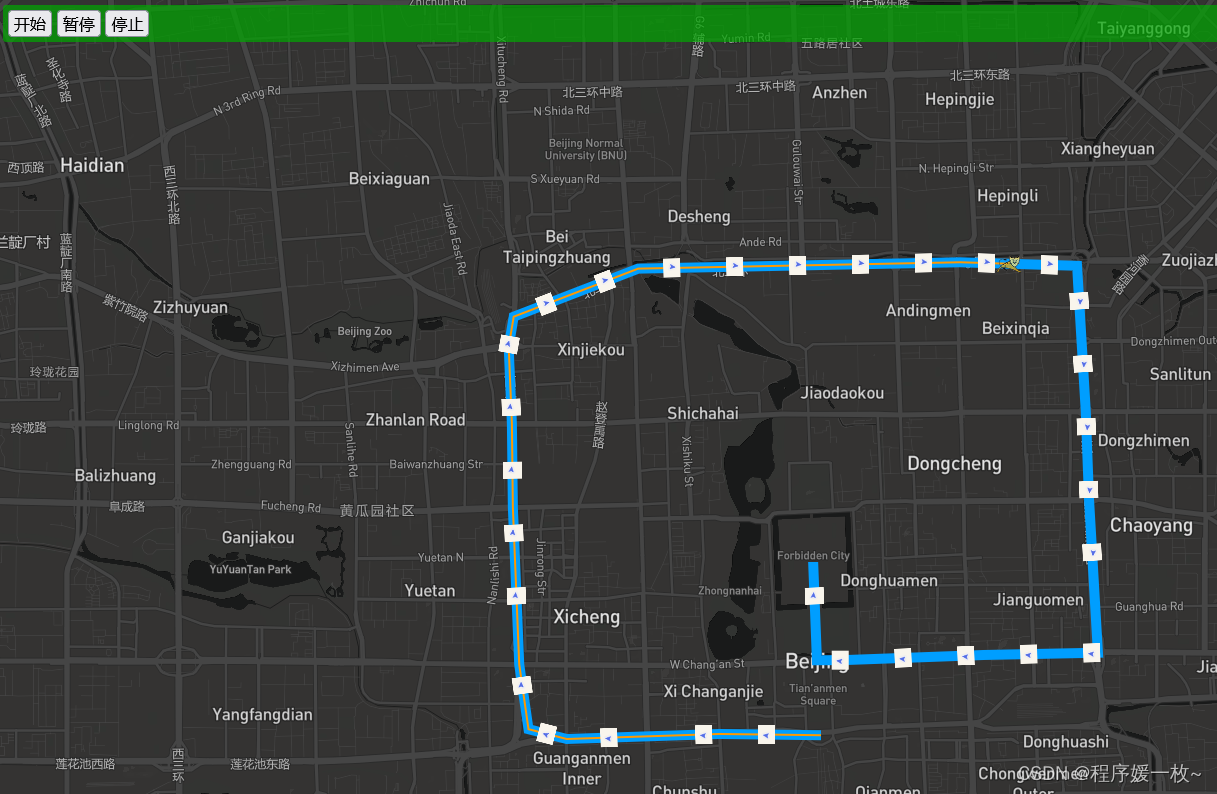
增加箭头显示方向,以及tomcat小猫播放:
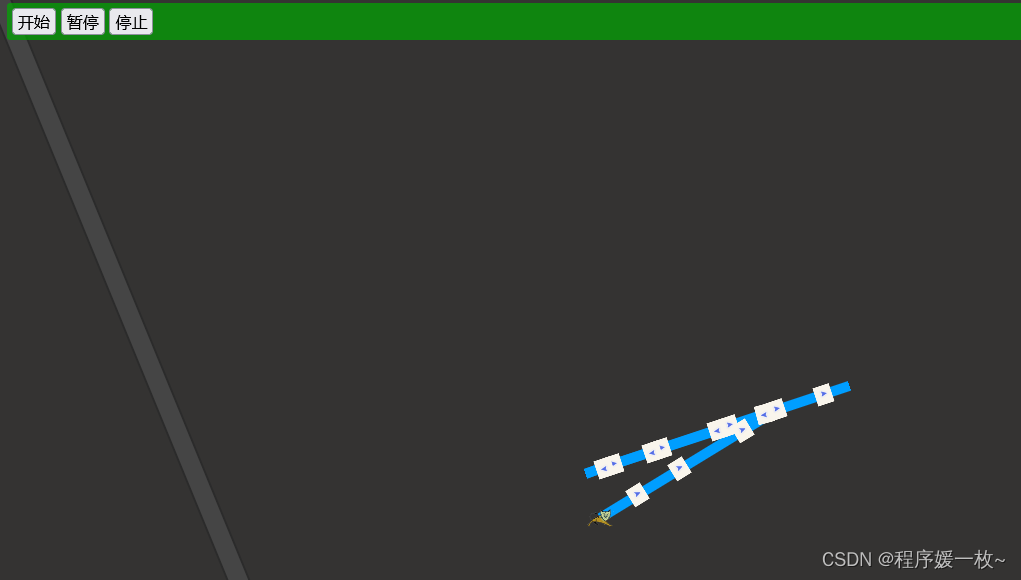
轨迹播放中截图:
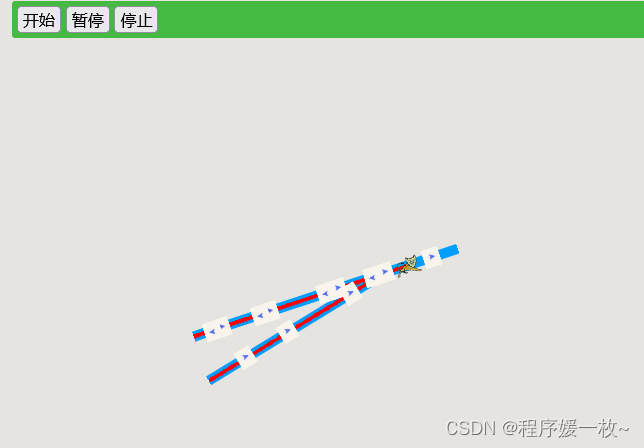
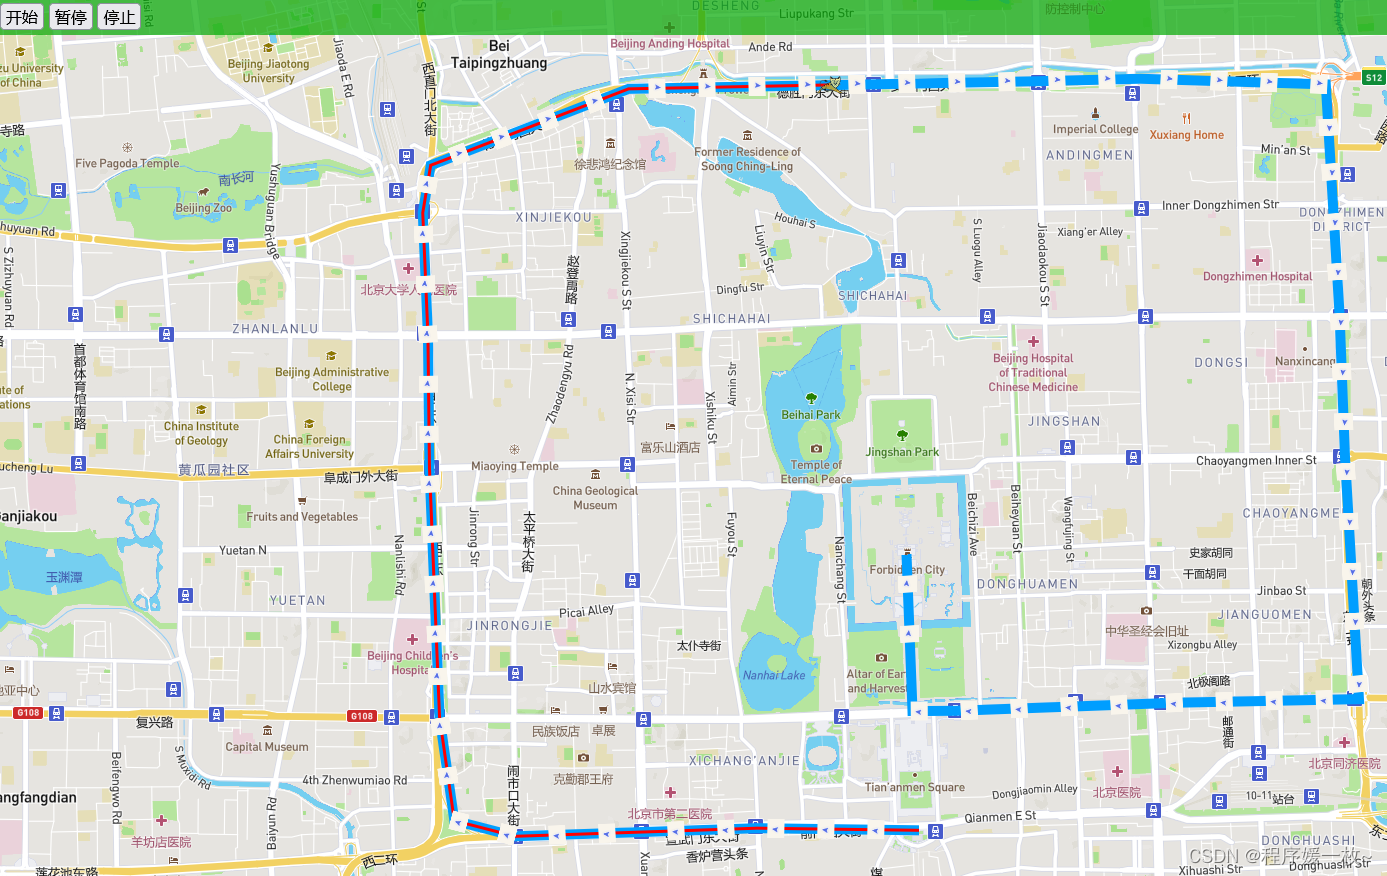
增加轨迹方向箭头及小猫播放中截图如下:
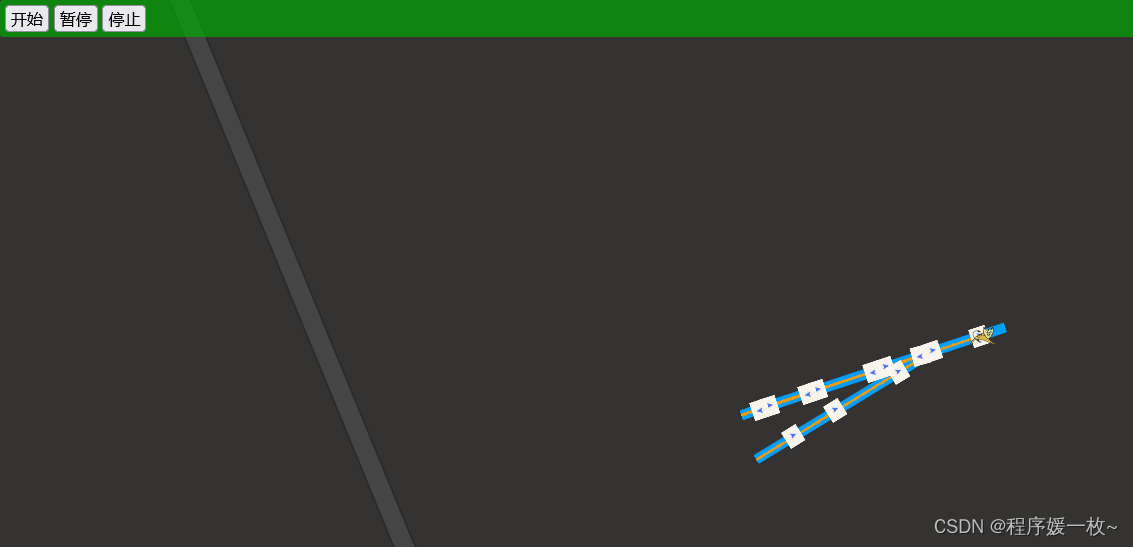
修改地图背景色,实时轨迹线颜色,播放中截图如下:
2. 源码
2.1 line.html
<!DOCTYPE html>
<html>
<head>
    <meta charset="utf-8">
    <title>Add a GeoJSON line</title>
    <meta name="viewport" content="initial-scale=1,maximum-scale=1,user-scalable=no">
    <link href="https://api.mapbox.com/mapbox-gl-js/v2.1.1/mapbox-gl.css" rel="stylesheet">
    <script src="https://api.mapbox.com/mapbox-gl-js/v2.1.1/mapbox-gl.js"></script>
    <style>
        body {
            margin: 0;
            padding: 0;
        }

        #map {
            position: absolute;
            top: 0;
            bottom: 0;
            width: 100%;
        }
    </style>
</head>
<body>
<div id="map"></div>
<script>
    // TO MAKE THE MAP APPEAR YOU MUST
    // ADD YOUR ACCESS TOKEN FROM
    // https://account.mapbox.com
    mapboxgl.accessToken = 'pk.eyJ1******************Lc99g';
    var map = new mapboxgl.Map({
        container: 'map',
        style: 'mapbox://styles/mapbox/streets-v11',
// center: [-122.486052, 37.830348],
// center: [116.239749,40.0717456],
// center: [117.85448020099696,35.96263648233899],
        center: [116.25456103528076, 40.07649758667226],
        zoom: 14
    });

    map.on('load', function () {
        map.addSource('route', {
            'type': 'geojson',
            'data': {
                'type': 'FeatureCollection',
                'features': [
                    {
                        'type': 'Feature',
                        'properties': {},
                        'geometry': {
                            'type': 'LineString',
                            'coordinates': [[116.25456103528076, 40.07649758667226, 32.60466429684311],
                                [116.25459033603693, 40.076511383622965, 32.46827581245452],
                                [116.25455860845449, 40.07650334314173, 32.52390295546502],
                                [116.25460283054188, 40.07651455000795, 32.44636987615377]]
                        }
                    },
                    {
                        'type': 'Feature',
                        'geometry': {
                            'type': 'Point',
                            'coordinates': [116.25456103528076, 40.07649758667226, 32.60466429684311]
                        }
                    },
                    {
                        'type': 'Feature',
                        'geometry': {
                            'type': 'Point',
                            'coordinates': [116.25459033603693, 40.076511383622965, 32.46827581245452]
                        }
                    },
                    {
                        'type': 'Feature',
                        'geometry': {
                            'type': 'Point',
                            'coordinates': [116.25455860845449, 40.07650334314173, 32.52390295546502]
                        }
                    },
                    {
                        'type': 'Feature',
                        'geometry': {
                            'type': 'Point',
                            'coordinates': [116.25460283054188, 40.07651455000795, 32.44636987615377]
                        }
                    }
                ]
            }
        });
        map.addLayer({
            'id': 'route',
            'type': 'line',
            'source': 'route',
            'layout': {
                'line-join': 'round',
                'line-cap': 'round'
            },
            'paint': {
                'line-color': '#DC143C',
                'line-width': 5
            }
        });

        map.addLayer({
            'id': 'routePoint',
            'type': 'circle',
            'source': 'route',
            'paint': {
                'circle-radius': 6,
                'circle-color': '#0000FF'
            },
            'filter': ['==', '$type', 'Point']
        });
    });
</script>

</body>
</html>
2.2line_arrow.html
<!DOCTYPE html>
<html>
<head>
    <meta charset="utf-8">
    <title>Add a GeoJSON line,with Arrow</title>
    <meta name="viewport" content="initial-scale=1,maximum-scale=1,user-scalable=no">
    <link href="https://api.mapbox.com/mapbox-gl-js/v2.1.1/mapbox-gl.css" rel="stylesheet">
    <script src="https://api.mapbox.com/mapbox-gl-js/v2.1.1/mapbox-gl.js"></script>
    <script src="https://unpkg.com/@turf/turf@6.3.0/turf.min.js"></script>
    <style>
        body {
            margin: 0;
            padding: 0;
        }

        .menuBar {
            position: relative;
            top: 10px;
            margin: 0 50px;
            padding: 5px;
            border-radius: 3px;
            z-index: 999;
            background-color: rgba(0, 168, 0, 0.7);
        }

        input[type=button] {
            font-size: 16px;
        }

        #map {
            position: absolute;
            top: 0;
            bottom: 0;
            width: 100%;
        }

        /* 删除mapbox logo */
        .mapboxgl-ctrl {
            display: none !important;
        }
    </style>
</head>

<body>
<div id="map"></div>
<div class="menuBar">
    <input type="button" value="开始" onclick="startClick()"/>
    <input type="button" value="暂停" onclick="pauseClick()"/>
    <input type="button" value="停止" onclick="stopClick()"/>
    <div id="canvas"></div>
</div>
<script>
    // TO MAKE THE MAP APPEAR YOU MUST ADD YOUR ACCESS TOKEN FROM
    // https://account.mapbox.com
    mapboxgl.accessToken = 'pk.eyJ********';
    var map = new mapboxgl.Map({
        container: 'map',
        style: 'mapbox://styles/mapbox/streets-v11',
        // center: [116.25456103528076, 40.07649758667226],
        // zoom: 24
        center: [116.390619, 39.924317], // starting position [lng, lat]
        zoom: 13 // starting zoom
    });
    // 背景色
    // map.setStyle('mapbox://styles/mapbox/dark-v9');

    // 箭头-右
    var svgXML =
        `<svg viewBox="0 0 1024 1024" xmlns="http://www.w3.org/2000/svg">
                <path d="M529.6128 512L239.9232 222.4128 384.7168 77.5168 819.2 512 384.7168 946.4832 239.9232 801.5872z" p-id="9085" fill="#ff00ff"></path>
            </svg>
            `
    //给图片对象写入base64编码的svg流
    var svgBase64 = 'data:image/svg+xml;base64,' + window.btoa(unescape(encodeURIComponent(svgXML)));

    map.on('load', function () {
        let arrowIcon = new Image(20, 20)
        arrowIcon.src = svgBase64
        arrowIcon.onload = function () {
            map.addImage('arrowIcon', arrowIcon)
            console.log("----------1 " + arrowIcon)
            map.loadImage('img/arrowR.png', function (error, arrowIcon2) {
                if (arrowIcon2) {
                    map.addImage('arrowIcon2', arrowIcon2);
                }
            })
            map.loadImage('img/car.png', function (error, carIcon) {
                if (carIcon) {
                    console.log("----------2 " + arrowIcon)
                    map.addImage('carIcon', carIcon);
                    setRouteData()
                }
                console.log("----------3 " + arrowIcon)
            });
        }
    })

    var isPlay = false
    var counter = 0
    var steps = 0
    let aLength = 0;
    var routeGeoJson = {
        'type': 'FeatureCollection',
        'features': [{
            'type': 'Feature',
            'geometry': {
                'type': 'LineString',
                'coordinates': [
                    [116.391844, 39.898457],
                    [116.377947, 39.898595],
                    [116.368001, 39.898341],
                    [116.357144, 39.898063],
                    [116.351934, 39.899095],
                    [116.35067, 39.905871],
                    [116.3498, 39.922329],
                    [116.349671, 39.931017],
                    [116.349225, 39.939104],
                    [116.34991, 39.942233],
                    [116.366892, 39.947263],
                    [116.387537, 39.947568],
                    [116.401988, 39.947764],
                    [116.410824, 39.947929],
                    [116.42674, 39.947558],
                    [116.427338, 39.9397],
                    [116.427919, 39.932404],
                    [116.428377, 39.923109],
                    [116.429583, 39.907094],
                    [116.41404, 39.906858],
                    [116.405321, 39.906622],
                    [116.394954, 39.906324],
                    [116.391264, 39.906308],
                    [116.390748, 39.916611]
                ]
                /*[
                    [116.25456103528076, 40.07649758667226, 32.60466429684311],
                    [116.25459033603693, 40.076511383622965, 32.46827581245452],
                    [116.25455860845449, 40.07650334314173, 32.52390295546502],
                    [116.25460283054188, 40.07651455000795, 32.44636987615377]
                ]*/
            }
        }]
    }

    var realRouteGeoJson = {
        'type': 'FeatureCollection',
        'features': [{
            'type': 'Feature',
            'geometry': {
                'type': 'LineString',
                'coordinates': []
            }
        }]
    }

    var animatePointGeoJson = {
        'type': 'FeatureCollection',
        'features': [{
            'type': 'Feature',
            'properties': {},
            'geometry': {
                'type': 'Point',
                'coordinates': []
            }
        }]
    }

    // 获取轨迹数据
    function setRouteData() {
        animatePointGeoJson.features[0].geometry.coordinates = routeGeoJson.features[0].geometry.coordinates[0]
        aLength = routeGeoJson.features[0].geometry.coordinates.length;
        newRouteGeoJson = resetRoute(routeGeoJson.features[0], 1000, 'kilometers')
        steps = newRouteGeoJson.geometry.coordinates.length

        addRoutelayer() // 添加轨迹线图层
        addRealRouteSource() // 添加实时轨迹线图层
        addArrowlayer() // 添加箭头图层
        addAnimatePointSource() // 添加动态点图层
    }

    // 添加轨迹线图层
    function addRoutelayer() {
        map.addLayer({
            'id': 'routeLayer',
            'type': 'line',
            'source': {
                'type': 'geojson',
                'lineMetrics': true,
                'data': routeGeoJson
            },
            'paint': {
                'line-width': 10,
                'line-opacity': 1,
                'line-color': '#009EFF',
            }
        });
    }

    // 添加实时轨迹线
    function addRealRouteSource() {
        map.addLayer({
            'id': 'realRouteLayer',
            'type': 'line',
            'source': {
                'type': 'geojson',
                'lineMetrics': true,
                'data': realRouteGeoJson
            },
            'paint': {
                'line-width': 3,
                'line-opacity': 1,
                'line-color': '#FF0000',
            }
        });
    }

    // 添加箭头图层
    function addArrowlayer() {
        console.log("-------addArrowlayer")
        map.addLayer({
            'id': 'arrowLayer',
            'type': 'symbol',
            'source': {
                'type': 'geojson',
                'data': routeGeoJson //轨迹geojson格式数据
            },
            'layout': {
                'symbol-placement': 'line',
                'symbol-spacing': 50, // 图标间隔,默认为250
                'icon-image': 'arrowIcon2', //箭头图标
                'icon-size': 0.5,
                'icon-rotate': ['get', 'bearing'],
                'icon-rotation-alignment': 'map',
                'icon-allow-overlap': true,
                'icon-ignore-placement': true
            }
        });
        console.log("-------addArrowlayer end...")
    }

    // 添加动态点图层
    function addAnimatePointSource() {
        map.addLayer({
            'id': 'animatePointLayer',
            'type': 'symbol',
            'source': {
                'type': 'geojson',
                'data': animatePointGeoJson
            },
            'layout': {
                'icon-image': 'carIcon',
                'icon-size': 0.5,
                'icon-rotate': ['get', 'bearing'],
                'icon-rotation-alignment': 'map',
                'icon-allow-overlap': true,
                'icon-ignore-placement': true
            }
        });

        animate()
    }

    function animate() {
        if (counter >= steps) {
            return
        }
        var startPnt, endPnt
        if (counter == 0) {
            realRouteGeoJson.features[0].geometry.coordinates = []
            startPnt = newRouteGeoJson.geometry.coordinates[counter]
            endPnt = newRouteGeoJson.geometry.coordinates[counter + 1]
        } else if (counter !== 0) {
            startPnt = newRouteGeoJson.geometry.coordinates[counter - 1]
            endPnt = newRouteGeoJson.geometry.coordinates[counter]
        }

        animatePointGeoJson.features[0].properties.bearing = turf.bearing(
            turf.point(startPnt),
            turf.point(endPnt)
        ) - 90;
        animatePointGeoJson.features[0].geometry.coordinates = newRouteGeoJson.geometry.coordinates[counter];
        realRouteGeoJson.features[0].geometry.coordinates.push(animatePointGeoJson.features[0].geometry.coordinates)

        map.getSource('animatePointLayer').setData(animatePointGeoJson);
        map.getSource('realRouteLayer').setData(realRouteGeoJson);
        if (isPlay) {
            requestAnimationFrame(animate);
        }
        counter = counter + 1;
    }

    function resetRoute(route, nstep, units) {
        var newroute = {
            'type': 'Feature',
            'geometry': {
                'type': 'LineString',
                'coordinates': []
            }
        }
        var lineDistance = turf.lineDistance(route);
        var nDistance = lineDistance / nstep;
        for (let i = 0; i < aLength - 1; i++) {
            var from = turf.point(route.geometry.coordinates[i]);
            var to = turf.point(route.geometry.coordinates[i + 1]);
            let lDistance = turf.distance(from, to, {
                units: units
            });
            if (i == 0) {
                newroute.geometry.coordinates.push(route.geometry.coordinates[0])
            }
            if (lDistance > nDistance) {
                let rings = lineMore(from, to, lDistance, nDistance, units)
                newroute.geometry.coordinates = newroute.geometry.coordinates.concat(rings)
            } else {
                newroute.geometry.coordinates.push(route.geometry.coordinates[i + 1])
            }
        }
        return newroute
    }

    function lineMore(from, to, distance, splitLength, units) {
        var step = parseInt(distance / splitLength)
        var leftLength = distance - step * splitLength
        var rings = []
        var route = turf.lineString([from.geometry.coordinates, to.geometry.coordinates])
        for (let i = 1; i <= step; i++) {
            let nlength = i * splitLength
            let pnt = turf.along(route, nlength, {
                units: units
            });
            rings.push(pnt.geometry.coordinates)
        }
        if (leftLength > 0) {
            rings.push(to.geometry.coordinates)
        }
        return rings
    }

    function startClick() {
        if (!isPlay) {
            isPlay = true
            animate()
        }
    }

    function pauseClick() {
        isPlay = false
        animate()
    }

    function stopClick() {
        isPlay = false
        counter = 0
        animate()
    }
</script>

</body>

</html>
参考
- https://www.mianshigee.com/note/detail/11900gfx/
- https://github.com/gisarmory/gisarmory.blog/blob/master/mapboxgl-PolylineDecorator/demo.html