绘图
官方API
头文件、画布初始化
首先要导入头文件,初始化画布
from matplotlib import pyplot as plt
from matplotlib.pyplot import MultipleLocator  # 从pyplot导入MultipleLocator类,这个类用于设置刻度间隔
import numpy as np # 常用的数据处理类
fig, ax = plt.subplots(1, sharex=True,figsize=(11, 6))
# figsize指定画布的宽度和高度
fig.set_figheight(8) # 指定初始绘图时,图片的高度
背景网格、背景斜线
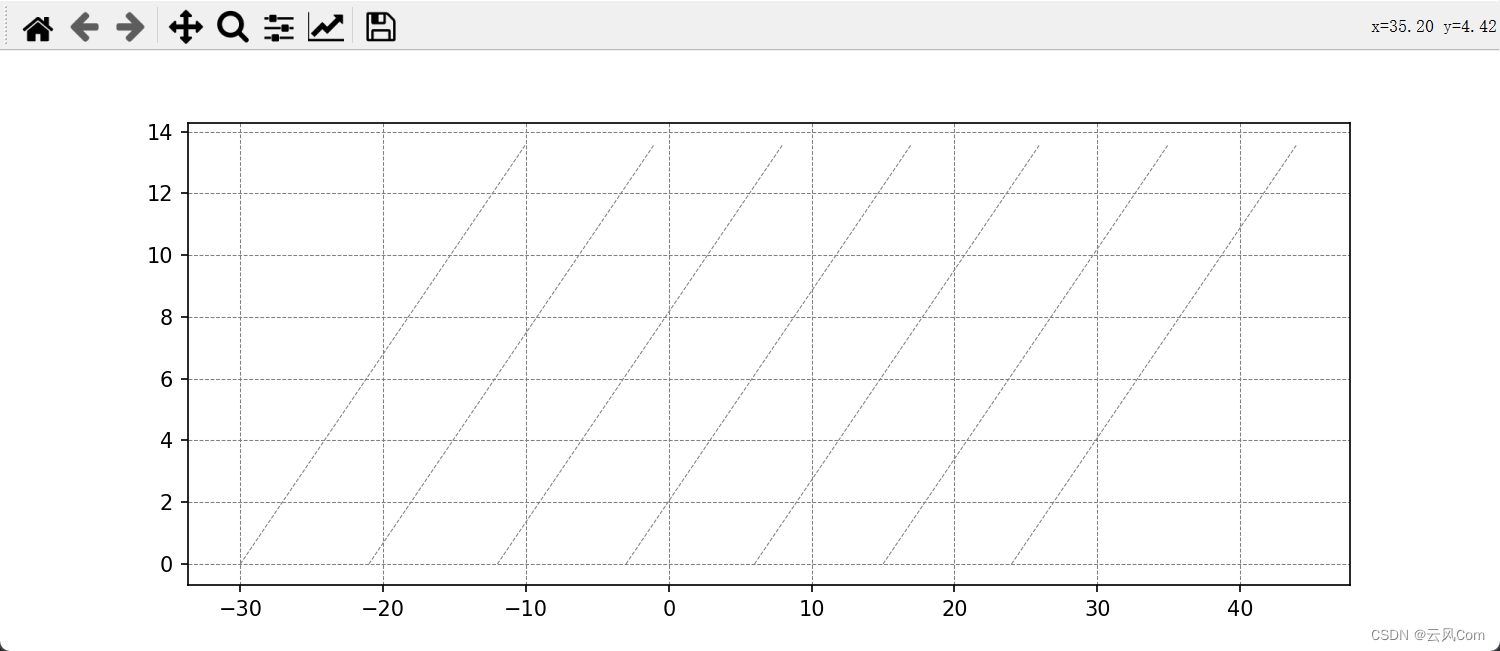
# 绘制背景网格
ax.grid(True, linestyle='--', linewidth=0.5, color='gray')
# 设置斜线的参数
line_params = {'color': 'gray', 'linewidth': 1, 'linestyle': '--', 'linewidth': 0.5}
# 绘制斜线
for i in range(-30, 30, 9):
    ax.plot([i, i + 20], [0, 13.6], **line_params)
绘图
散点图
ax.scatter(np.arange(0,100), np.arange(0, 100), s=12,color=light_blue,label='Data 1')
# s: 指定了散点的大小
# clolor: 指定了散点的颜色
# label: 指定图例
频率分布直方图
# data指明了数据,bins指明了要将数据分成多少块
ax.hist(data, bins=30, density=True, alpha=0.5,marker='o',label="freq image label")
# marker指明了散点的点的类型,具体可以百度
折线图
ax.plot(x_data, y_data, color='b',linewidth=4)
设置坐标范围、坐标刻度(坐标步长)
y_major_locator = MultipleLocator(2)  # 把y轴的刻度间隔设置为2,并存在变量里
ax.yaxis.set_major_locator(y_major_locator) # 设置y轴刻度

x_major_locator = MultipleLocator(6)  # 把x轴的刻度间隔设置为6,并存在变量里
ax.xaxis.set_major_locator(x_major_locator) # 设置x轴刻度

ax.set_ylim(0, 10) # 设置y轴范围0~10
ax.set_xlim(-1.0, 31) # 设置x轴范围-1.0~31
字体大小、颜色调整(图例、坐标轴、横纵注释)
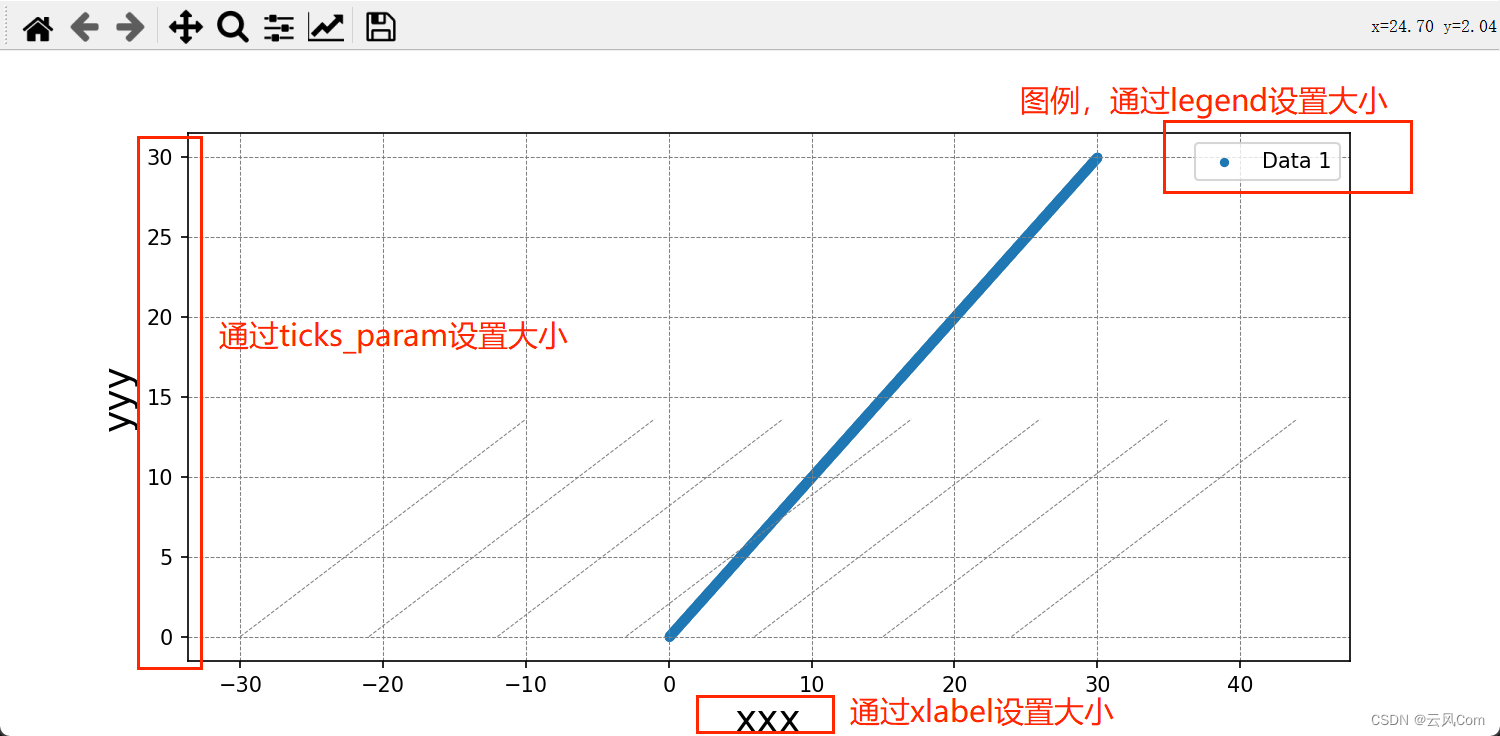
plt.legend(fontsize=24) # 1. 图例字体调整
plt.xlabel('x 轴',fontsize=30) # 2.1 x轴标注字体调整
plt.ylabel('Frequency',fontsize=30) # 2.2 y轴标注字体大小调整
plt.tick_params(axis='y', labelsize=24,labelcolor='c') # 3.1 坐标轴刻度字体大小调整
plt.tick_params(axis='x', labelsize=24,labelcolor='c') # 3.2 坐标轴刻度字体大小调整
# 图例还可以进行位置调整,下面参数自行调试即可
ax2.legend(loc='lower right', bbox_to_anchor=(1.0, 0.2),fontsize=13)
在Matplotlib中,Python绘图legend的loc参数有十个可选项,分别为:
- ‘best’ 或者 0: 自动选择最佳位置
- ‘upper right’ 或者 1: 图例放置在图的右上角
- ‘upper left’ 或者 2: 图例放置在图的左上角
- ‘lower left’ 或者 3: 图例放置在图的左下角
- ‘lower right’ 或者 4: 图例放置在图的右下角
- ‘right’ 或者 5: 图例放置在图的右侧
- ‘center left’ 或者 6: 图例放置在图的左侧中央
- 'center right’或者 7: 图例放置在图的右侧中央
- ‘lower center’ 或者 8: 图例放置在图的下方中央
- ‘upper center’ 或者 9: 图例放置在图的上方中央
在使用时,需要在legend()函数中加入loc参数,例如:plt.legend(loc=‘upper right’)。如果不加loc参数,默认会选择’best’。

