子图函数 subplot
若要 pyplot 一次生成多个图形,一般要用到subplot函数,另外还有一个subplots函数。两个函数比较接近但略有区别,限于篇幅,我们只介绍 subplot函数,它的基本语法如下:
| ax = plt.subplot(nrows=1, ncols=1, index=1, **kwargs) | |
|---|---|
| nrows | 子图的行数 |
| ncols | 子图的列数 |
| index | 子图的位置索引,从坐上到右下查起,起始值为1 |
| **kwargs | 其他参数 |
| ax | 用于调整子图的参数 |
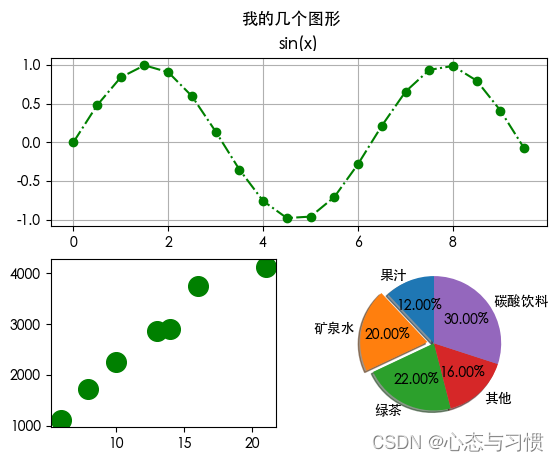
下面举例说明如何生成3个子图,并且其中一个子图横跨2列。
# 导入工具包
import matplotlib.pyplot as plt
import numpy as np
from matplotlib.font_manager import FontManager # 调用 matplotlib 中的字体,用于显示中文

# 这两行代码使得 pyplot 画出的图形中可以显示中文
plt.rcParams['font.sans-serif'] = ['Heiti TC'] # 黑体, 宋体:'Songti SC'
plt.rcParams['axes.unicode_minus'] = False

# 第一个图形
x = np.arange(0, 10, 0.5)
y = np.sin(x)
ax1 = plt.subplot(2,1,1) # 将画布分为2行1列,该子图位于第1个位置
ax1.plot(x, y, 'go-.')
ax1.grid()
ax1.set_title('sin(x)') # 设置子图标题

# 第二个图形
production = [1125, 1725, 2250, 2875, 2900, 3750, 4125]
temp = [6, 8, 10, 13, 14, 16, 21]
ax2 = plt.subplot(2, 2, 3) # 将画布分为2行1列,该子图位于第3个位置
ax2.scatter(temp, production, s=200, c='g')  # 画散点图

# 第三个图形
labels = ['果汁', '矿泉水', '绿茶', '其他', '碳酸饮料']
num = [6, 10, 11, 8, 15]
explode = [0, 0.1, 0, 0, 0]
ax3 = plt.subplot(2, 2, 4) # 将画布分为2行2列,该子图位于第4个位置
ax3.pie(num, explode=explode, labels=labels, autopct='%.2f%%', shadow=True, startangle=90) # 饼图

plt.suptitle('我的几个图形') # 设置整体图形的标题
