# 1.导包
import json
from pyecharts.charts import Bar,Timeline
from pyechasts.options import *
from pyecharts.globals import ThemeType

# 2.打开文件(此次数据格式.csv文件)
f = open("D:/data.csv","r",encoding="GB2312")
data_lines = f.readlines()
f.close()

# 用记事本打开后数据,如下所示:

# 3.删除无用数据
data_lines.pop(0)

# 4.将数据转换为字典,例如:{1960:[[中国,123],...]}
data_dict = {}		#定义空字典,存放数据
for i in data_lines:
	year = int(i.split(",")[0])
	country = i.split(",")[1]
	GDP = float(i.split(",")[2])

	#在字典中,可能存在关键字不存在的报错情况
	try:
		data_dict[year].append([country,GDP])
	except KeyError:
		data_dict[year] = []
		data_dict[year].append([country,GDP])

# 5.定义排序函数,其目的是后续对GDP数值进行排序
def sort_gdp(element):
	return element[1]

# 6.创建时间轴对象
timeline = Timeline(
	{"theme":ThemeType.LIGHT}		#设置主题

)

# 7.排序年份及排序GDP
sort_year_list = sorted([data_dict.keys()])		#对字典中的键(关键字)进行排序,即排序年份。
for year in sort_year_list:
	data_dict[year].sort(key=sort_gdp,reverse=True)
	year_data = data_dict[year][0:8]		#利用切片操作,取到前八名

	#创建X,Y轴
	X_data = []
	Y_data = []
	for country_gdp in year_data:
		X_data.append(country_gdp[0])
		Y_data.append(country_gdp[1]/100000000)

# 8.创建柱状图对象
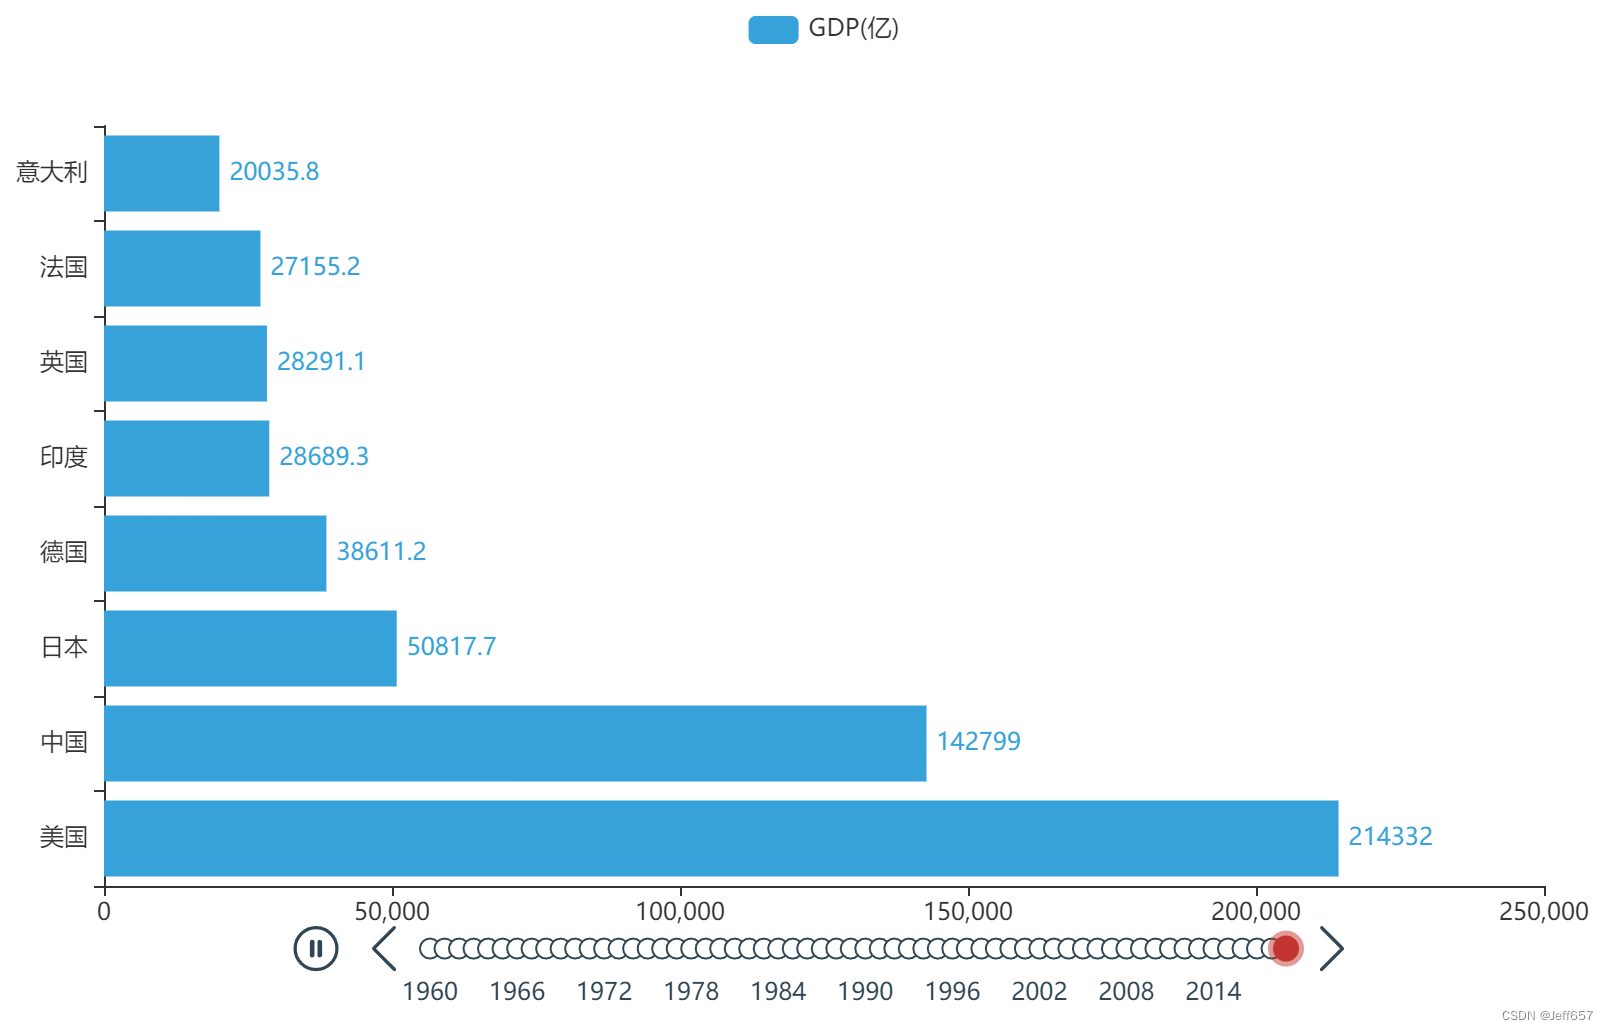
bar = Bar()
bar.add_xaxis(X_data)
bar.add_yaxis("GDP(亿)",Y_data,label_opts=LabelOpts(position=right))
bar.reversal_axis()		#X和Y轴进行反转
timeline.add(bar,str(year))

# 9.设置自动播放等参数
timeline.add_schema(
	play_interval=2000,
	is_timeline_show=True,
	is_auto_play=True,
	is_loop_play=False
)
效果图

