DataFrame.plot函数详解(四)
1. area
DataFrame.plot.area(x=None, y=None, stacked=True, **kwargs)
df = pd.DataFrame({
    'sales': [3, 2, 3, 9, 10, 6],
    'signups': [5, 5, 6, 12, 14, 13],
    'visits': [20, 42, 28, 62, 81, 50],
}, index=pd.date_range(start='2020/01/01', end='2020/07/01',freq='M'))
ax = df.plot.area(figsize=(4,3),title='Area stacked')
ax = df.plot.area(figsize=(4,3),stacked=False,title='Area ')
面积图默认是堆积,stacked=True

2. pie
DataFrame.plot.pie(**kwargs)
df = pd.DataFrame({'mass':abs(np.random.randn(4)),
                   'radius': abs(np.random.randn(4))},
                  index=['A', 'B', 'C','D'])
plot = df.plot.pie(y='mass', figsize=(4, 4))

子图示例:
plot = df.plot.pie(subplots=True, figsize=(8, 4))

3. hist
DataFrame.plot.hist(by=None, bins=10, **kwargs)
bins : 直方图的条块数量,默认10
import matplotlib.pyplot as plt
import pandas as pd
import numpy as np

df = pd.DataFrame({'a': np.random.randn(100) + 0.5,
        'b': np.random.randn(100),
        'c': np.random.randn(100) - 0.5},
        columns =['a', 'b', 'c'])

df.plot.hist(figsize=(6,4),alpha = 0.5,bins=20)
plt.show()

age_list = [8, 10, 12, 14, 72, 74, 76, 78, 20, 25, 30, 35, 60, 85]
df = pd.DataFrame({"gender": list("MMMMMMMMFFFFFF"), "age": age_list})
ax = df.plot.hist(column=["age"], by="gender", figsize=(8, 4))
by=“gender” ,按性别分别排序

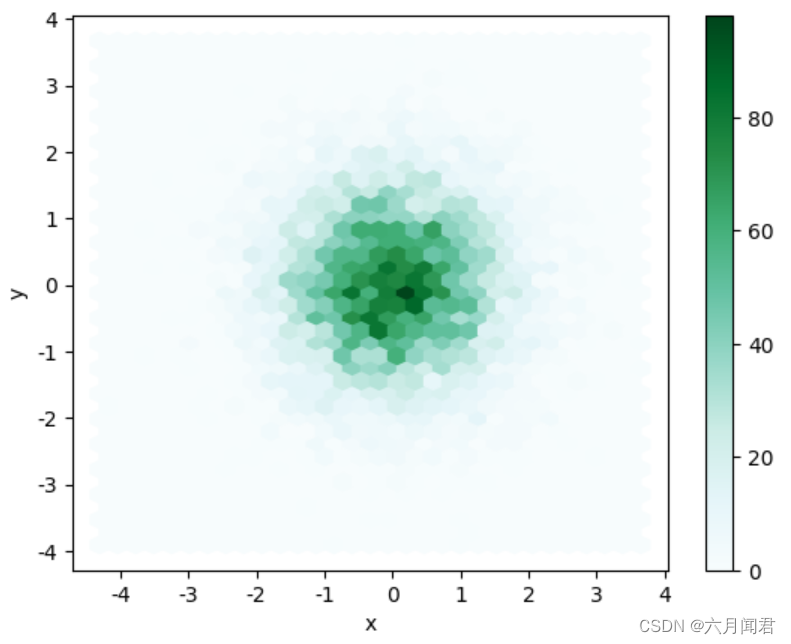
4. hexbin
DataFrame.plot.hexbin(x, y, C=None, reduce_C_function=None, gridsize=None, **kwargs)
n = 10000
df = pd.DataFrame({'x': np.random.randn(n),
                   'y': np.random.randn(n)})
ax = df.plot.hexbin(x='x', y='y', gridsize=20)
plt.show()
gridsize :默认是x方向上六边形的数量,默认值100。
y方向上六边形的相应数量是以六边形近似规则的方式选择的,可以看到第二张图,六边形有变形。gridsize可以是一个元组,其中有两个元素分别指定x方向和y方向上六边形的数量。

ax = df.plot.hexbin(x='x', y='y', gridsize=(30,20))
plt.show()
