背景
页面的性能对于用户的体验起着至关重要的作用,根据Mobify 研究发现,首页加载时间每减少100 毫秒,用户留存率就会增加1.11%。所以做好页面的性能优化,对于网站来说是一个非常重要的步骤。
在解决问题之前需要度量问题,最好用一些可量化的客观的数据指标来衡量当前的问题。这里我们就使用Chrome中的Lighthouse来描述页的性能状况,这里在下面的Lighthouse的部分会介绍
这里又会引申出另一个问题,由于我们的业务场景各不相同,导致我们的页面也是各有各的特点,比如音视频类型的网站里面的流媒体比较多,而淘宝、天猫京东,这些电商网站他的图片就非常多还有可能会做成长页面的效果,而一般的业务系统可能表格和弹框比较多。所以我们应该在上面比较通用的基础之上再结合自己实际的业务特点来制定一套适合自己所在公司的性能模型。
性能检测利器-Lighthouse
上面提到,描述性能的指标和数据的采集主要底层是依赖于Lighthouse的能力。我们可以对一个页面进行性能检测,会自动生成一个关于当前页面的性能报告,如下所示:
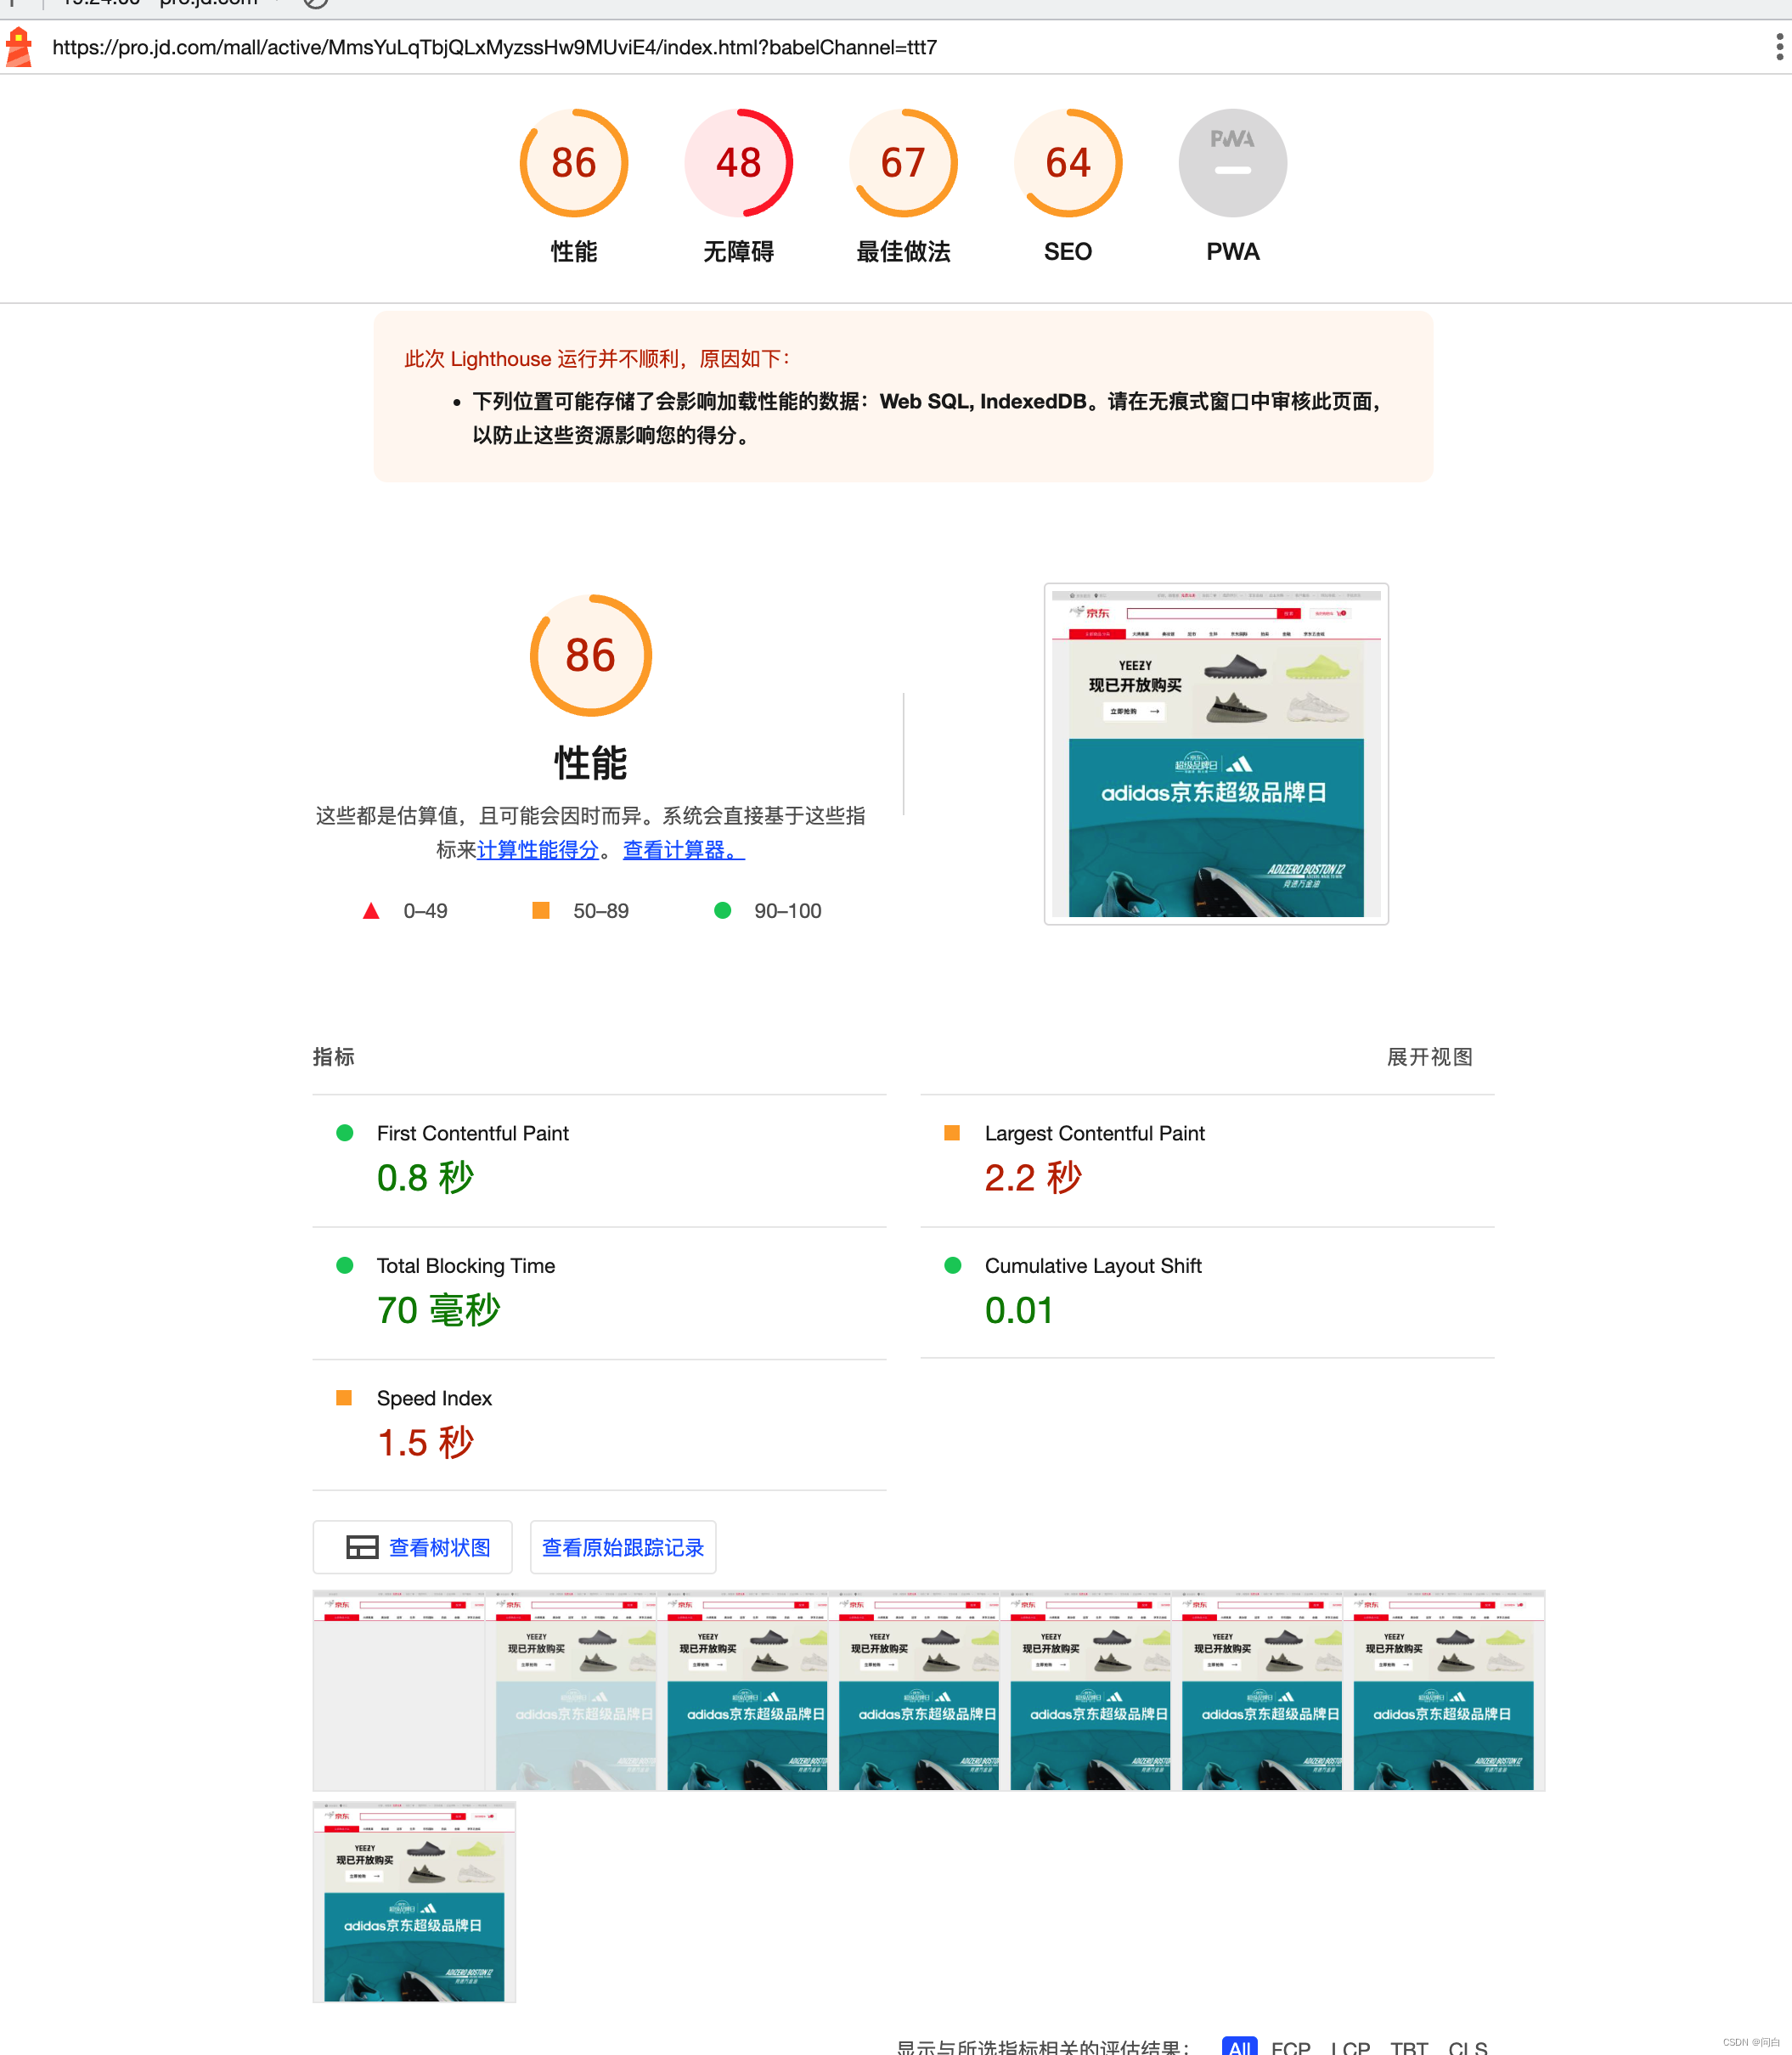
他的性能模型主要采集6个不同的和时间相关的指标。分别为:
- 首次内容绘制时间(FCP)
- 首次可交互时间(TTI)
- 总阻塞时间(TBT)
- 累计布局偏移量(CLS)
- 最大内容绘制时间(LCP)
- 网页速度(SI)
每个指标的含义和计算的方式我都附在最后的参考资料中了,这里就不一一赘述了。
我们看github上官方文档对lighthouse的整体架构设计有这么一张图:
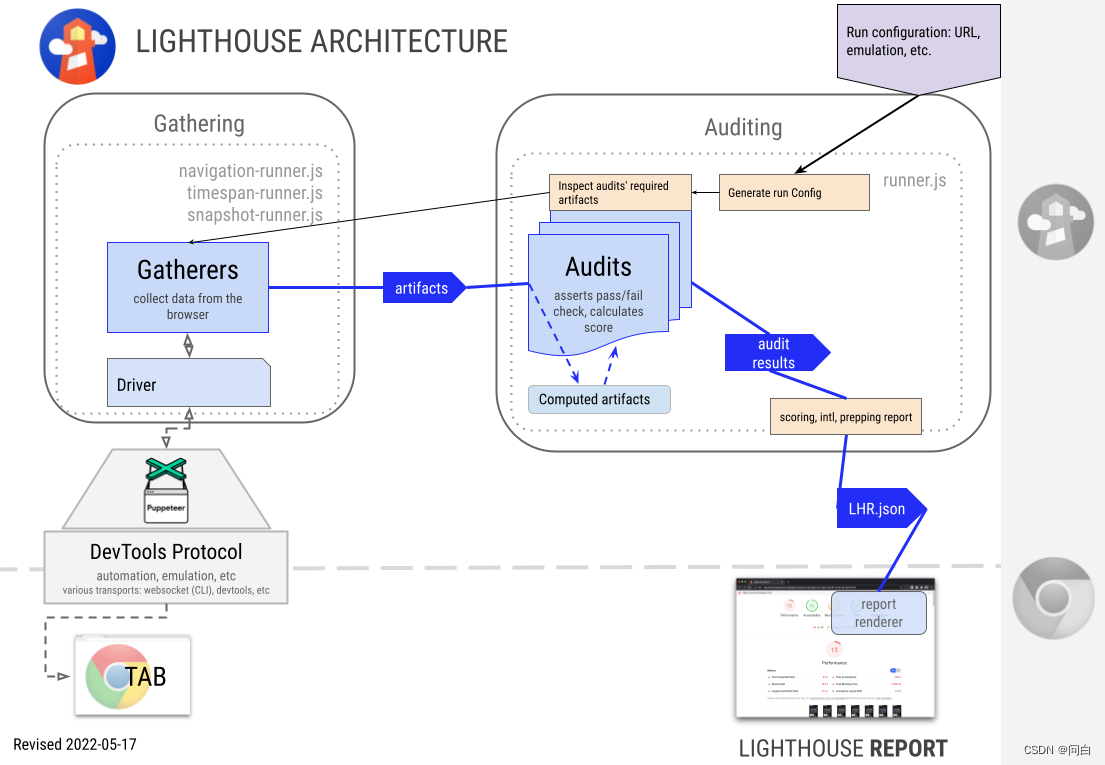
由上图左下侧我们可以看到,lighthouse是通过Driver模块和Puppeteer(一个 Node 库,它提供了一个高级 API 来通过 DevTools 协议控制 Chromium 或 Chrome)来控制浏览器,我们可以通过Puppeteer来模拟用户对浏览器的各种操作,比如点击元素,滚动页面,键盘操作。一个常见的场景就是我们自己的产品使用lighthouse进行检测的时候,往往需要用户先登录,此时我们就可以使用Puppeteer来帮助我们先模拟用户登录,登录之后,利用Cookie的同源策略再次检测我们的页面就可以了。
关于详细的Lighthouse和Puppteer的组合使用我已近在之前写了三篇详细的技术文章结合lighthouse的部分源码进行了介绍,这一篇更多的是关于技术 + 产品设计的介绍。如果对lighthouse的原理感兴趣的话,欢迎查看之前的文章
lighthouse的介绍和基本使用方法
Lighthouse组合Puppeteer检测页面
lighthouse-自定义Gatherer与Audits
性能模型
在上面我们提到过不同的业务中的页面会有各自的特点,所以可能需要在lighthouse这种通用的数据基础之上再加入一些适合自己公司业务场景的性能模型,这样综合评估得出的性能评估更加契合我们的业务。在我现在的这个公司中我结合了一些其他指标,比如图片,是否上了CDN首屏的http请求的数量还有DOM元素的深度于广度来综合考量当前页面的性能,整个模型如下所示:
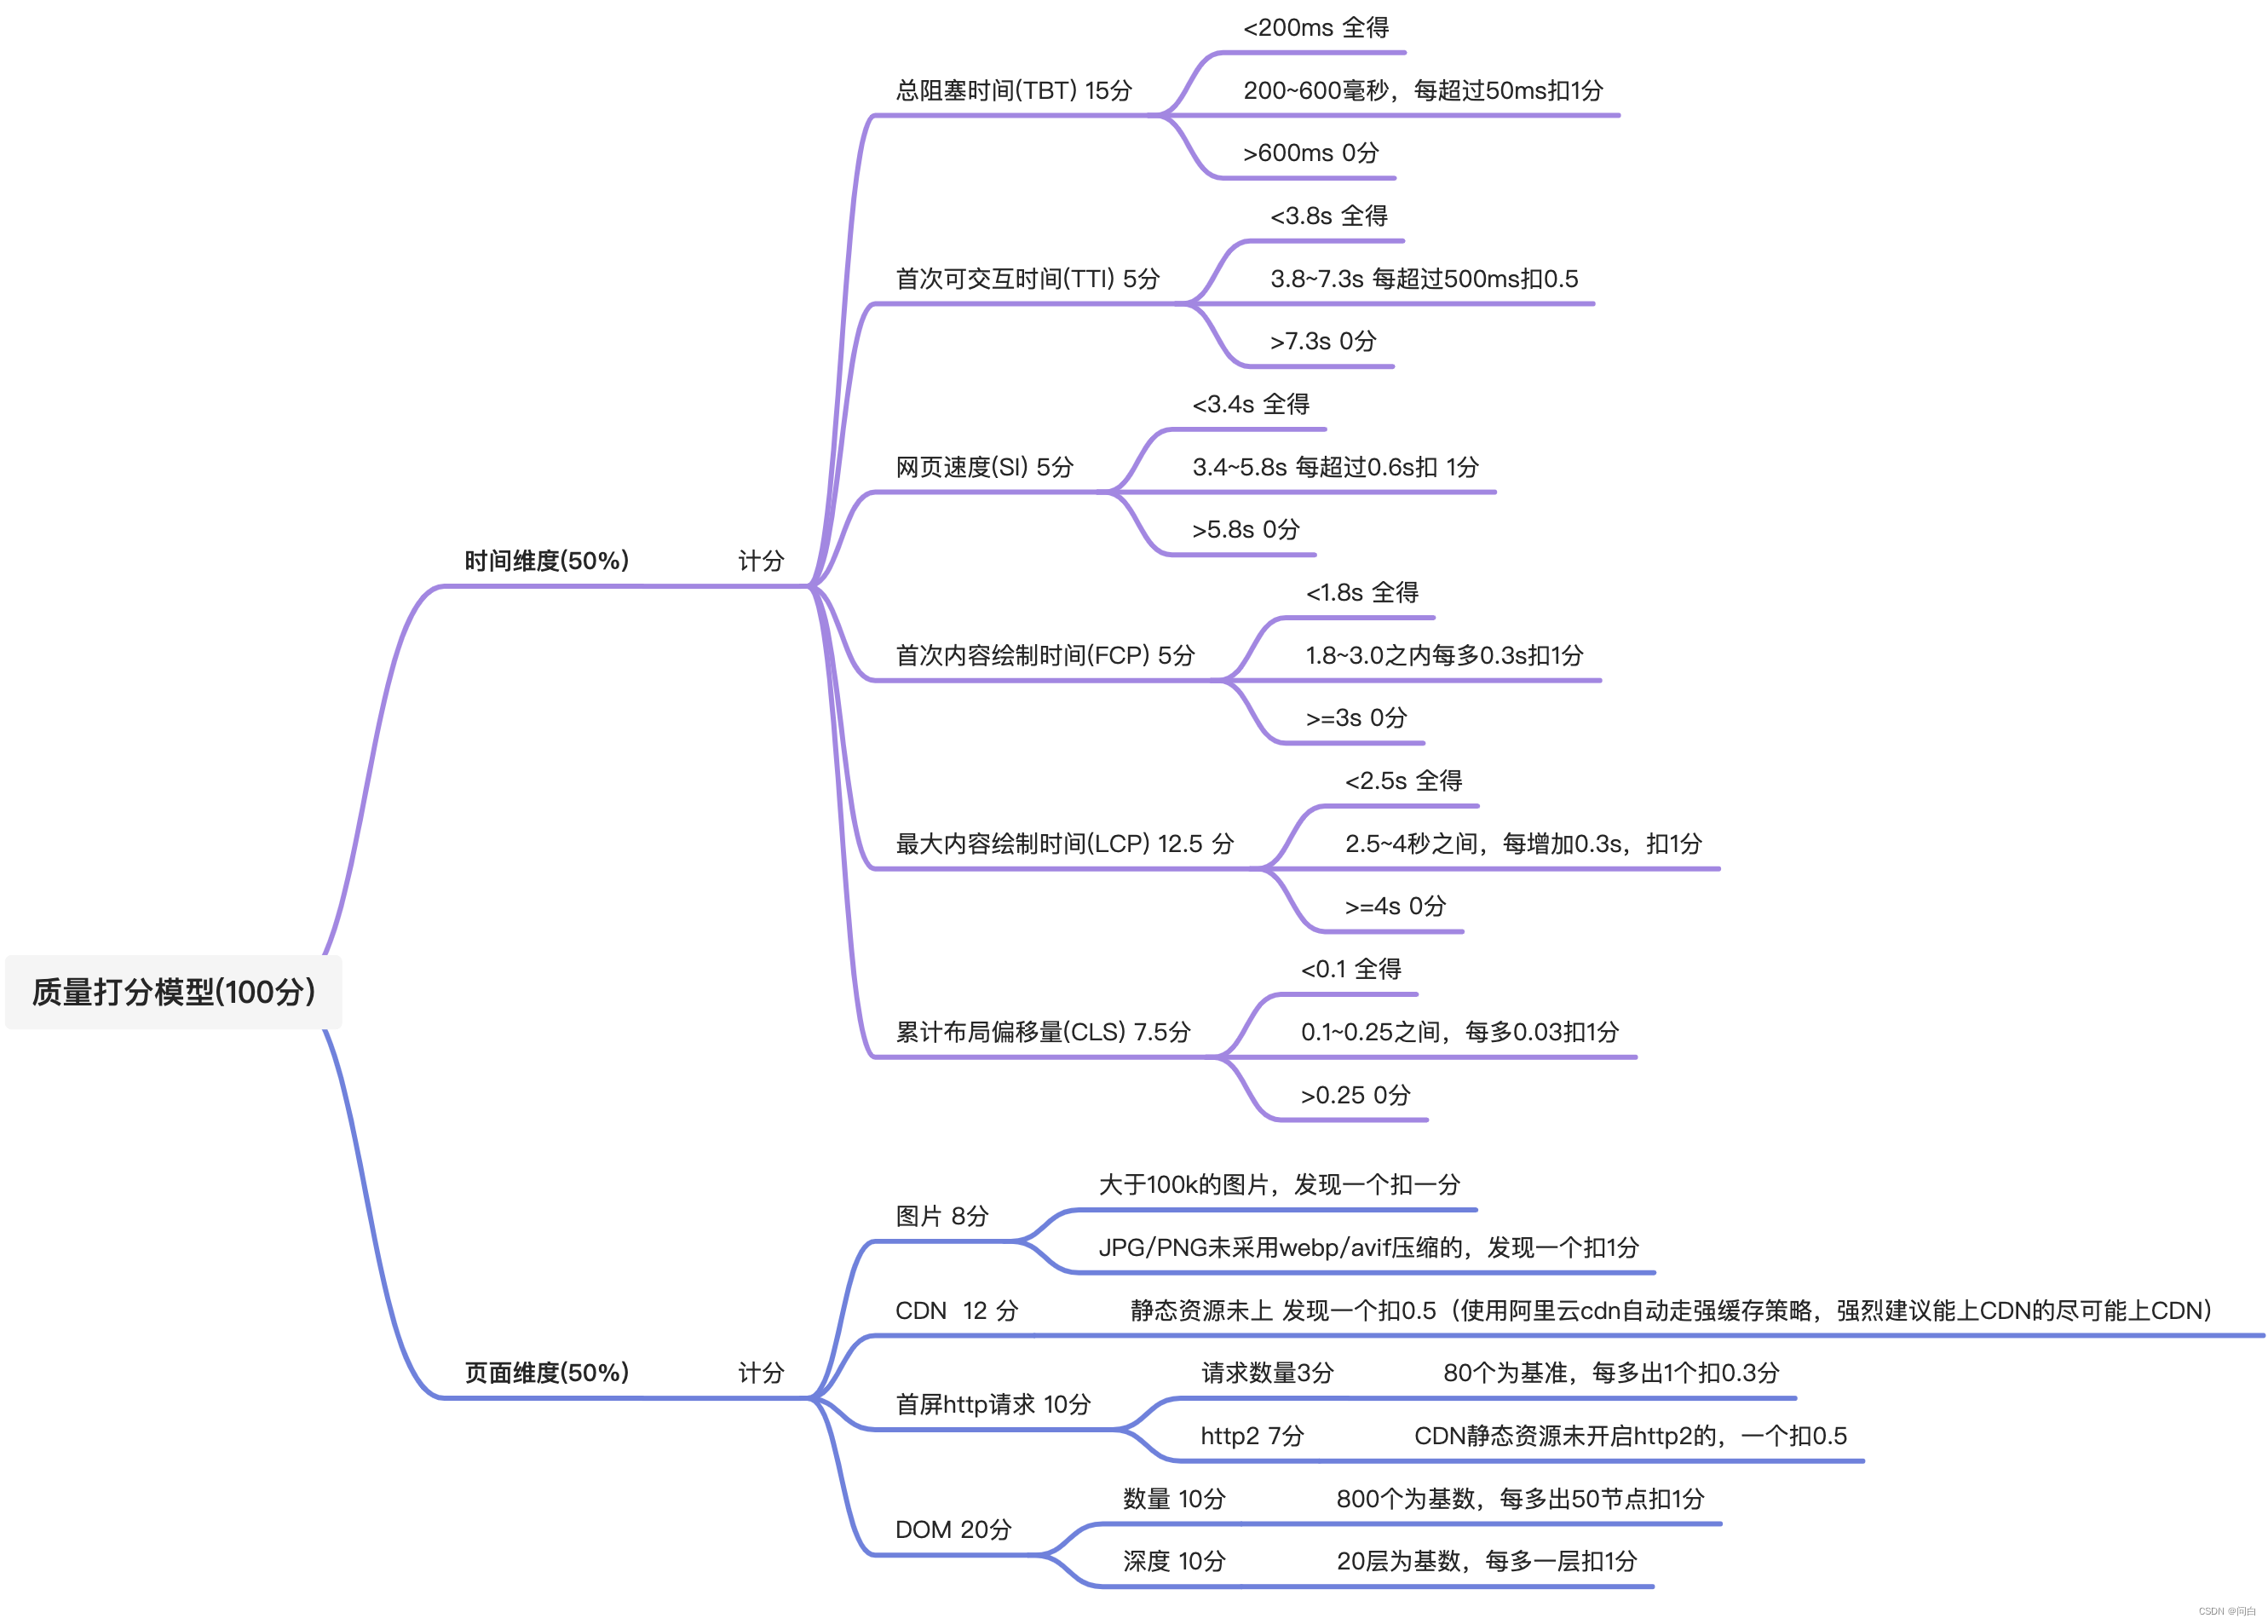
有了这个性能模型,就相当于我们有了一把尺子可以衡量出页面的整体性能如何,并根据检测之后的结果,具体的指标去进行分析优化。
整体架构
整个产品的架构如下:
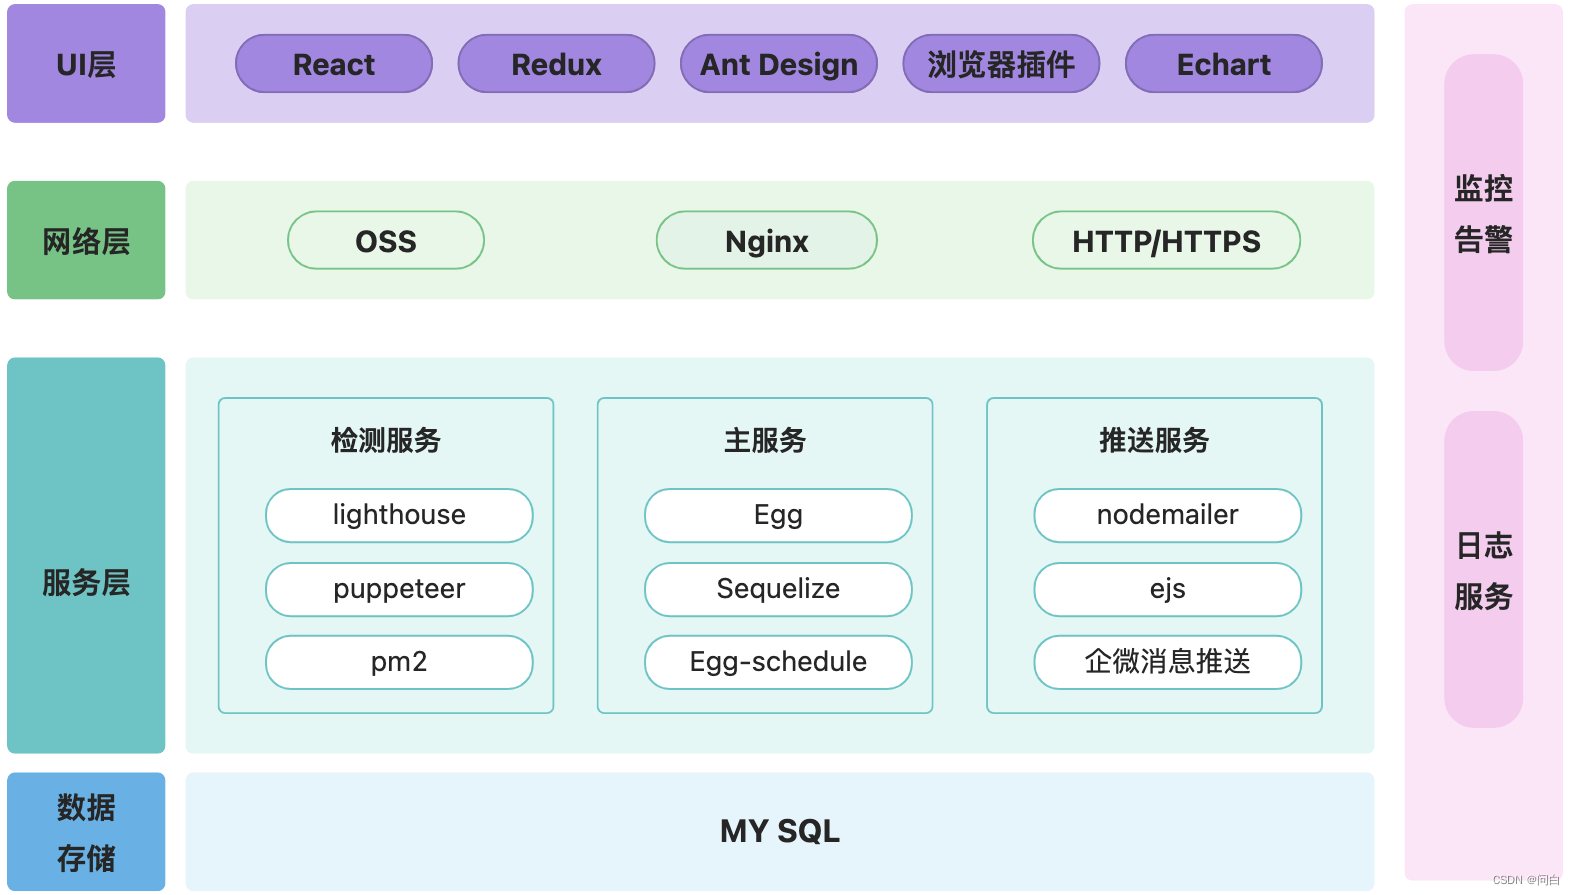
可以看到前端我们主要使用了React生态的内容,特别注意的是,这里还有有一个浏览器插件,是的你没有看错,开发了一个浏览器插件主要是有两个目的。
- 用于收集线上已有的页面路由,不用再人肉手工一个个输入了
- 可以像lighthouse扩展一样的使用我们的服务检测页面 + 消息推送
在服务层主要是使用了阿里的Egg,我们会把录入的页面定期的巡检,来观察页面在线上的整体表现和性能变化趋势,来分析不同迭代上线之后对页面性能的影响。巡检之后我们一般有每月的月报可以进行定时定向的推送,也可以设置报警阈值,即当前页面性能低于60分进行主动的告警,意味着这个页面可能存在比较大的性能隐患,需要进行额外的关注
主服务一般会在k8s中的某个容器中,还有有一个服务在单独的虚拟机中,安装必备的环境(浏览器,pupputeer)来检测特定的页面,并返回检测的结果数据。
整体流程图
整体的流程图如下所示:
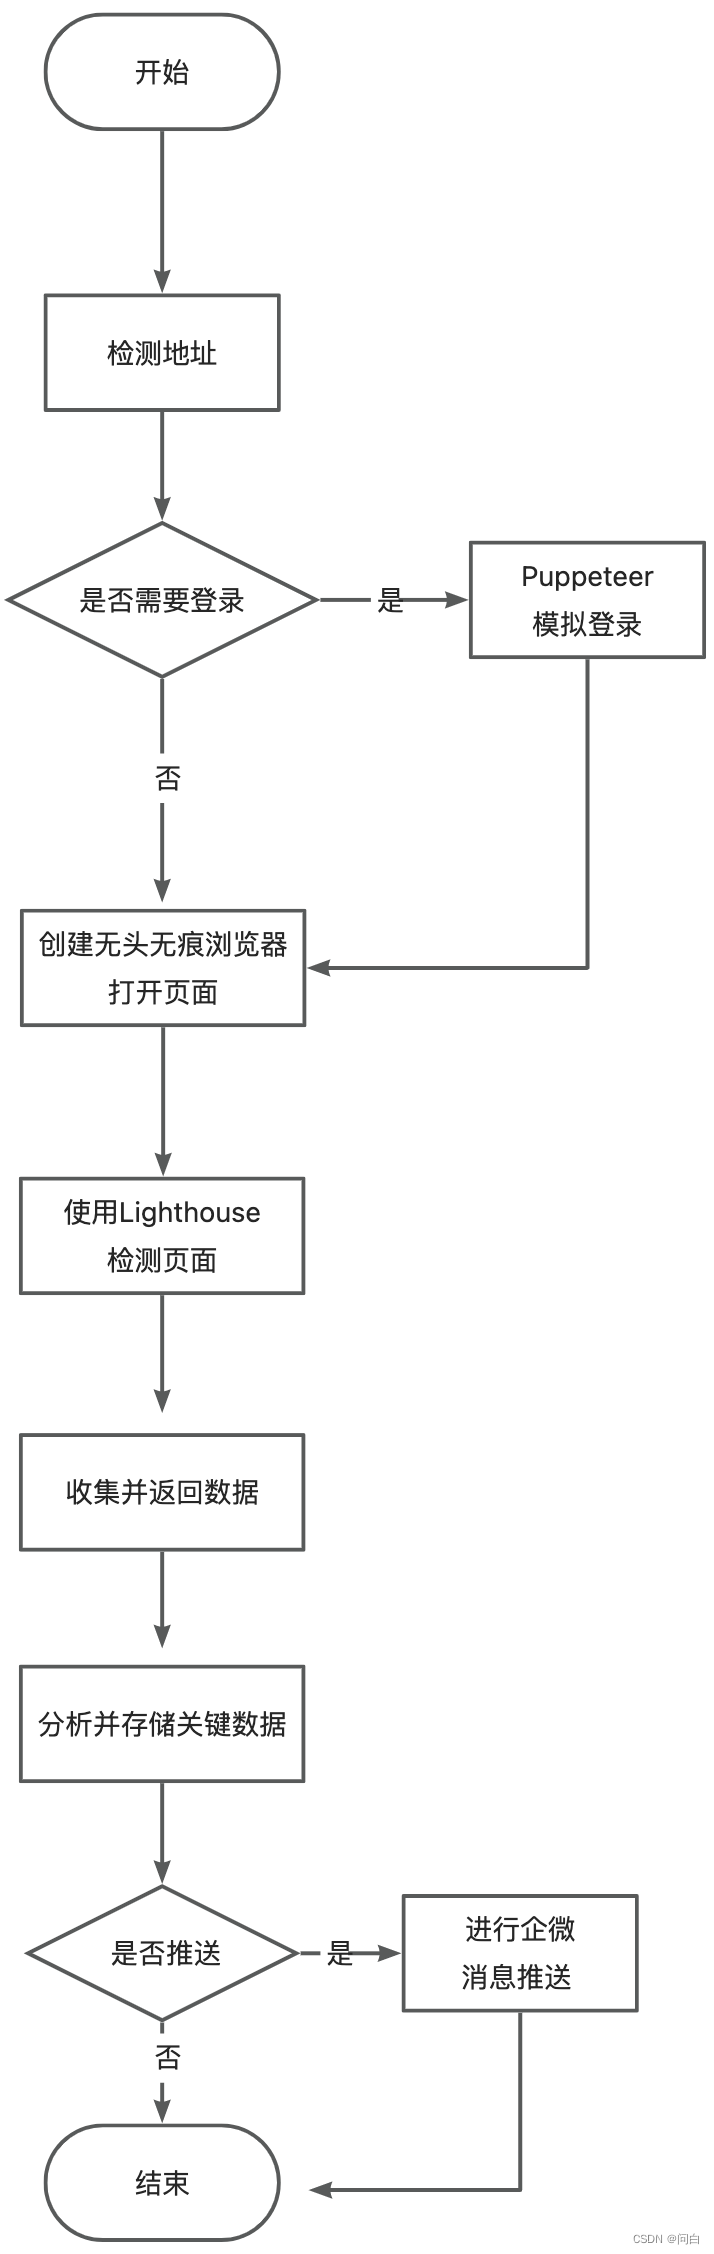
这里比较关键的是有些页面需要前置操作才能访问预期的页面。比较典型的场景就是登录,比如有很多页面我们需要在登录之后才能访问,这时候我们就需要使用puppeteer来创建一个浏览器页面,在这个页面中实现登录,登录之后再利用同源策略访问其他页面即可。如果有更复杂的操作,比如我们期望测的是C页面,但是打开C页面之前必须要进行A操作然后再执行B操作之后才能正常打开C页面,那这个时候我们就可以把操作A,B使用Puppeteer来进行操作。
比如下面就是价值好几个亿的代码,先试用Puppeteer来进行一个有Iframe的登录
private async loginWithIframe (browserInfo, params) {
    // 开始登录
    const { page } = browserInfo;
    try {
      const {
        loginUrl,
        loginIframeId,
        accountLocator,
        pwdLocator,
        loginLocator,
        account,
        pwd
      } = params;
      if (
        !loginUrl || !loginIframeId ||
        !accountLocator || !pwdLocator ||
        !loginLocator || !account ||
        !pwd
      ) throw new Error('登录信息缺失');
      // waitUntil对应的参数如下:
      // load - 页面的load事件触发时
      // domcontentloaded - 页面的 DOMContentLoaded 事件触发时
      // networkidle0 - 不再有网络连接时触发(至少500毫秒后)
      // networkidle2 - 只有2个网络连接时触发(至少500毫秒后)
      await page.goto(loginUrl, { waitUntil: 'networkidle0' });
      const elementHandle = await page.$(`#${loginIframeId}`);
      const frame = await elementHandle.contentFrame();
      await frame.waitForSelector(accountLocator);
      await frame.type(accountLocator, account);
      await frame.type(pwdLocator, pwd);
      await frame.click(loginLocator);
    } catch (error) {
      throw new Error(`登录失败: ${error.message}`);
    }
  }
登录之后我们再进行页面的检测
private async evaluatePage (browserInfo, detectUrl) {
    const { browser } = browserInfo;
    try {
      // lh检测页面参数
      const flags: any = {
        port: (new URL(browser.wsEndpoint())).port,
        output: ['html', 'json'],
        logLevel: 'info',
        onlyCategories: ['performance'],
        chromeFlags: ['--headless'],
        locale: 'zh-CN'
      };
      console.log(`开始检测页面detectUrl: ${detectUrl}`);
      const runnerResult = await lighthouse(detectUrl, flags, desktopConfig);
      console.log('Report is done for', runnerResult.lhr.requestedUrl);
      // `.report` is the report as a string
      const reportList = runnerResult.report;
      return reportList;
    } catch (error) {
      throw new Error(`检测页面失败: ${error.message};`);
    }
  }
检测完成之后我们会保存报告,并对收集的数据进行分析:
  // 存储lh制品报告
  private async generateReport (reportList) {
    try {
      // const env = process.env.NODE_ENV.trim();
      // const port = (env === 'dev') ? 3008 : 3006;
      this.createFolder();
      const [htmlContent, jsonContent] = reportList;
      const uuid = uuidv4();
      const htmlFileName = `html-${uuid}.html`;
      const jsonFileName = `json-${uuid}.json`;
      const dateTime = dayjs().format('YYYY-MM-DD');
      const reportPath = `report/${dateTime}/`;
      const reportDir = `${rootPath}public/${reportPath}`;
      const htmlFilePath = `${reportDir}${htmlFileName}`;
      const jsonFilePath = `${reportDir}${jsonFileName}`;
      fs.writeFileSync(htmlFilePath, htmlContent);
      fs.writeFileSync(jsonFilePath, jsonContent);
      const htmlVisitPath = reportPath + htmlFileName;
      const jsonVisitPath = reportPath + jsonFileName;
      const htmlUrl = `http://${localMachineIp}:${port}/${htmlVisitPath}`;
      const jsonUrl = `http://${localMachineIp}:${port}/${jsonVisitPath}`;
      return {
        htmlUrl,
        jsonUrl
      };
    } catch (error) {
      throw new Error(`存储制品失败: ${error.message}`);
    }
  }
解析报告的逻辑如下:
// 解析报告得到页面评分
const getPageScoreByReport = (jsonContent, appCode = null) => {
  try {
    const report = JSON.parse(jsonContent);
    const { audits } = report;
    const { field } = indicatorVal;
    const {
      siField,
      ttiField,
      tbtField,
      clsField,
      lcpField,
      fcpField,
      nrField,
      dsField
    } = field;
    const fcpInfo = getFCPScore(audits[fcpField]);
    const ttiInfo = getTTIScore(audits[ttiField]);
    const tbtInfo = getTBTScore(audits[tbtField]);
    const clsInfo = getCLSScore(audits[clsField]);
    const lcpInfo = getLCPScore(audits[lcpField]);
    const siInfo = getSIScore(audits[siField]);

    const imgInfo = getImgScore(audits[nrField]);
    const cdnInfo = getCDNScore(audits[nrField], appCode);
    const httpNumInfo = getHttpNumScore(audits[nrField]);
    const http2Info = getHttpProtocolScore(audits[nrField]);
    const domNumInfo = getDomNumScore(audits[dsField]);
    const domDeepInfo = getDomDeepScore(audits[dsField]);
    const timeScore = siInfo.siScore + ttiInfo.ttiScore + tbtInfo.tbtScore + clsInfo.clsScore + lcpInfo.lcpScore + fcpInfo.fcpScore;
    const pageScore = imgInfo.imageScore + cdnInfo.cdnScore + httpNumInfo.httpNumScore + http2Info.http2Score + domNumInfo.domNumScore + domDeepInfo.domDeepScore;
    const totalScore = timeScore + pageScore;
    return {
      ...siInfo,
      ...ttiInfo,
      ...tbtInfo,
      ...clsInfo,
      ...lcpInfo,
      ...fcpInfo,
      ...imgInfo,
      ...cdnInfo,
      ...httpNumInfo,
      ...http2Info,
      ...domNumInfo,
      ...domDeepInfo,
      totalScore
    };
  } catch (error) {
    throw new Error(`解析报告出错: ${error.message}`);
  }
}
整体页面效果如下:
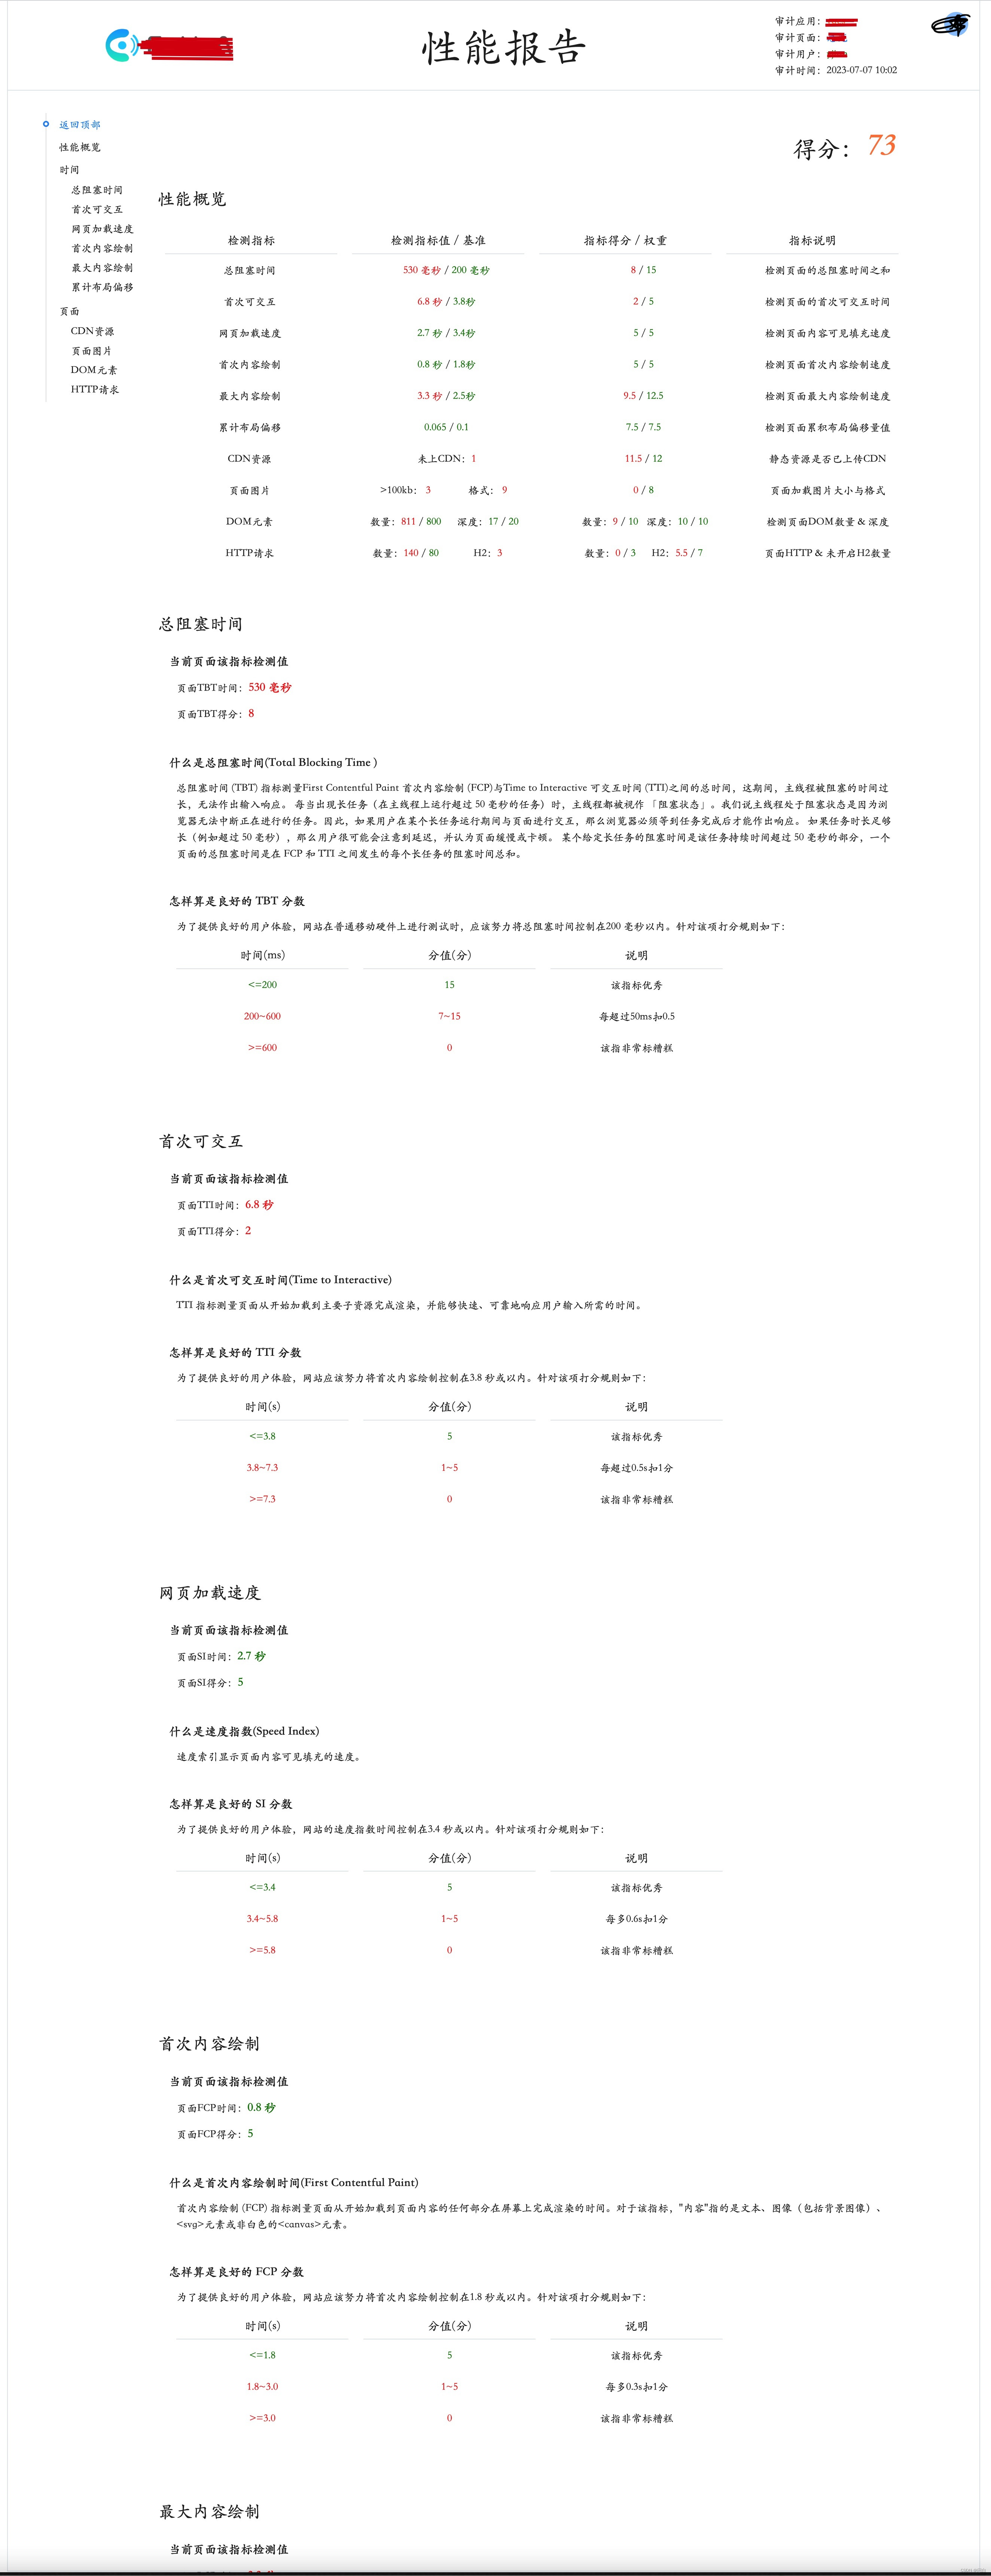
在实际使用中,我们会把这个检测能力放入到我们研发流程中。即对上线的每一个页面都会检测其页面的整体性能如何,只有达到事先设定的阈值之后才能正常的从开发环境到测试环境到预发环境最后上线。以此来保障我们上线的每一个页面的整体性能表现。
参考资料
Chrome 性能指标 - FCP
Chrome 性能指标 - TTI
Chrome 性能指标 -TBT
Chrome 性能指标 - CLS
Chrome 性能指标 - LCP
Chrome 性能指标 - SI
lighthouse的介绍和基本使用方法
Lighthouse组合Puppeteer检测页面
lighthouse-自定义Gatherer与Audits