自组织地图 (SOM) — 介绍、解释和实现
一、说明
二、关于 SOM
芬兰教授Teuvo Kohonen在1980年代提出的自组织地图或SOM提供了一种在保留数据拓扑的同时对数据集进行低维和离散化表示的方法,称为“地图”。
目标是学习一个以类似方式响应类似输入模式的地图。它被学习为一个权重数组,它被解释为一个神经元数组,其中每个神经元本身都是一个与输入数据点具有相同维度的向量,如下所示。神经元直接受到输入数据的影响。
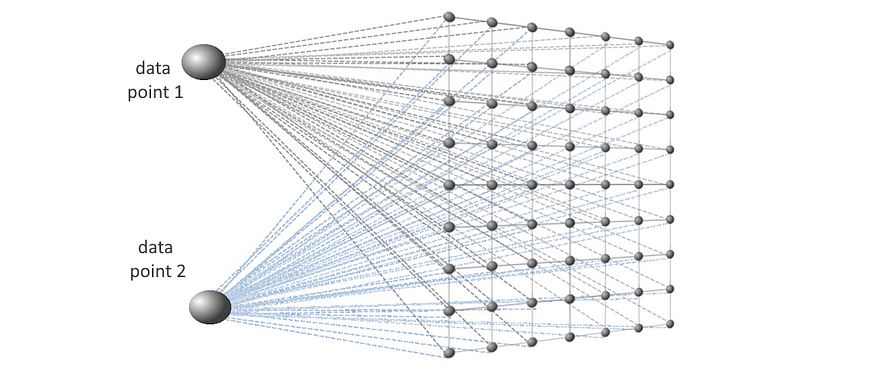
权重数组中神经元之间的距离用于生成表征数据分布的映射。
SOM 具有轻松可视化特征行为的优势。由于可以从学习的表示中访问各个特征,因此表示每个特征的数据行为。
让我们分解一下:
“自组织”
SOM 是一种无监督的人工神经网络。它不是使用误差最小化技术,而是使用竞争性学习。特征向量使用数据点和学习表示之间的基于距离的指标映射到低维表示,不需要任何其他计算,使其“自组织”。
“地图”
学习到的结果权重由U矩阵(统一距离矩阵,下面详细解释)表示,这是一个表示神经元之间距离的“映射”。学习SOM背后的想法是,形成的映射以类似的方式响应类似的输入,在生成的映射的某些区域中将类似的输入组合在一起。
三、在 Python 中的实现
Eklavya 连贯地解释了该算法,提供了带有变量适当表示的分步解释,我们也将用于我们的 Python 实现。
Kohonen自组织地图
一种特殊类型的人工神经网络
towardsdatascience.com
目标是学习一个权重数组,在我们的例子中是一个 3D 数组,但被解释为神经元大小为 x 的 2D 数组,其中每个神经元都是长度的 1D 向量。我们正在学习数据集的 2D 表示。 然后用于生成 U 矩阵 — 整个数据集的单个 2D 地图。Wlengthwidthn_featuresW
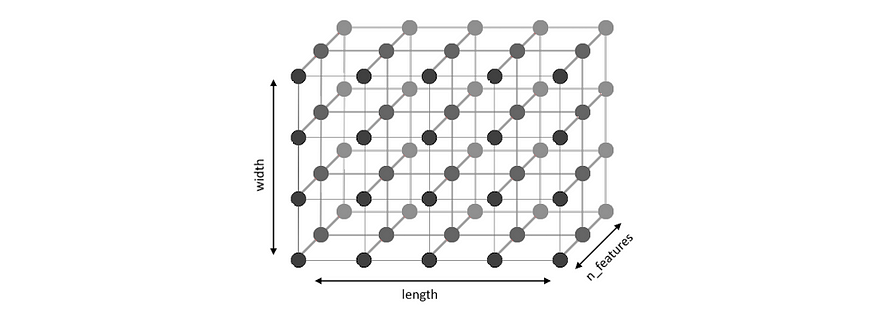
图1 - 权重数组“W”
每个输入向量用于更新 。最接近数据点的神经元是最佳匹配单元(BMU)。其余神经元与BMU的距离用于更新邻域函数,该函数是更新的基础。中较大的值表示相似输入向量的聚类。邻域函数的学习率和半径随时间衰减,因为邻域变小,即相似的输入被分组得更紧密。WWWW
首先,导入所有必要的库。
from sklearn.preprocessing import MinMaxScaler, StandardScaler
import matplotlib
import matplotlib.pyplot as plt
import numpy as np
import random
import time
from itertools import product
四、第一部分:从数据集导入到权重获取
对于数据,我们使用用于预测胎儿健康的数据集,该数据集将胎儿的健康分类为 、 或使用 CTG 数据。它有 22 个功能,但我们只关注前 10 个功能:NormalSuspectPathological
filein = "fetal_health.csv"
data = np.loadtxt(open(filein, "rb"), delimiter = ",", skiprows = 1)
features = ['baseline value', 'accelerations', 'fetal_movement',
            'uterine_contractions', 'light_decelerations',
            'severe_decelerations', 'prolongued_decelerations',
            'abnormal_short_term_variability',
            'mean_value_of_short_term_variability',
            'percentage_of_time_with_abnormal_long_term_variability']
X_data = np.array(data)[:,0:len(features)]

print("Number of datapoints: ", X_data.shape[0])
print("Number of features: ", X_data.shape[1])
而且,由于它使用基于距离的指标,我们将继续缩放输入:
scaler = MinMaxScaler()
X_data = scaler.fit_transform(X_data) # normalizing, scaling现在,深入探讨算法实现的细节。首先,我们看一下超参数:
n_features = X_data.shape[1]
max_iter = 1000                                   # max. no. of iterations
length = 50                                       # length of W
width = 50                                        # width of W
W = np.random.rand([length, width, n_features])   # initial weights
aplha0 = 0.9                                      # initial learning rate
beta = [[]]                                       # neighbourhood function
sigma0 = max(length, width)                       # initial radius of beta
TC = max_iter/np.log(sigma0) # time constantlength, , — 权重矩阵的维度,其中 和 指定 feaure 地图的大小,值越高,结果越精细。使用随机值初始化。widthn_feauturesWlengthwidthWmax_iter— 我们想要运行算法的最大迭代次数。TC— 用于学习率和邻域半径衰减的时间常数。alpha0— 动态学习率的初始值。学习率衰减为时间步长或迭代次数t的指数函数:alphat
def aplhaUpdate(t):
return aplha0*np.exp(-t/TC)sigma0— 邻域函数的动态(收缩)半径的初始值。我们从一个半径开始,该半径覆盖了神经元的整个 2D 映射。它的更新方式与 相同。Walpha
def sigmaUpdate(t):
return sigma0*np.exp(-t/TC)beta一个 2D 向量,用于存储 中每个节点的邻域函数的值。BMUBMU— est atching nit 是最接近输入数据点的节点,即与它的距离最短,在我们的例子中,欧几里得距离,如下所示。BMUx_n
def winningNode(x_n, W): # Find the winning node and distance to it
    dist = np.linalg.norm(x_n - W, ord =2 , axis = 2)
    d = np.min(dist)
    BMU = np.argwhere(dist == np.min(dist))
return d, BMU- 要更新,我们首先需要找到权重向量中每个节点与 . 是表示每个长向量到每个其他向量的欧几里得距离的向量,其中每个向量由其 x 和 y 坐标表示。
betaBMUhardDistn_featureWWcoords
hardDist = np.zeros([length, width, length, width])
for i,j,k,l in product(range(length),range(width),range(length),range(width)):
hardDist[i,j,k,l]= ((i-k)**2 + (j-l)**2)**0.5gridDistances用于访问表示距离或每个向量在位置 的 2D 数组。coords
def gridDistances(coords):
return hardDist[coords[0][0],coords[0][1],:,:]- 然后我们可以更新 .对于每个输入向量,计算为最接近 的点提供最小值。
betabetaBMU
def betaUpdate(coords, sigma): # neighbourhood function
return np.exp(-gridDistances(coords)**2/(2*sigma**2))- 下图显示了一个权重数组,在第二张图中可以想象为矢量神经元的 2D 数组。以红色突出显示的矢量是 BMU。蓝色表面显示了每个神经元的值,在BMU处最高。的值表示二维正态分布。
Wbetabeta
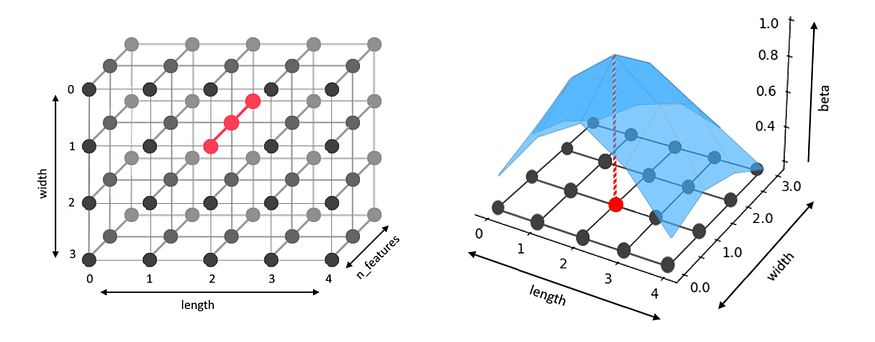
图 2 — W,BMU 以红色突出显示(左和右),为 sigma=1.5 绘制的 beta 值,显示 BMU 处的 beta 值最高。
- 最后,我们可以更新 .我们看到有三个因素影响了更新:(1),它在数据集的一次迭代中是恒定的;(2)、每个向量与输入向量的差值;和(3) .将因子添加到 ,因此对于靠近输入的向量,的值更大,从而导致 中的向量值更大。
WWalphaf=x_n-WWbetaalpha*beta*fWWbetaW
def weightUpdate(W, aplha, beta, x_t):
    f= (x_t-W)
    beta = np.reshape(beta,[beta.shape[0],beta.shape[1],1])
    return W+aplha*beta*f
现在,我们已经讨论了初步内容,我们可以将它们放在一起:
errors=np.zeros([max_iter])

for t in range(max_iter):

    t1 = time.time()
    alpha = aplhaUpdate(t)
    sigma = sigmaUpdate(t)

    np.random.shuffle(X_data)
    n_sample = len(X_data) # iterating over whole dataset
    QE = 0

    for n in range(n_sample):
        d, BMU = winningNode(X_data[n,:], W)
        QE = QE + d
        beta = betaUpdate(BMU, sigma)
        W = weightUpdate(W, alpha, beta, X_data[n,:])
        W /= np.linalg.norm(W, axis=2).reshape((length, width, 1))

    QE /= n_sample
    errors[t]=QE
    t1 = time.time() - t1

    print("Iteration: ", "{:05d}".format(t), " | Quantization Error: ", "{:10f}".format(QE),  " | Time: ", "{:10f}".format(t1))
让我们一步一步地看一下。
- 对于每次迭代,并略微衰减以适应 中的逐渐变化。
alphasigmaW - 对于数据集中的每个输入向量,我们找到 BMU 和 BMU 与输入向量的距离 .
d beta根据BMU进行更新,然后用于更新.WW被归一化,以便在不同的值下保持可比性。Wt- 为了监控学习过程,我们使用量化误差,这是每个数据点到其BMU的距离的平均值。如果更新正确,它应该在迭代中减少。
QEW
当我们在数据集上运行它时,我们得到以下输出:

我们可以通过沿其代表特征的最后一个维度切片来绘制各个特征图。W
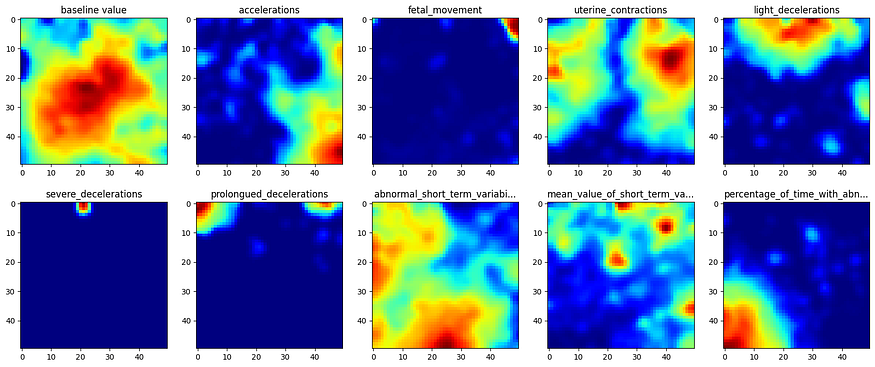
图3 - 特征图
这样就完成了学习获取单个特征图的第一步。W
五、第二部分:U矩阵获取
第二部分是简单地计算神经元之间的距离以获得U矩阵(Unified-distance矩阵),它可以是六边形或矩形。在下图中,我们看到了查看 中神经元 2D 数组的两种方式。W

图 5 — W、六边形(左)和矩形(右)的不同解释
U矩阵表示神经元之间的距离。下图显示了六边形和矩形表示的 U 矩阵。在两张图像中,黄色细胞表示相邻神经元之间的距离,例如,{1,2}是上图中神经元1和2之间的距离。橙色单元格表示从神经元数到周围神经元的距离的平均值,即 {1}=mean({1,2}, {1,4}) 或 {5}=mean({2,5}, {4,5}, {5,6}, {5,7}, {5,8}, {5,9}) 对于六边形 U 矩阵,{5}=mean({2,5}, {4,5}, {5,6}, {5,8}) 对于矩形矩阵。

图 6 — U 矩阵,六边形(左)和矩形(右)
在矩形 U 矩阵中,还有一种其他类型的单元格,以蓝色突出显示。我们不能将其视为蓝色单元格角上的橙色单元格之间的距离,例如平均值({1},{5})或平均值({2},{4}),因为这些值对蓝色单元格都有效,但不相等,这将是矛盾的。因此,我们将该值作为其周围黄色单元格的平均值,从而允许最终 U 矩阵中的单元格之间更平滑地过渡。有关进一步说明,请参阅此文章。下面给出了两种类型的 U 矩阵的计算。
对于黄色单元格,我们计算相邻神经元之间的距离,橙色和蓝色单元格计算为它们上方、下方和两侧单元格的平均值。
# CALCULATION OF RECTANGULAR U-MATRIX FROM W
def make_u_rect(W):

    U = np.zeros([W.shape[0]*2-1, W.shape[1]*2-1], dtype=np.float64)

    # YELLOW CELLS
    for i in range(W.shape[0]): # across columns
        k=1
        for j in range(W.shape[1]-1):
            U[2*i, k]= np.linalg.norm(W[i,j]-W[i,j+1], ord=2)
            k += 2

    for j in range(W.shape[1]): # down rows
        k=1
        for i in range(W.shape[0]-1):
            U[k,2*j] = np.linalg.norm(W[i,j]-W[i+1,j], ord=2)
            k+=2

    # ORANGE AND BLUE CELLS - average of cells top, bottom, left, right.
    for (i,j) in product(range(U.shape[0]), range(U.shape[1])):
        if U[i,j] !=0: continue
        all_vals = np.concatenate((
               U[(i-1 if i>0 else i): (i+2 if i<=U.shape[0]-1 else i), j],
               U[i, (j-1 if j>0 else j): (j+2 if j<=U.shape[1]-1 else j)]))
        U[i,j] = all_vals[all_vals!=0].mean()

    # Normalizing in [0-1] range for better visualization.
    scaler = MinMaxScaler()
    return scaler.fit_transform(U)
对于六边形矩阵,我们使用神经元本身的值作为位置{1}、{2}、...以简化 中 {1,2}、{2,3} 等的计算。{1}, {2}, ...然后替换为其周围值的平均值。U
# CALCULATION OF HEXAGONAL U-MATRIX FROM W
def make_u_hex(W):

    # Creating arrays with extra rows to accommodate hexagonal shape.
    U_temp =  np.zeros([4*W.shape[0]-1, 2*W.shape[1]-1, W.shape[2]])
    U = np.zeros([4*W.shape[0]-1, 2*W.shape[1]-1])
    """
    The U matrix is mapped to a numpy array as shown below.
    U_temp holds neuron at postion 1 in place of {1} for easy computation
    of {1,2}, {2,3} etc. in U. {1}, {2}, {3}, ... are computed later.
    [
      [    (1),        0,       0,       0,    (3)],
      [      0,    (1,2),       0,   (2,3),      0],
      [   (1,4),       0,     (2),       0,  (3,6)],
      [      0,    (2,4),       0 ,  (2,6),      0],
      [    (4),        0,    (2,5),      0,    (6)],
      [      0,    (4,5),        0,  (5,6),      0],
      [   (4,7),       0,      (5),      0,  (6,9)],
      [      0,    (2,4),        0,  (5,9),      0],
      [    (7),        0,    (5,8),      0,    (9)],
      [      0,    (7,8),        0,  (8,9),      0],
      [      0,        0,      (8),      0,      0]
    ]
    """

    # Creating a temporary array placing neuron vectors in
    # place of orange cells.
    k=0
    indices = []
    for i in range(W.shape[0]):
        l=0
        for j in range(W.shape[1]):
            U_temp[k+2 if l%4!=0 else k,l,:] = W[i,j,:]
            indices.append((k+2 if l%4!=0 else k,l))
            l+=2
        k += 4

    # Finding distances for YELLOW cells.
    for (i,j),(k,l) in product(indices, indices):
        if abs(i-k)==2 and abs(j-l)==2:      # Along diagonals
            U[int((i+k)/2), int((j+l)/2)] =
                np.linalg.norm(U_temp[i,j,:]-U_temp[k,l,:], ord=2)

        if abs(i-k)==4 and abs(j-l)==0:       # In vertical direction
            U[int((i+k)/2), int((j+l)/2)] =
                np.linalg.norm(U_temp[i,j,:]-U_temp[k,l,:], ord=2)

    # Calculating ORANGE cells as mean of immediate surrounding cells.
    for (i,j) in indices:
        all_vals =
          U[(i-2 if i-1>0 else i): (i+3 if i+2<U.shape[0]-1 else i),
            (j-1 if j>0 else j): (j+2 if j<=U.shape[1]-1 else j)]
        U[i,j] = np.average(all_vals[all_vals!=0])

    # To remove extra rows introduced in above function.
    new_U = collapse_hex_u(U)

    # Normalizing in [0-1] range for better visualization.
    scaler = MinMaxScaler()
    return scaler.fit_transform(new_U)


def collapse_hex_u(U):

    new_U = np.zeros([int((U.shape[0]+1)/2), U.shape[1]])
    # Moving up values in every alternate column
    for j in range(1, U.shape[1], 2):
            for i in range(U.shape[0]-1):
                U[i,j]=U[i+1,j]

    # Removing extra rows
    for i in range(new_U.shape[0]): new_U[i,:] = U[2*i,:]

    return new_U
要绘制六边形网格,我们需要自己在图上绘制六边形。对于折叠的六边形,我们可以绘制 U 矩阵,方法是为每个点绘制一个六边形,每两列有一个轻微的 y 偏移量,以制作一个网格,如图 6 所示。U
def draw_hex_grid(ax, U):

    def make_hex(ax, x, y, colour):
        if x%2==1: y=y+0.5
        xs = np.array([x-0.333,x+0.333,x+0.667,x+0.333,x-0.333,x-0.667])
        ys = np.array([  y+0.5,  y+0.5,      y,  y-0.5,  y-0.5,      y])
        ax.fill(xs, ys, facecolor = colour)

    ax.invert_yaxis()
    cmap = matplotlib.cm.get_cmap('jet')

    for (i,j) in product(range(U.shape[0]), range(U.shape[1])):
        if U[i,j]==0: rgba='white'
        else: rgba = cmap(U[i,j])
        make_hex(ax, i, j, rgba)

    ax.set_title("U-Matrix (Hexagonal)")
图 3 所示的两种类型的 U 矩阵结果为:W
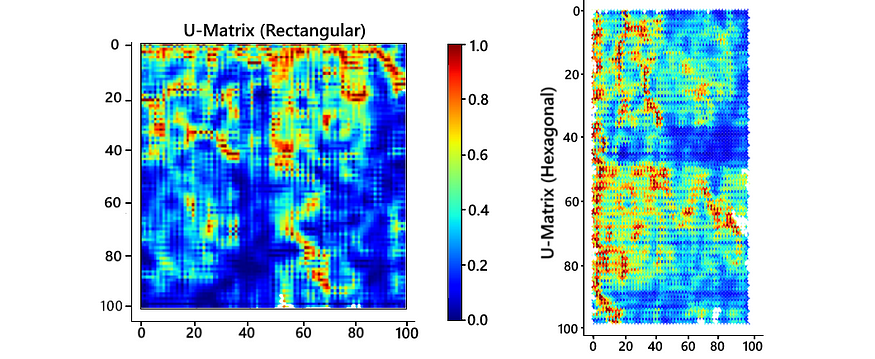
图 7 — U 矩阵
在学习过程中拍摄如图 3 所示的快照,我们可以观察每个特征图和 U 矩阵的学习情况。上面显示的颜色图显示,红色表示最大值,表示该区域中聚集的更多输入数据点,而模糊区域表示输入数据点稀疏出现的空间。W
随着迭代的进行,学习速度变慢了。在开始的迭代中,特征图变化很大,而在以后的迭代中,它们变得有些稳定。矩阵也出现了同样的趋势,社区的规模在缩小。这也反映在 中,其下降速率随时间而降低。哈尼亚·安尤姆
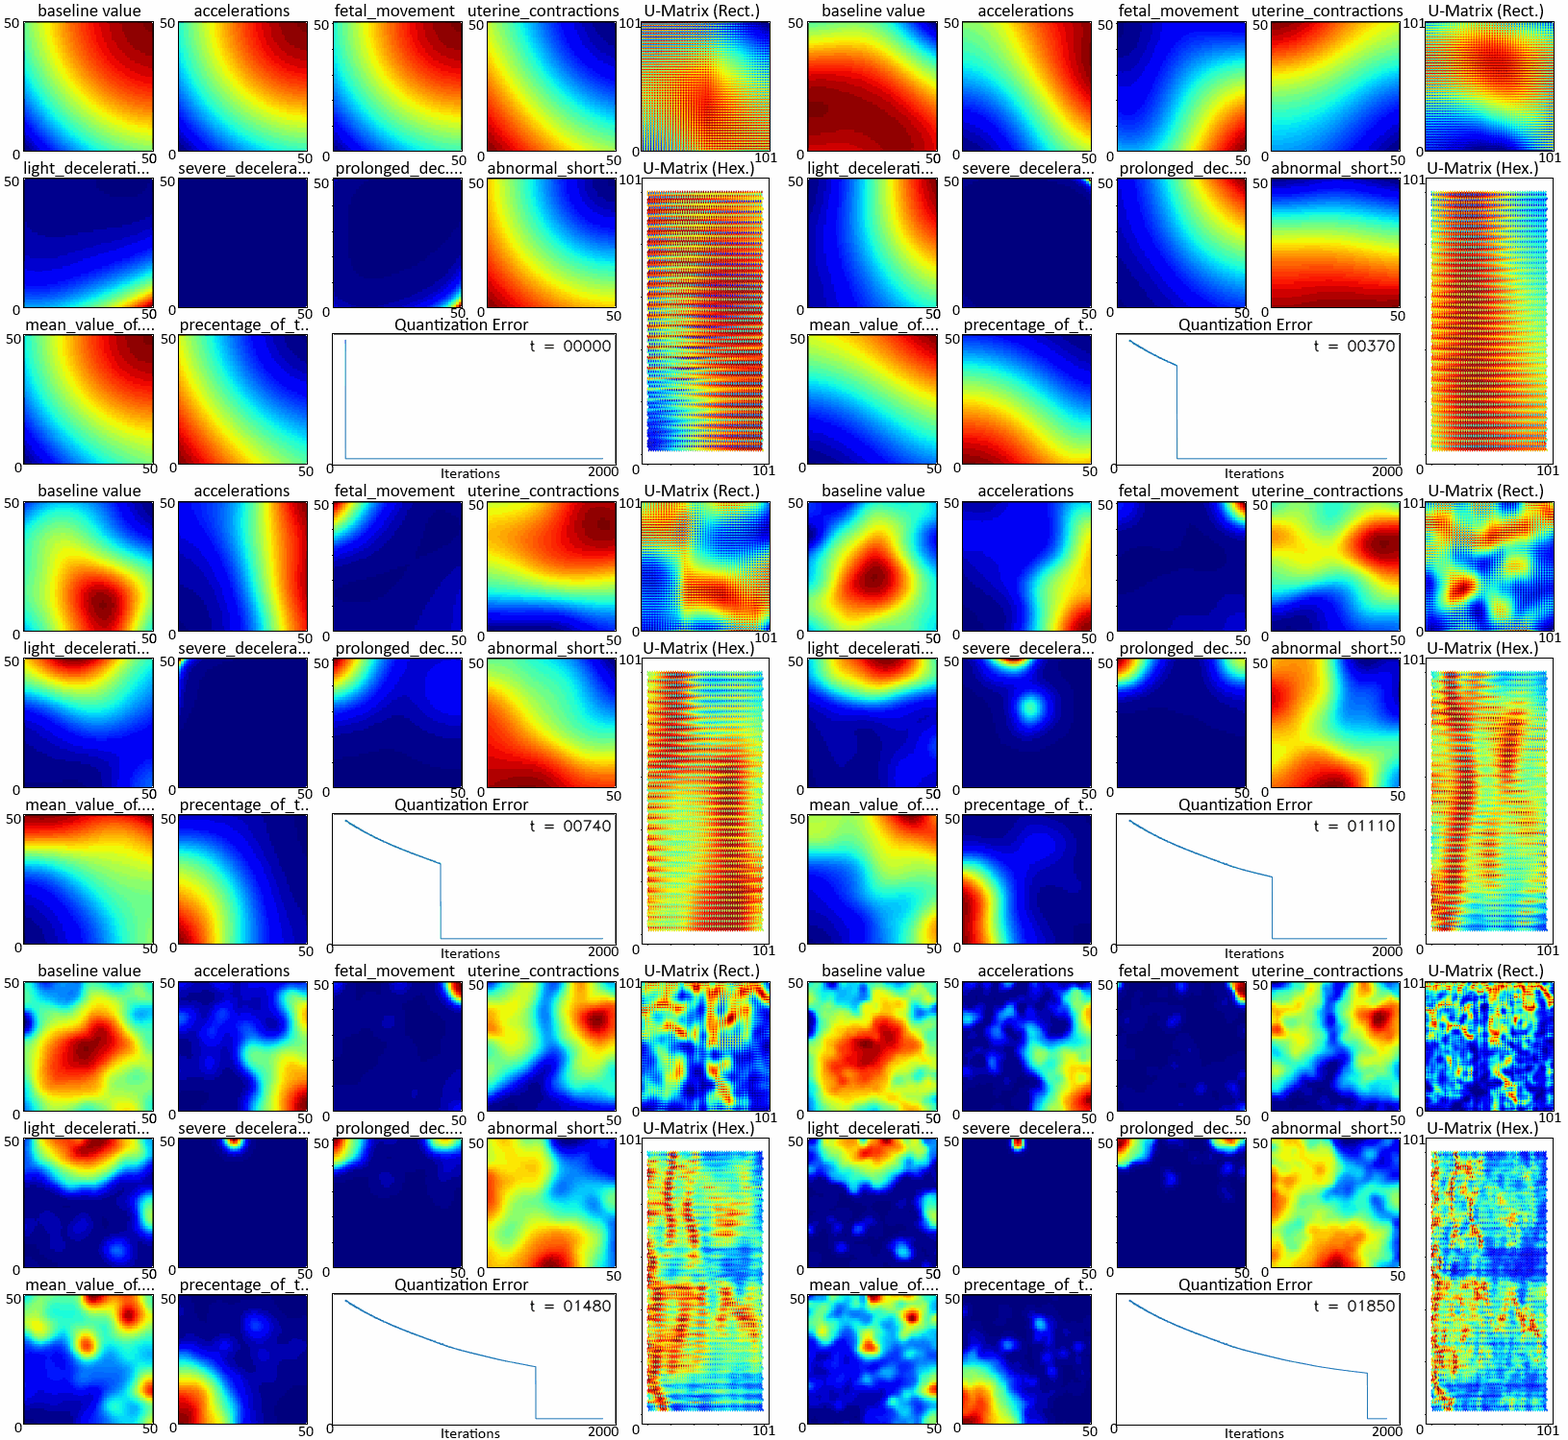
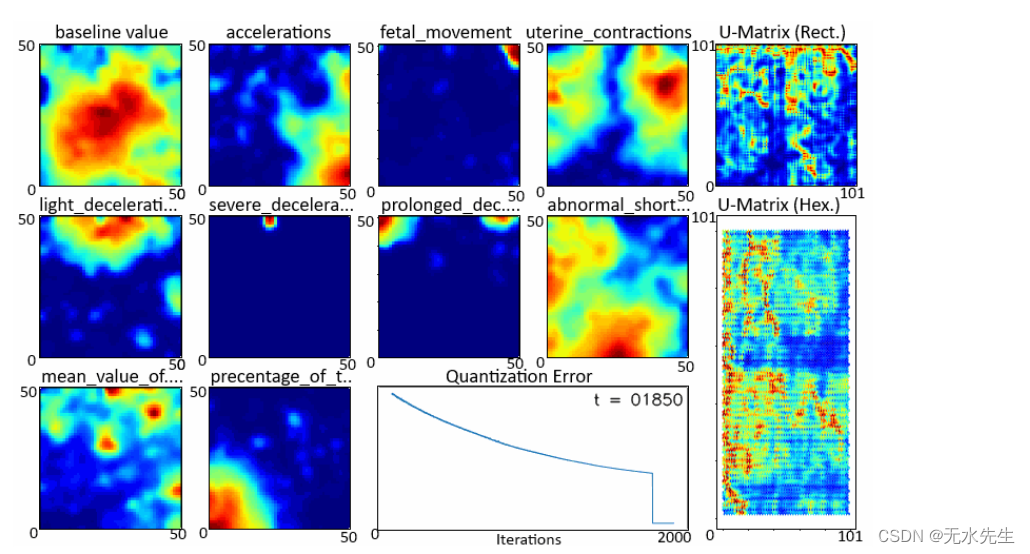
显示“W”和“U”学习的.gif图像(在新选项卡中打开以再次播放)



![[bug日志]springboot多模块启动,在yml配置启动端口8081,但还是启动了8080](https://img-blog.csdnimg.cn/c69a7c6632b942f0b6099eb0f5d9ecd2.png)
