#使用ggplot2绘制热图
library(ggplot2)
#清空
rm(list=ls())
gc()
# 创建数据集
data <- mtcars
# 计算相关系数矩阵
cor_matrix <- cor(data)
# 将相关系数矩阵转换为长格式(用于绘制热图)
cor_data <- reshape2::melt(cor_matrix)
str(cor_data)
###简单热图###
# 使用ggplot2绘制热图
ggplot(data = cor_data, aes(x = Var1, y = Var2, fill = value)) +
  geom_tile() +
  scale_fill_gradient(low = "blue", high = "red") +#设置颜色变化范围
  theme_minimal()#设置为简洁主题
###修饰热图###
#1 显示标签
ggplot(data = cor_data, aes(x = Var1, y = Var2, fill = value)) +
  geom_tile() +#geom_raster()也可以
  geom_text(aes(label = round(value,2), size = 3, color = 'white')) +#显示标签
  scale_fill_gradient(low = "blue", high = "red") +
  theme_minimal()
#2 方块转化为其他形状-圆形
ggplot(data = cor_data, aes(x = Var1, y = Var2)) +
  geom_point(aes(color=value,size=abs(value)),na.rm = TRUE) +#size调节大小
  geom_text(aes(label = round(value,2)),color="green") +#显示标签
  scale_fill_gradient(low = "blue", high = "red") +
  theme_minimal()
#3 方块间添加空隙
ggplot(data = cor_data, aes(x = Var1, y = Var2, fill = value)) +
  geom_tile(width = 0.95, height = 1) +
  geom_text(aes(label = round(value,2)),color="green") +#显示标签
  scale_fill_gradient(low = "blue", high = "red") +
  theme_minimal()
#4 小方格添加边框
ggplot(data = cor_data, aes(x = Var1, y = Var2, fill = value)) +
  geom_tile(width = 0.95, height = 0.95,color = "black", linetype = "solid") +
  geom_text(aes(label = round(value,2)),color="green") +#显示标签
  scale_fill_gradient(low = "blue", high = "red") +
  theme_minimal()
#5 添加注释
#注释信息
group <- colnames(cor_matrix) %>% as.data.frame() %>%
  mutate(group=c(rep("S1",3),rep("S2",3),rep("S3",3),rep("S4",2))) %>%
  mutate(p="group") %>%
  ggplot(aes(.,y=p,fill=group))+
  geom_tile() +
  scale_y_discrete(position="right") +
  theme_minimal()+xlab(NULL) + ylab(NULL) +#应用简洁主题,去除x轴和y轴
  theme(axis.text.x = element_blank())+#x轴清空
  labs(fill = "Group")#图注标题
gene <- rownames(cor_matrix) %>% as.data.frame() %>%
  mutate(group=rep(c("G1","G2","G3"),
                   times=c(4,4,3))) %>%
  mutate(p="Gene")%>%
  ggplot(aes(p,.,fill=group))+
  geom_tile() +
  scale_y_discrete(position="right") +#用于设置 y 轴的刻度,在右侧
  theme_minimal()+xlab(NULL) + ylab(NULL) +
  theme(axis.text.y = element_blank(),
        axis.text.x =element_text(
          angle =90,hjust =0.5,vjust = 0.5))+
  labs(fill = "Gene")
#用ggtree做聚类
library(ggtree)
p <- cor_matrix %>% scale(center = T) %>% as.data.frame()
phr <- hclust(dist(p)) %>%
  ggtree(layout="rectangular",branch.length="none")#对行进行聚类
phc <- hclust(dist(t(p))) %>%
  ggtree() + layout_dendrogram()#对列进行聚类
#画热图并将以上信息添加进去:
library(aplot)
pic1<-ggplot(data = cor_data, aes(x = Var1, y = Var2, fill = value))#热图绘制
pic2 <- pic1+geom_raster()+scale_fill_gradient2(low="#003366", high="#990033", mid="white")+
  geom_tile()+theme_minimal()+
  theme(axis.text.x =element_text(angle =90,hjust =0.5,vjust = 0.5))+#x周标签逆时针旋转90度,中心对齐
  xlab(NULL) + ylab(NULL)
#组合
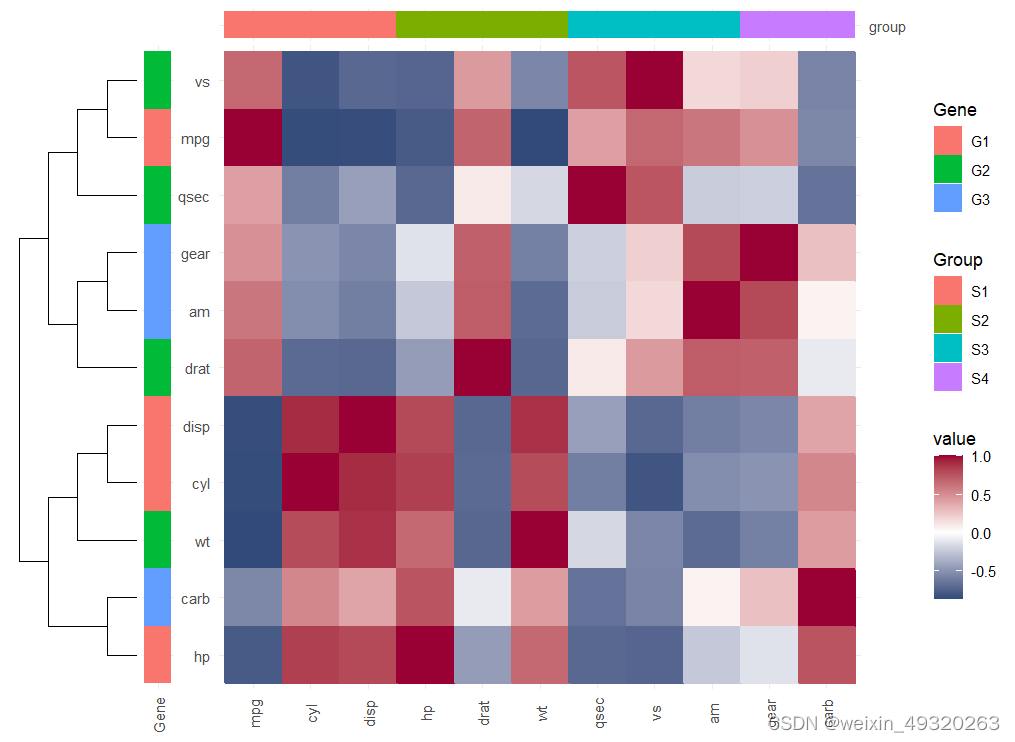
pic2 %>%
  insert_top(group, height = .05)%>%
  insert_left(gene, width = .05)%>%
  insert_left(phr,width=.2)
###简单热图###

###修饰热图###
1、

2、

3、

4、

5、
