资源下载:https://www.jsdelivr.com/package/npm/echarts
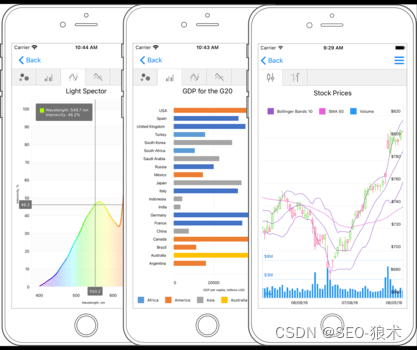
效果图:

借鉴资源:echarts 如何绘制三维 3D 立体柱状图 - 简书
代码示例:
<!DOCTYPE html>
<head>
    <meta charset="utf-8">
    <title>ECharts</title>
</head>
<body>
<!-- 为ECharts准备一个具备大小(宽高)的Dom -->
<div id="main" style="width: 500px; height:300px;background-color:#7caeeb;border-radius:20px;padding-top: 10px  "></div>
<!-- ECharts单文件引入 -->
<script src="./echarts5.4.1.min.js"></script>
<script type="text/javascript">
    // 渲染平台资源数量统计图表
    renderStatisticsPlatform()
   function  renderStatisticsPlatform(){
       var myChart = echarts.init(document.getElementById("main"));
       var leftColor="#c7deeb";  //柱形左侧颜色
       var rightTopColor="#fefeff";//柱形右侧和顶部颜色
       var statisticsplatformData = [
            ["衬衫","羊毛衫","雪纺衫","裤子","高跟鞋","袜子"], //横坐标
            [500, 2000, 4000, 1014, 6540, 250] //纵坐标
       ];
       myChart.setOption({
           title: {
               text: 'IT人的工作指南',
               //subtext: 'Example in MetricsG',
               left: 'center',
               textStyle: {
                   fontSize: 20 ,// 让字体变大
                   fontFamily:'MicrosoftYaHei-Bold, MicrosoftYaHei',
                   fontWeight:'bold',
                   color:'#FFFFFF'
               }
           },
            tooltip: {
                trigger: "item"
            },
            grid: {
                top: "15%",
                left: "8%",
                right: "12%",
                bottom: "15%",
                containLabel: true
            },
            xAxis: {
                type : 'category',
                data: statisticsplatformData[0],
                splitLine: {
                    show: false
                },
                axisTick: {
                    show: false
                },
                axisLine: {
                    symbol: ['none'],
                    symbolSize: [10, 17],
                    lineStyle: {
                        color: '#FFF',
                        //width: 0, //  改变坐标线的宽,使其不展现
                    },
                },
                offset:8,
                axisLabel: {
                    //调整x轴的lable
                    textStyle: {
                        fontSize: 11 ,// 让字体变大
                        fontFamily:'MicrosoftYaHei-Bold, MicrosoftYaHei',
                        fontWeight:'bold',
                        color:'#FFFFFF'
                    }
                }
            },
            yAxis: {
                splitLine: {    //刻度线
                    show: false,
                },
                splitArea:{     //柱状图后面的背景色
                    show:false,
                },
                axisTick: {
                    show: false
                },
                axisLabel: {
                    show: true,
                    color: '#ffffff',
                    fontSize: 12 // 字体大小
                },
                axisLine: {
                    symbol: ['none'],
                    symbolSize: [15, 17],
                    lineStyle: {
                        color: 'rgba(0 0 0 0)',
                        width: 0 //  改变坐标线的颜色
                    }
                }
            },
            axisPointer: {
                show: false,
                link: {xAxisIndex: 'all'},
                type: 'shadow' ,
                label: {
                    backgroundColor: '#777'
                }
            },
            series: [
                {
                    name: "资源数量统计",
                    type: "bar",
                    showSymbol: false,
                    hoverAnimation: false,
                    data: statisticsplatformData[1],
                    barWidth: 10, //柱图宽度
                    itemStyle: { //左面
                        normal: {
                            color:function(params) {
                                let colorList = [leftColor];
                                return colorList[0];
                            },
                            barBorderRadius:[4,0,0,100],
                        }
                    }
                },{
                    name:'资源数量统计',
                    tooltip:{
                        show:true
                    },
                    type: 'bar',
                    barWidth:10,
                    itemStyle:{       //右面
                        normal:{
                            color:function(params) {
                                let colorList = [rightTopColor];
                                return colorList[0];
                            },
                            borderWidth:0.1,
                            barBorderRadius:[0,5,100,0]
                        }
                    },
                    data: statisticsplatformData[1],
                    barGap:0
                },{
                    name:'b',
                    tooltip:{
                        show:false
                    },
                    type: 'pictorialBar',
                    itemStyle: {  //顶部
                        normal: {
                            color:function(params) {
                                let colorList = [rightTopColor];
                                return colorList[0];
                            },
                            borderColor:'#000',
                            borderWidth:0.1,
                            label: {
                                show: true, //开启显示
                                position: 'top', //在上方显示
                                textStyle: { //数值样式
                                    color :'#FFFFFF',
                                    fontSize: 14,
                                    fontFamily:'微软雅黑',
                                },
                                offset:[0,-2]
                            }
                        }
                    },
                    symbol: 'diamond',
                    symbolSize: ['20.5','13'],
                    symbolOffset:[0,'-38%'],
                    symbolPosition: 'end',
                    data: statisticsplatformData[1],
                    z:3
                },{
                    name:'d',
                    tooltip:{
                        show:false
                    },
                    type: 'pictorialBar',
                    itemStyle: {  //底部
                        normal: {
                            color:function(params) {
                                let colorList = [rightTopColor];
                                return colorList[0];
                            },
                            borderColor:'#000',
                            borderWidth:0.1,
                            label: {
                                show: false, //开启显示
                                position: 'top', //在上方显示
                                textStyle: { //数值样式
                                    color :'#FFFFFF',
                                    fontSize: 14,
                                    fontFamily:'微软雅黑',
                                },
                                offset:[0,-2]
                            }
                        }
                    },
                    symbol: 'diamond',
                    symbolSize: ['20.5','17'],
                    symbolOffset:[0,'2.5'],
                    symbolPosition: 'start',
                    data: statisticsplatformData[1],
                    z:0
                }
            ]
        })
    }
</script>


</body>