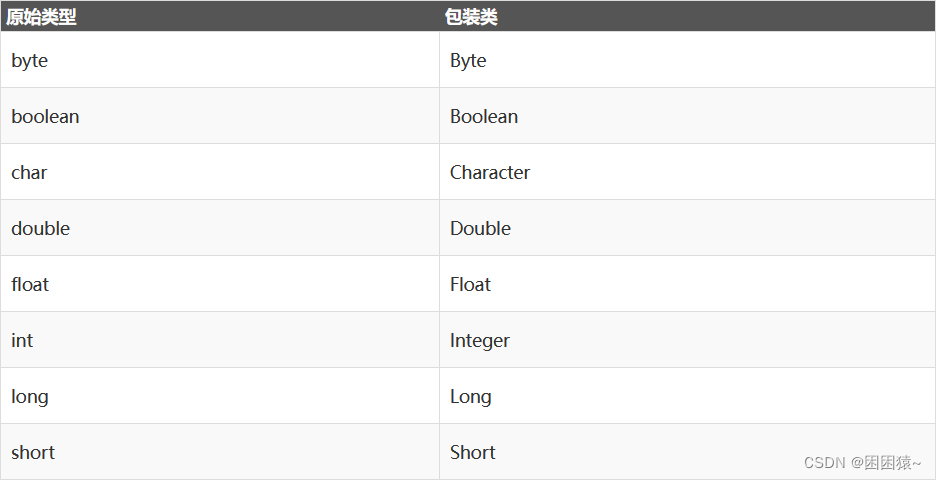
效果

代码:index。vue
      <div class="riskStatisticsBox">
        <div class="titleBox">风险统计</div>
        <div class="contentBox">
          <div class="selectGroupBox">
            <div class="categoryBox">
              <span>风险类别: </span>
              <a-select
                v-model:value="RiskPointType"
                @change="changePointType"
                :allowClear="true"
              >
                <a-select-option value="Device">设备设施</a-select-option>
                <a-select-option value="Operation">作业活动</a-select-option>
                <a-select-option value="ProcessNode">工业节点</a-select-option>
              </a-select>
            </div>
            <div class="gradeBox">
              <span>风险等级: </span>
              <a-select
                v-model:value="RiskLevelType"
                @change="changeLeveType"
                :allowClear="true"
              >
                <a-select-option value="">全部</a-select-option>
                <a-select-option value="ExtremeRisk">重大风险</a-select-option>
                <a-select-option value="LargerRisk">较大风险</a-select-option>
                <a-select-option value="GeneralRisk">一般风险</a-select-option>
                <a-select-option value="LowRisk">低风险</a-select-option>
              </a-select>
            </div>
          </div>
          <div :class="!piedata.length ? 'emptyBox' : ''">
            <riskStatistics
              :piedata="piedata"
              v-if="piedata.length"
              :allCounts="allCounts"
            ></riskStatistics>
            <a-empty
              v-else
              :image="Empty.PRESENTED_IMAGE_SIMPLE"
              class="ant-empty-normal"
            />
          </div>
        </div>
      </div>
import { message, Modal, Empty } from "ant-design-vue";
import riskStatistics from "./components/riskStatistics.vue";
const getDataRisk = () => {
  getRiskStatistics({
    RiskPointType: RiskPointType.value,
    RiskLevelType: RiskLevelType.value,
  })
    .then((res) => {
      piedata.value = res.map(function (item) {
        return {
          name: item.RiskPointStatisticGroupName,
          value:
            RiskLevelType.value == "ExtremeRisk"
              ? item.ExtremeCount
              : RiskLevelType.value == "LargerRisk"
              ? item.LargerCount
              : RiskLevelType.value == "GeneralRisk"
              ? item.GeneralCount
              : RiskLevelType.value == "LowRisk"
              ? item.LowCount
              : item.TotalCount,
        };
      });
      allCounts.value = res.reduce((prev, cur) => {
        return (
          prev +
          Number(
            RiskLevelType.value == "ExtremeRisk"
              ? cur.ExtremeCount
              : RiskLevelType.value == "LargerRisk"
              ? cur.LargerCount
              : RiskLevelType.value == "GeneralRisk"
              ? cur.GeneralCount
              : RiskLevelType.value == "LowRisk"
              ? cur.LowCount
              : cur.TotalCount
          )
        );
      }, 0);
    })
    .catch((err) => {
      console.log(err);
    });
};
onMounted(async () => {
getDataRisk();
});riskStatistics.vue
<template>
  <div :id="id" :ref="id" style="height: 400px; padding: 10px"></div>
</template>
<script setup>
import * as echarts from "echarts";
import {
  defineComponent,
  onMounted,
  reactive,
  ref,
  nextTick,
  watch,
  onUnmounted,
} from "vue";
import moment from "moment";
// import resize from './resizeEchart.js'
const props = defineProps({
  id: {
    type: String,
    default: "myCharts",
  },
  allCounts: {
    type: Number,
    default: 0,
  },
  optionProp: {
    type: Object,
    default: () => {
      return {};
    },
  },
  piedata: {
    type: Array,
    default: () => [],
  },
});
onUnmounted(() => {
  myChart.value = null;
});
const myChart = ref(null);
const option = ref({
  color: [
    "#3dc76e",
    "#5494f2",
    "#f57878",
    "#3dc76e",
    "#bd87eb",
    "#62e9de",
    "#fc9065",
    "#fdd751",
    "#4cc5f4",
    "#bbcce4",
    "#8b9cf0",
    "#ebeaaa",
    "#bba0c1",
  ],
  legend: {
    type: "scroll",
  },
  tooltip: {
    trigger: "item",
    confine: true,
  },
  grid: {
    left: "2%",
    right: "4%",
    bottom: "8%",
    containLabel: true,
  },
  series: [
    {
      name: "",
      type: "pie",
      center: ["55%", "65%"],
      radius: ["40%", "65%"],
      avoidLabelOverlap: false,
      itemStyle: {
        borderRadius: 10,
        borderColor: "#fff",
        borderWidth: 2,
      },
      emphasis: {
        label: {
          show: true,
        },
      },
      data: [],
    },
  ],
});
function getData(piedata) {
  const option = {
    title: {
      text: "总数量",
      subtext: props.allCounts?props.allCounts:0,
      left: "49%",
      top: "45%",
      textAlign: "center",
      subtextStyle: {
        fontSize: 16,
        align: "center",
      },
    },
    color: [
      "#3dc76e",
      "#5494f2",
      "#f57878",
      "#3dc76e",
      "#bd87eb",
      "#62e9de",
      "#fc9065",
      "#fdd751",
      "#4cc5f4",
      "#bbcce4",
      "#8b9cf0",
      "#ebeaaa",
      "#bba0c1",
    ],
    legend: {
      type: "scroll",
      pageIconSize: 8,
       bottom: 'bottom'
    },
    tooltip: {
      trigger: "item",
      confine: true,
    },
    // grid: {
    //   left: "2%",
    //   right: "4%",
    //   bottom: "8%",
    //   containLabel: true,
    // },
    series: [
      {
        name: "",
        type: "pie",
        radius: ["70%", "55%"],
        center: ["50%", "50%"],
        avoidLabelOverlap: true,
        itemStyle: {
          borderRadius: 10,
          borderColor: "#fff",
          borderWidth: 2,
        },
        emphasis: {
          label: {
            show: true,
          },
        },
        data: piedata,
      },
    ],
  };
  return option;
}
function draw(piedata) {
  myChart.value && myChart.value.setOption(getData(piedata));
}
watch(
  () => props.piedata,
  (val, oldVal) => {
    nextTick(() => {
      if (!myChart.value) {
        const chartBox = document.getElementById(props.id);
        myChart.value = echarts.init(chartBox);
        myChart.value.resize();
      }
      draw(val);
    });
  },
  { deep: true, immediate: true }
);
</script>