Pyecharts是一个用于生成 Echarts 图表的 Python 库。Echarts 是一个基于 JavaScript 的数据可视化库,提供了丰富的图表类型和交互功能。通过 Pyecharts,你可以使用 Python 代码生成各种类型的 Echarts 图表,例如折线图、柱状图、饼图、散点图等。
Pyecharts 提供了许多方便的 API 和方法,可以让你轻松地创建和定制自己的图表。以下是一些常用的 Pyecharts 方法:
Bar():用于创建柱状图
Line():用于创建折线图
Pie():用于创建饼图
Scatter():用于创建散点图
Option():用于设置图表选项
render():用于生成 HTML 文件并打开图表

01百分比源码如下
from pyecharts import options as opts
from pyecharts.charts import Bar
from pyecharts.commons.utils import JsCode
from pyecharts.globals import ThemeType

#两组数据
list2 = [
    {"value": 12, "percent": 12 / (12 + 3)},
    {"value": 23, "percent": 23 / (23 + 21)},
    {"value": 33, "percent": 33 / (33 + 5)},
    {"value": 3, "percent": 3 / (3 + 52)},
    {"value": 33, "percent": 33 / (33 + 43)},
]

list3 = [
    {"value": 3, "percent": 3 / (12 + 3)},
    {"value": 21, "percent": 21 / (23 + 21)},
    {"value": 5, "percent": 5 / (33 + 5)},
    {"value": 52, "percent": 52 / (3 + 52)},
    {"value": 43, "percent": 43 / (33 + 43)},
]

c = (
    Bar(init_opts=opts.InitOpts(theme=ThemeType.LIGHT))
    .add_xaxis([1, 2, 3, 4, 5])
    .add_yaxis("product1", list2, stack="stack1", category_gap="50%")
    .add_yaxis("product2", list3, stack="stack1", category_gap="50%")
    .set_series_opts(
        label_opts=opts.LabelOpts(
            position="right",
            formatter=JsCode(
                "function(x){return Number(x.data.percent * 100).toFixed() + '%';}"
            ),
        )
    )
    .render("stack_bar_percent.html")
)
02源码示例
from pyecharts import options as opts
from pyecharts.charts import Bar

c = (
    Bar()
    .add_xaxis(
        [
            "名字很长的X轴标签1",
            "名字很长的X轴标签2",
            "名字很长的X轴标签3",
            "名字很长的X轴标签4",
            "名字很长的X轴标签5",
            "名字很长的X轴标签6",
        ]
    )
    .add_yaxis("商家A", [10, 20, 30, 40, 50, 40])
    .add_yaxis("商家B", [20, 10, 40, 30, 40, 50])
    .set_global_opts(
        xaxis_opts=opts.AxisOpts(axislabel_opts=opts.LabelOpts(rotate=-15)),
        title_opts=opts.TitleOpts(title="Bar-旋转X轴标签", subtitle="解决标签名字过长的问题"),
    )
    .render("bar_rotate_xaxis_label.html")
)
03源码示例
import pyecharts.options as opts
from pyecharts.charts import Bar, Line

x_data = ["1月", "2月", "3月", "4月", "5月", "6月", "7月", "8月", "9月", "10月", "11月", "12月"]

bar = (
    Bar()
    .add_xaxis(xaxis_data=x_data)
    .add_yaxis(
        series_name="蒸发量",
        y_axis=[2.0, 4.9, 7.0, 23.2, 25.6, 76.7, 135.6, 162.2, 32.6, 20.0, 6.4, 3.3],
        label_opts=opts.LabelOpts(is_show=False),
    )
    .add_yaxis(
        series_name="降水量",
        y_axis=[2.6, 5.9, 9.0, 26.4, 28.7, 70.7, 175.6, 182.2, 48.7, 18.8, 6.0, 2.3],
        label_opts=opts.LabelOpts(is_show=False),
    )
    .extend_axis(
        yaxis=opts.AxisOpts(
            name="温度",
            type_="value",
            min_=0,
            max_=25,
            interval=5,
            axislabel_opts=opts.LabelOpts(formatter="{value} °C"),
        )
    )
    .set_global_opts(
        tooltip_opts=opts.TooltipOpts(
            is_show=True, trigger="axis", axis_pointer_type="cross"
        ),
        xaxis_opts=opts.AxisOpts(
            type_="category",
            axispointer_opts=opts.AxisPointerOpts(is_show=True, type_="shadow"),
        ),
        yaxis_opts=opts.AxisOpts(
            name="水量",
            type_="value",
            min_=0,
            max_=250,
            interval=50,
            axislabel_opts=opts.LabelOpts(formatter="{value} ml"),
            axistick_opts=opts.AxisTickOpts(is_show=True),
            splitline_opts=opts.SplitLineOpts(is_show=True),
        ),
    )
)

line = (
    Line()
    .add_xaxis(xaxis_data=x_data)
    .add_yaxis(
        series_name="平均温度",
        yaxis_index=1,
        y_axis=[2.0, 2.2, 3.3, 4.5, 6.3, 10.2, 20.3, 23.4, 23.0, 16.5, 12.0, 6.2],
        label_opts=opts.LabelOpts(is_show=False),
    )
)

bar.overlap(line).render("mixed_bar_and_line.html")
04示例源码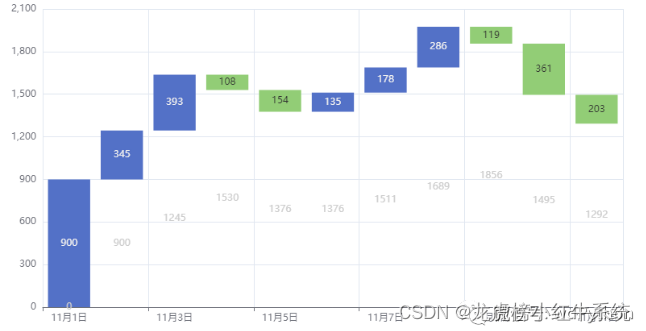
from pyecharts.charts import Bar
from pyecharts import options as opts

x_data = [f"11月{str(i)}日" for i in range(1, 12)]
y_total = [0, 900, 1245, 1530, 1376, 1376, 1511, 1689, 1856, 1495, 1292]
y_in = [900, 345, 393, "-", "-", 135, 178, 286, "-", "-", "-"]
y_out = ["-", "-", "-", 108, 154, "-", "-", "-", 119, 361, 203]


bar = (
    Bar()
    .add_xaxis(xaxis_data=x_data)
    .add_yaxis(
        series_name="",
        y_axis=y_total,
        stack="总量",
        itemstyle_opts=opts.ItemStyleOpts(color="rgba(0,0,0,0)"),
    )
    .add_yaxis(series_name="收入", y_axis=y_in, stack="总量")
    .add_yaxis(series_name="支出", y_axis=y_out, stack="总量")
    .set_global_opts(yaxis_opts=opts.AxisOpts(type_="value"))
    .render("bar_waterfall_plot.html")
)
