1. 函数功能
成一个画布和若干子区。
2. 函数语法
matplotlib.pyplot.subplots(nrows=1, ncols=1, *, sharex=False, sharey=False, squeeze=True, subplot_kw=None,
gridspec_kw=None, **fig_kw)
3. 函数参数与示例
| 参数 | 含义 |
|---|---|
| nrows, ncols | 画布被分成的行、列数 |
| squeeze | 布尔值,是否压缩维度,默认取值为True:当取值为True时,1. 若只创建一个子区,则返回子区是一个标量;2. 若是N1或者1M个子区,则返回1维子区对象;3. 若为N*M(N>1且M>1)则返回二维数组。当取值为False时,总是返回二维数组 |
| width_ratios | 每一列的相对宽度,默认每列宽度相等,可以指定宽度: width_ratios[i] / sum(width_ratios) |
| height_ratios | 每一行的相对高度,默认每列高度相等,可以指定宽度: height_ratios[i] / sum(height_ratios) |
| subplot_kw | 定义子区属性的关键字参数,如:绘图区域的背景颜色: facecolor |
| gridspec_kw | |
| **fig_kw | 传递给figure对象的其他关键字 |
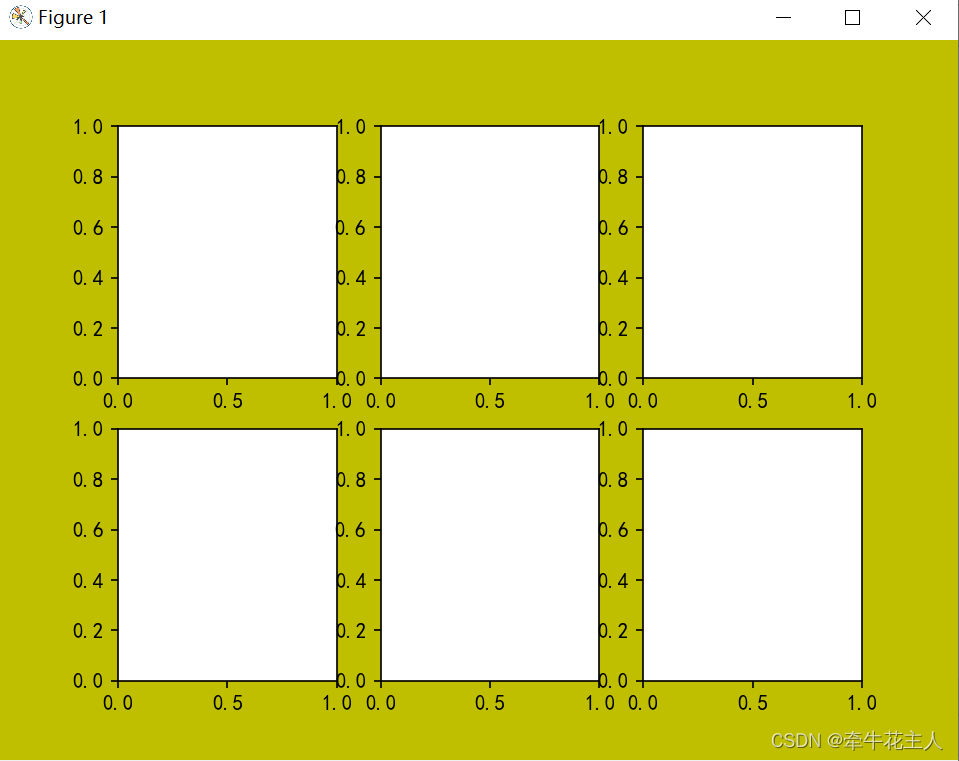
3.1 nrows与ncols
import matplotlib.pyplot as plt
import numpy as np
import matplotlib as mpl

mpl.rcParams['font.sans-serif'] = ['KaiTi']
mpl.rcParams['axes.unicode_minus'] = False

fig, ax = plt.subplots(2, 3, facecolor='y', alpha=0.3)
plt.show()
3.2 生成画布与1个绘图区域
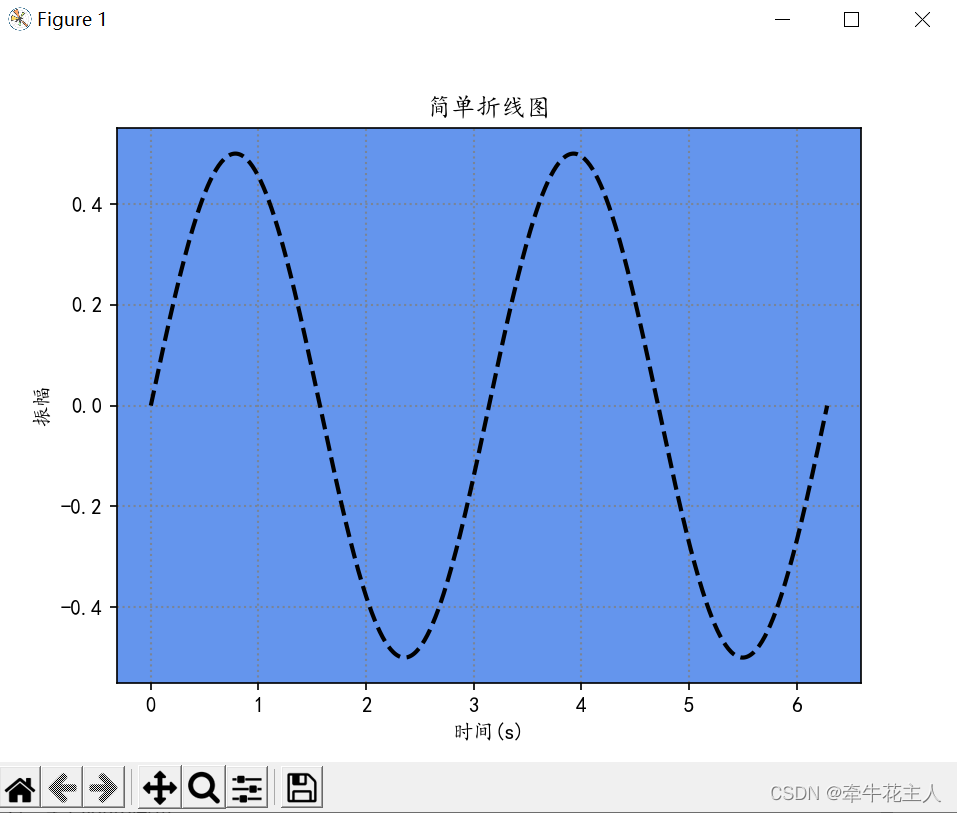
3.2.1 squeeze=False
当squeeze参数取值为False,不压缩维度时,虽然只有一个绘图区域,绘图区域ax的返回结果依然为二维数组,因此,设定绘图区域的内容需要使用行列索引
import matplotlib.pyplot as plt
import numpy as np
import matplotlib as mpl

mpl.rcParams['font.sans-serif'] = ['KaiTi']
mpl.rcParams['axes.unicode_minus'] = False

x = np.linspace(0, 2 * np.pi, 500)
y = np.sin(x) * np.cos(x)

fig, ax = plt.subplots(1, 1, squeeze=False,
                       subplot_kw=dict(facecolor='cornflowerblue', alpha=0.3))
ax[0,0].plot(x, y, ls='--', color='k', lw=2)
ax[0,0].set_xlabel('时间(s)')
ax[0,0].set_ylabel('振幅')
ax[0,0].set_title('简单折线图')
ax[0,0].grid(ls=':', lw=1, color='gray', alpha=0.8)
plt.show()
3.2.2 squeeze=True
当squeeze参数取值为True,压缩数组维度,产生一个绘图区域时返回一个标量,此时可以使用ax
import matplotlib.pyplot as plt
import numpy as np
import matplotlib as mpl

mpl.rcParams['font.sans-serif'] = ['KaiTi']
mpl.rcParams['axes.unicode_minus'] = False

x = np.linspace(0, 2 * np.pi, 500)
y = np.sin(x) * np.cos(x)

fig, ax = plt.subplots(1, 1, squeeze=True,
                       subplot_kw=dict(facecolor='cornflowerblue', alpha=0.3))
ax.plot(x, y, ls='--', color='k', lw=2)
ax.set_xlabel('时间(s)')
ax.set_ylabel('振幅')
ax.set_title('简单折线图')
ax.grid(ls=':', lw=1, color='gray', alpha=0.8)
plt.show()
3.3 生成画布与N1个子区或1M个子区
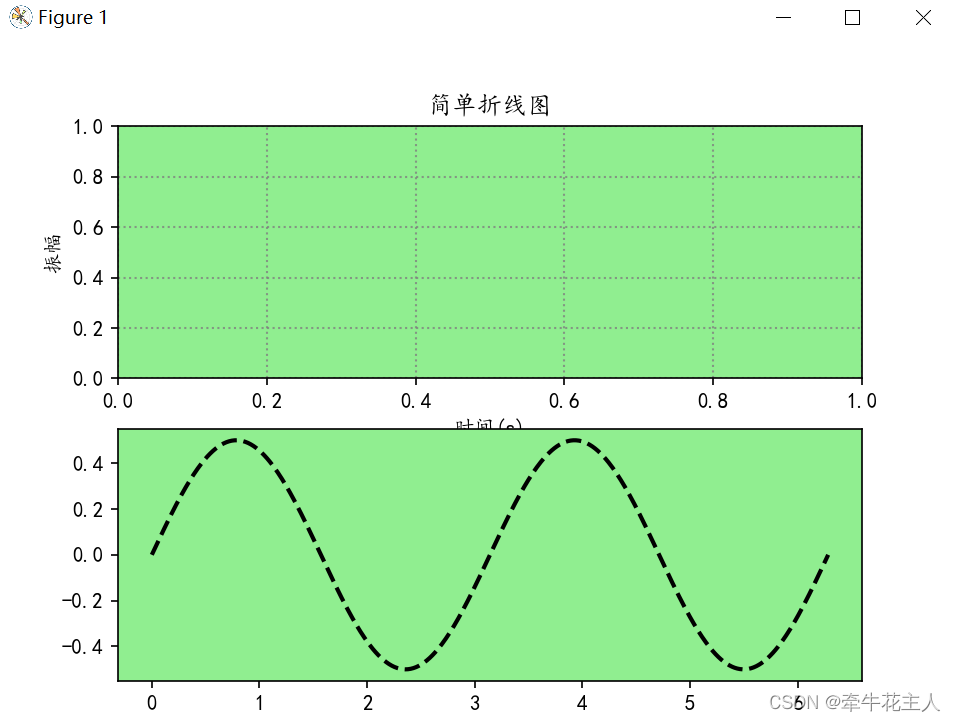
3.3.1 N*1个子区
当squeeze取值为False时,ax返回二维数组;当squeeze取值为True时,ax返回一维数组。
import matplotlib.pyplot as plt
import numpy as np
import matplotlib as mpl

mpl.rcParams['font.sans-serif'] = ['KaiTi']
mpl.rcParams['axes.unicode_minus'] = False

x = np.linspace(0, 2 * np.pi, 500)
y = np.sin(x) * np.cos(x)

fig, ax = plt.subplots(2, 1, squeeze=True,
                       subplot_kw=dict(facecolor='lightgreen', alpha=0.3))
ax[1].plot(x, y, ls='--', color='k', lw=2)
ax[0].set_xlabel('时间(s)')
ax[0].set_ylabel('振幅')
ax[0].set_title('简单折线图')
ax[0].grid(ls=':', lw=1, color='gray', alpha=0.8)
plt.show()
3.3.2 1*M个子区
import matplotlib.pyplot as plt
import numpy as np
import matplotlib as mpl

mpl.rcParams['font.sans-serif'] = ['KaiTi']
mpl.rcParams['axes.unicode_minus'] = False

x = np.linspace(0, 2 * np.pi, 500)
y = np.sin(x) * np.cos(x)
y1 = x
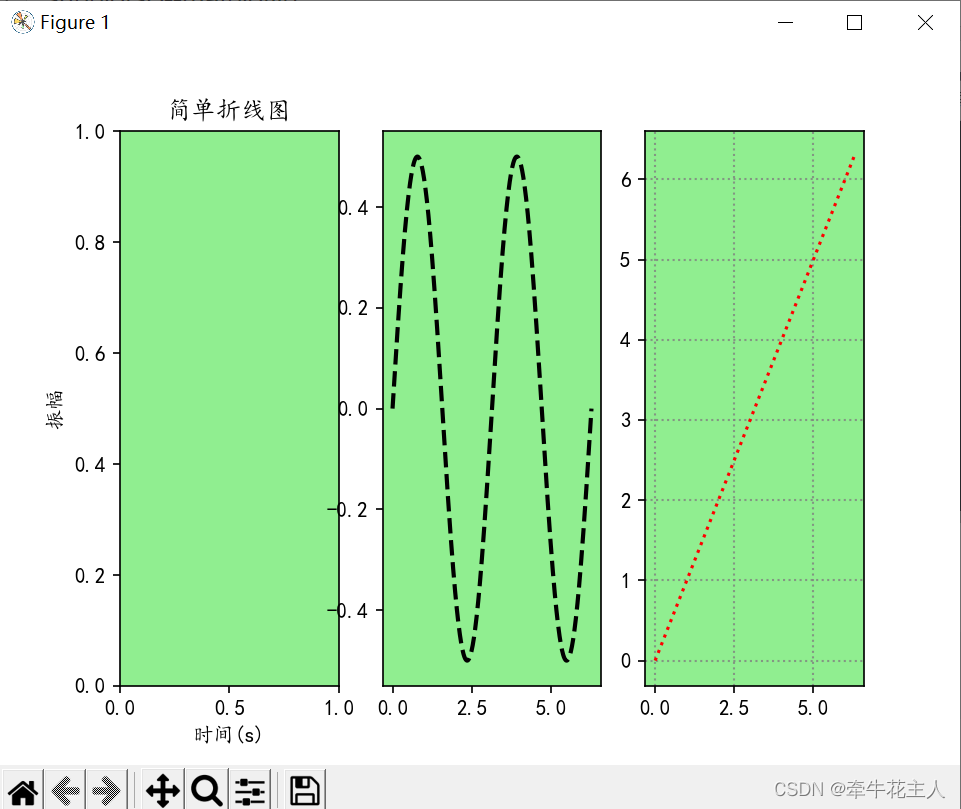
fig, ax = plt.subplots(1, 3, squeeze=True,
                       subplot_kw=dict(facecolor='lightgreen', alpha=0.3))
ax[1].plot(x, y, ls='--', color='k', lw=2)
ax[0].set_xlabel('时间(s)')
ax[0].set_ylabel('振幅')
ax[0].set_title('简单折线图')
ax[2].plot(x, y1, ls=':', c='r')
ax[2].grid(ls=':', lw=1, color='gray', alpha=0.8)
plt.show()
3.4 N*M个子区(N>1,M>1)
import matplotlib.pyplot as plt
import numpy as np
import matplotlib as mpl

mpl.rcParams['font.sans-serif'] = ['KaiTi']
mpl.rcParams['axes.unicode_minus'] = False

x = np.linspace(0, 2 * np.pi, 500)
y = np.sin(x) * np.cos(x)
y1 = x
y2 = x ** 2
y3 = np.tan(x)
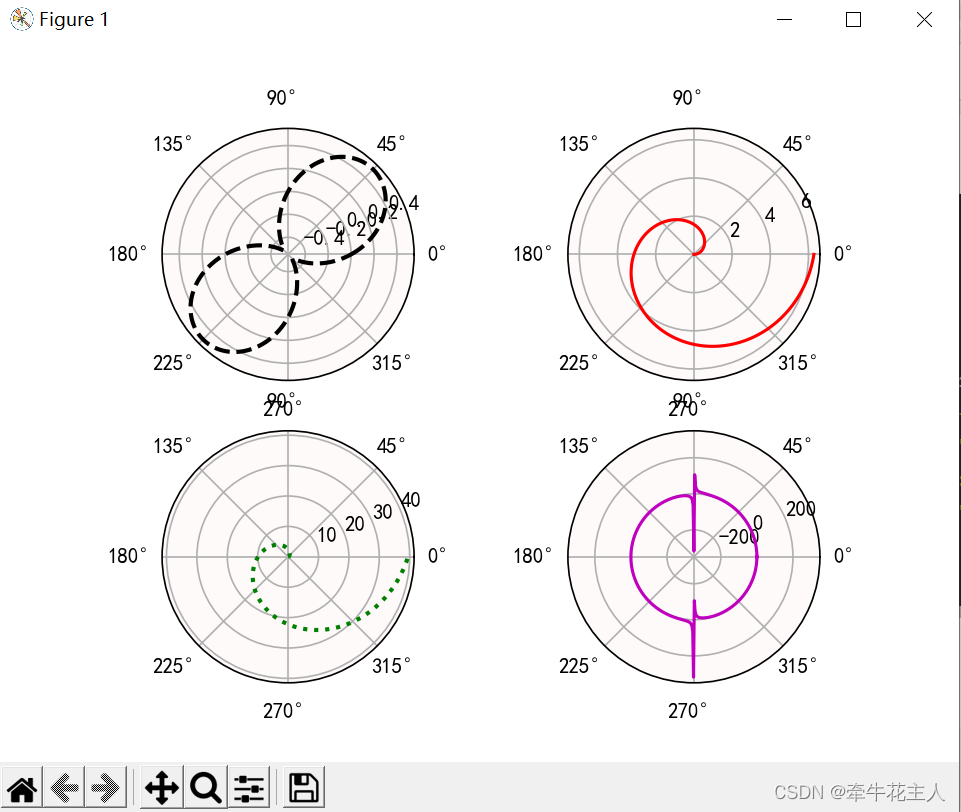
fig, ax = plt.subplots(2, 2, squeeze=False,
                       subplot_kw=dict(facecolor='snow', alpha=0.3, polar=True))
ax[0, 0].plot(x, y, ls='--', color='k', lw=2)
ax[0, 1].plot(x, y1, c='r')
ax[1, 0].plot(x, y2, ls=':', c='g', lw=2)
ax[1, 1].plot(x, y3, c='m')
plt.show()
3.5 sharex与sharey取值为布尔值
3.5.1 sharex与sharey均为False
当sharex=Fasle;sharey=False,每个子区的坐标轴均相互独立
import matplotlib.pyplot as plt
import numpy as np
import matplotlib as mpl

mpl.rcParams['font.sans-serif'] = ['KaiTi']
mpl.rcParams['axes.unicode_minus'] = False

x1 = np.linspace(0, 2 * np.pi, 500)
x = np.arange(0,10,0.5)
y = np.sin(x1) * np.cos(x1)
y1 = x1
y2 = x ** 2
y3 = np.tan(x)

fig, ax = plt.subplots(2, 2, sharex=False, sharey=False)
ax[0, 0].plot(x1, y, ls='--', color='k', lw=2)
ax[0, 1].plot(x1, y1, c='r')
ax[1, 0].plot(x, y2, ls=':', c='g', lw=2)
ax[1, 1].plot(x, y3, c='m')
plt.show()
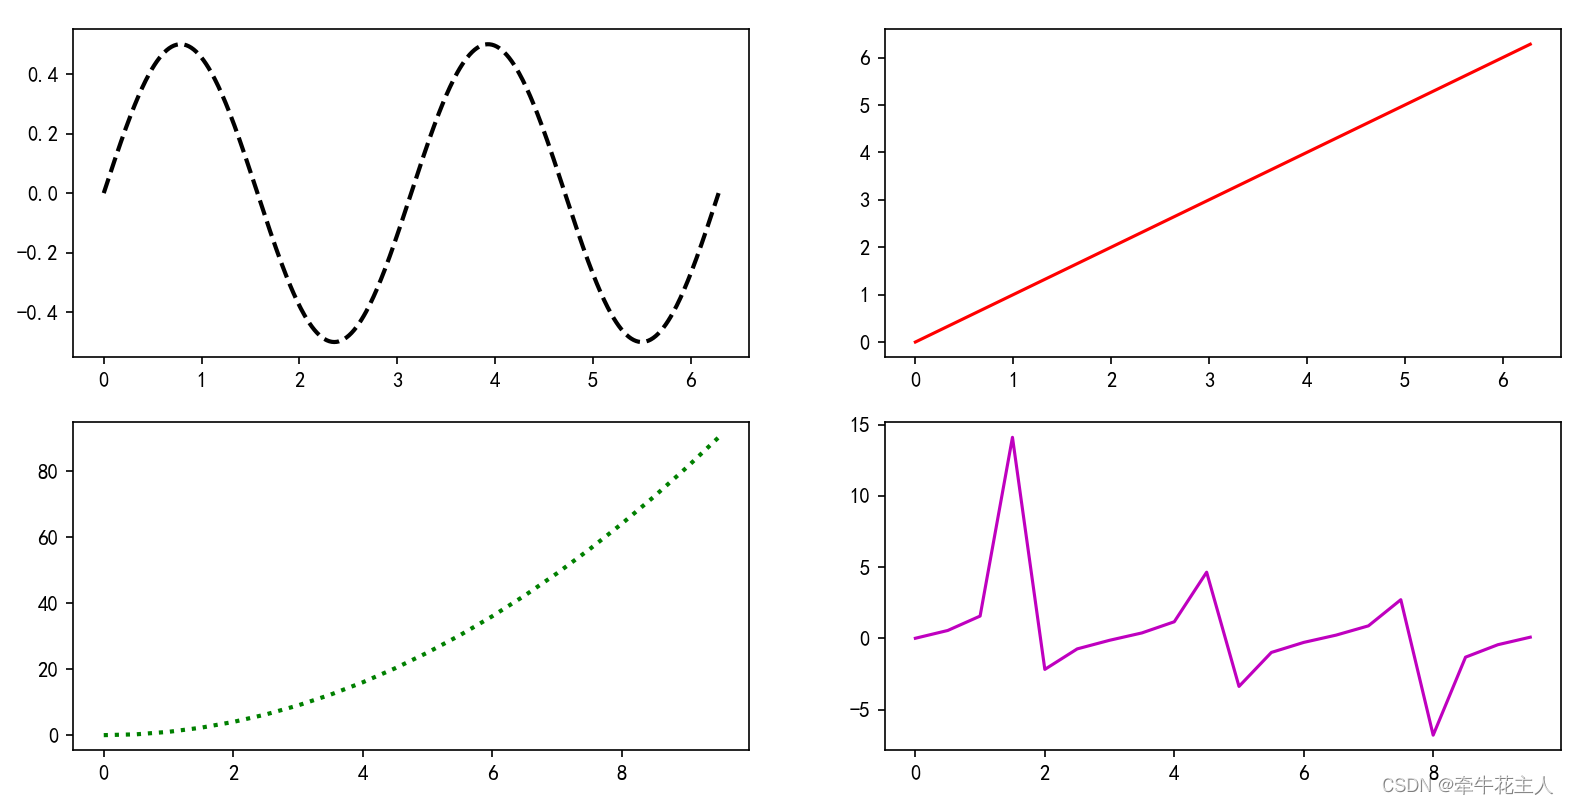
3.5.2 sharex=True,sharey=False
当sharex=True;sharey=False,每个子区共享x轴,每个子区的y轴相互独立
fig, ax = plt.subplots(2, 2, sharex=True, sharey=False)
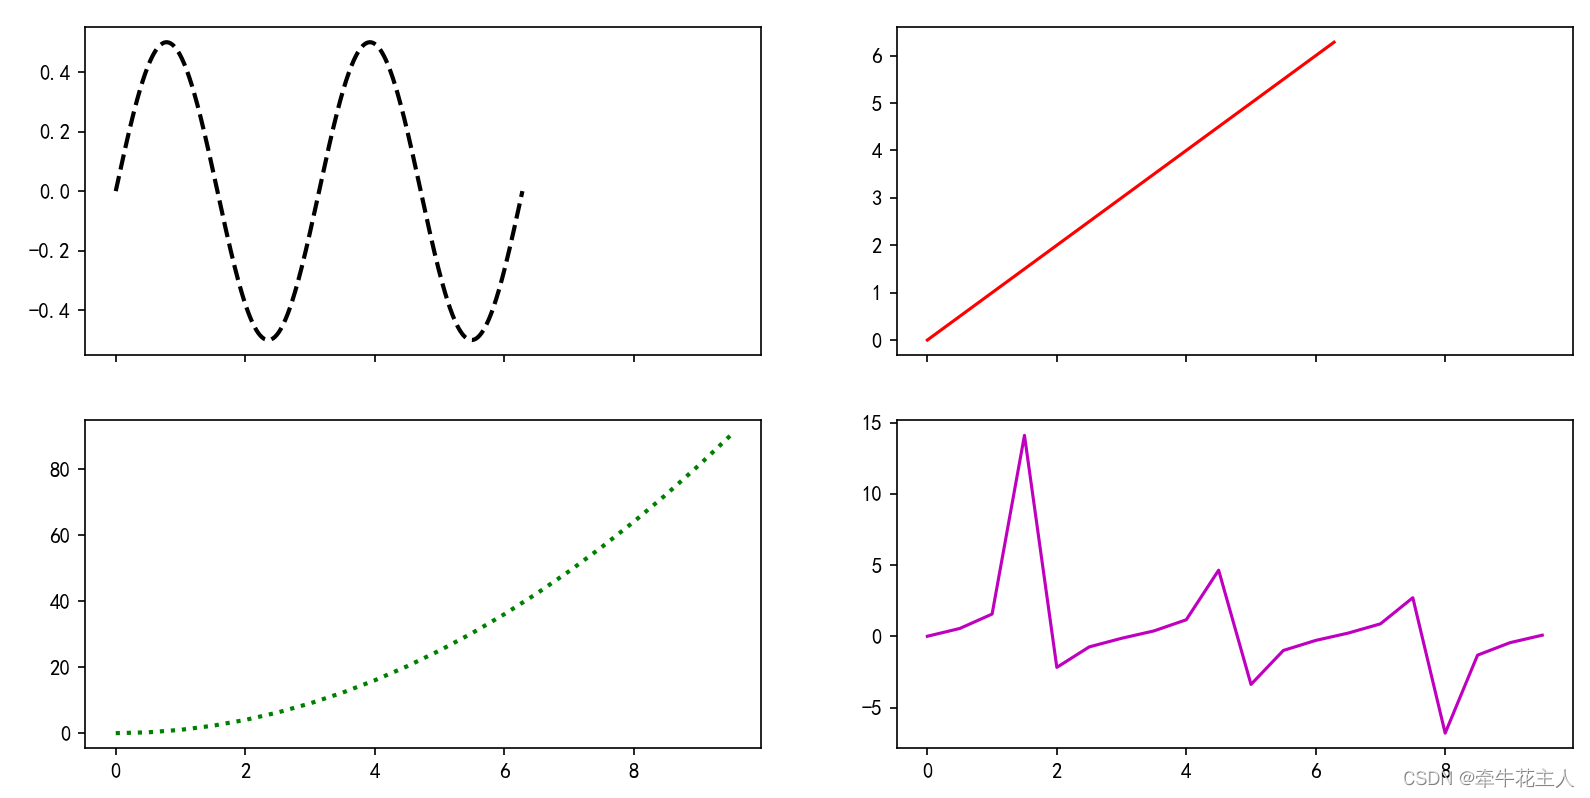
3.5.3 sharex=False,sharey=True
当sharex=False;sharey=TRUE,每个子区x轴刻度相互独立,所有子区共享y轴
fig, ax = plt.subplots(2, 2, sharex=False, sharey=True)
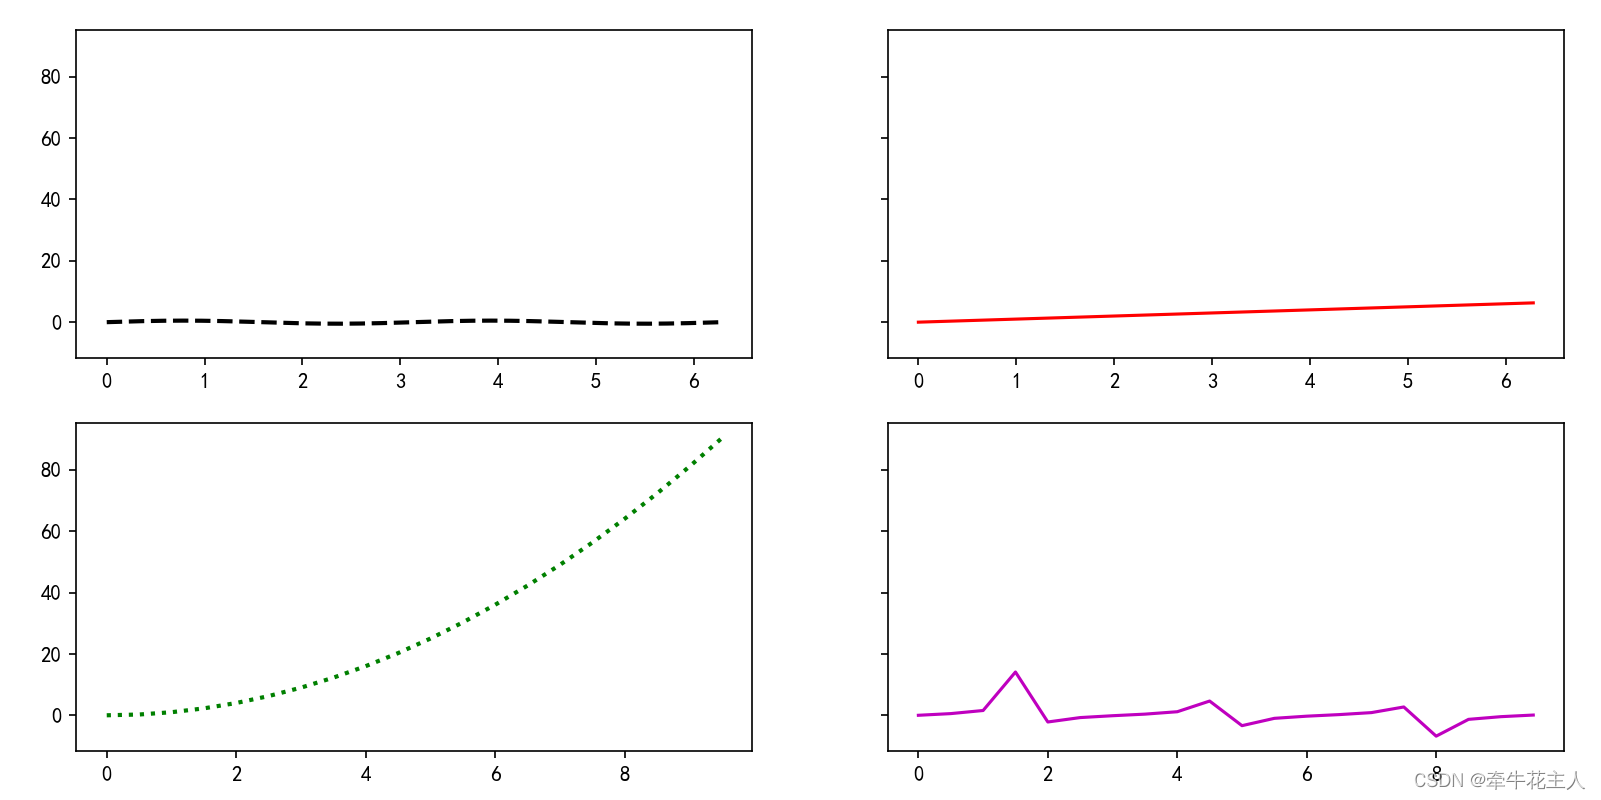
3.5.4 sharex=TRUE,sharey=True
当sharex=False;sharey=TRUE,每个子区共享x轴,每个子区共享y轴
fig, ax = plt.subplots(2, 2, sharex=True, sharey=True)
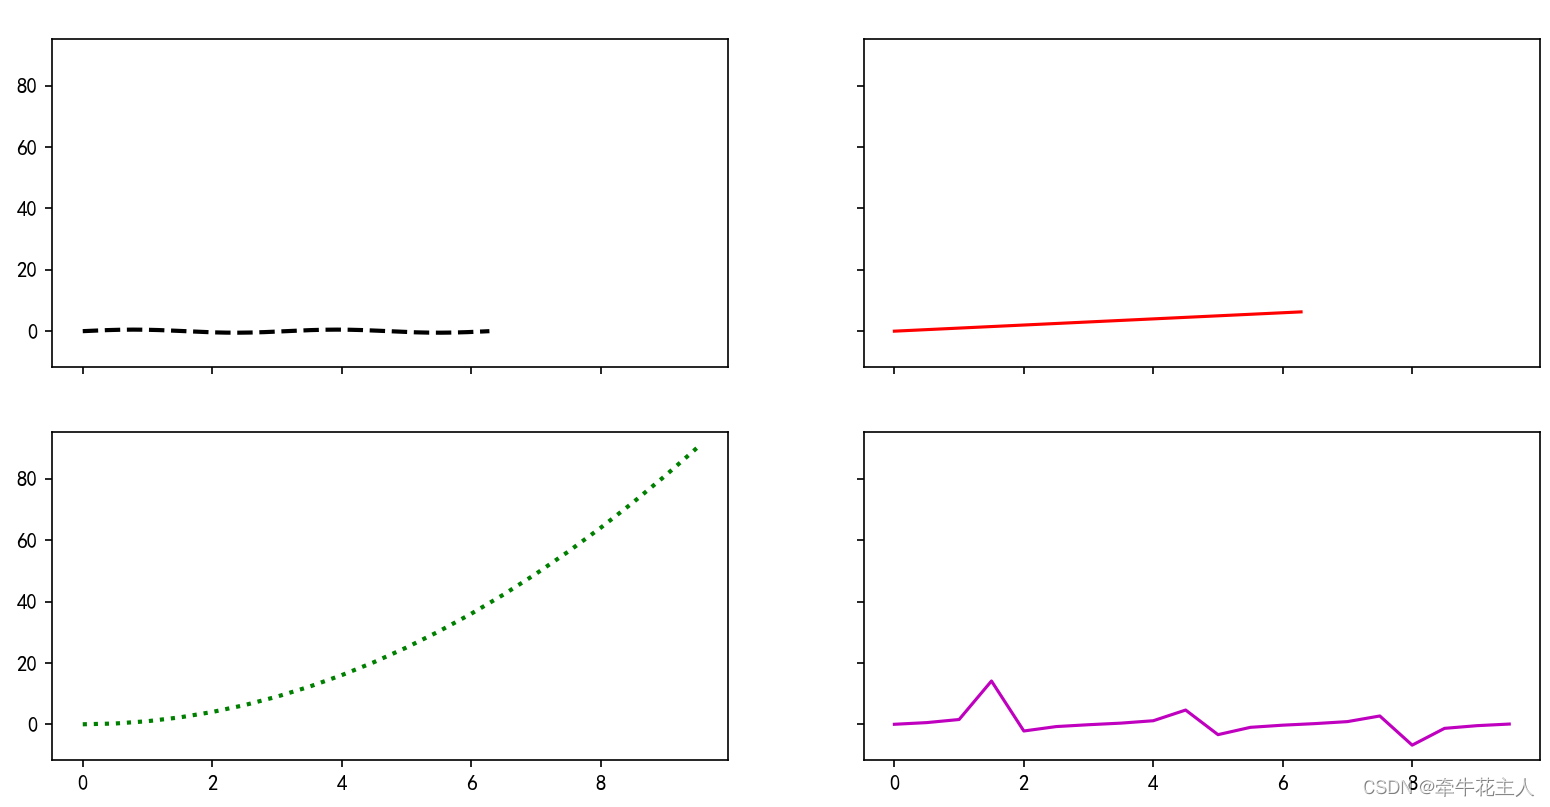
3.5 总结
| 取值 | 含义 |
|---|---|
| sharex=True, sharey=True | 所有子区共享相同的x轴与y轴 |
| sharex=True, sharey=False | 所有子区共享相同的x轴,每个子区使用各自独立的y轴 |
| sharex=False, sharey=True | 每个子区使用各自独立的x轴, 所有子区共享相同的y轴 |
| sharex=False, sharey=False | 每个子区均使用各自独立的x轴与y轴,默认情况 |
3.6 sharex与sharey取值为{‘none’, ‘all’, ‘row’, ‘col’}
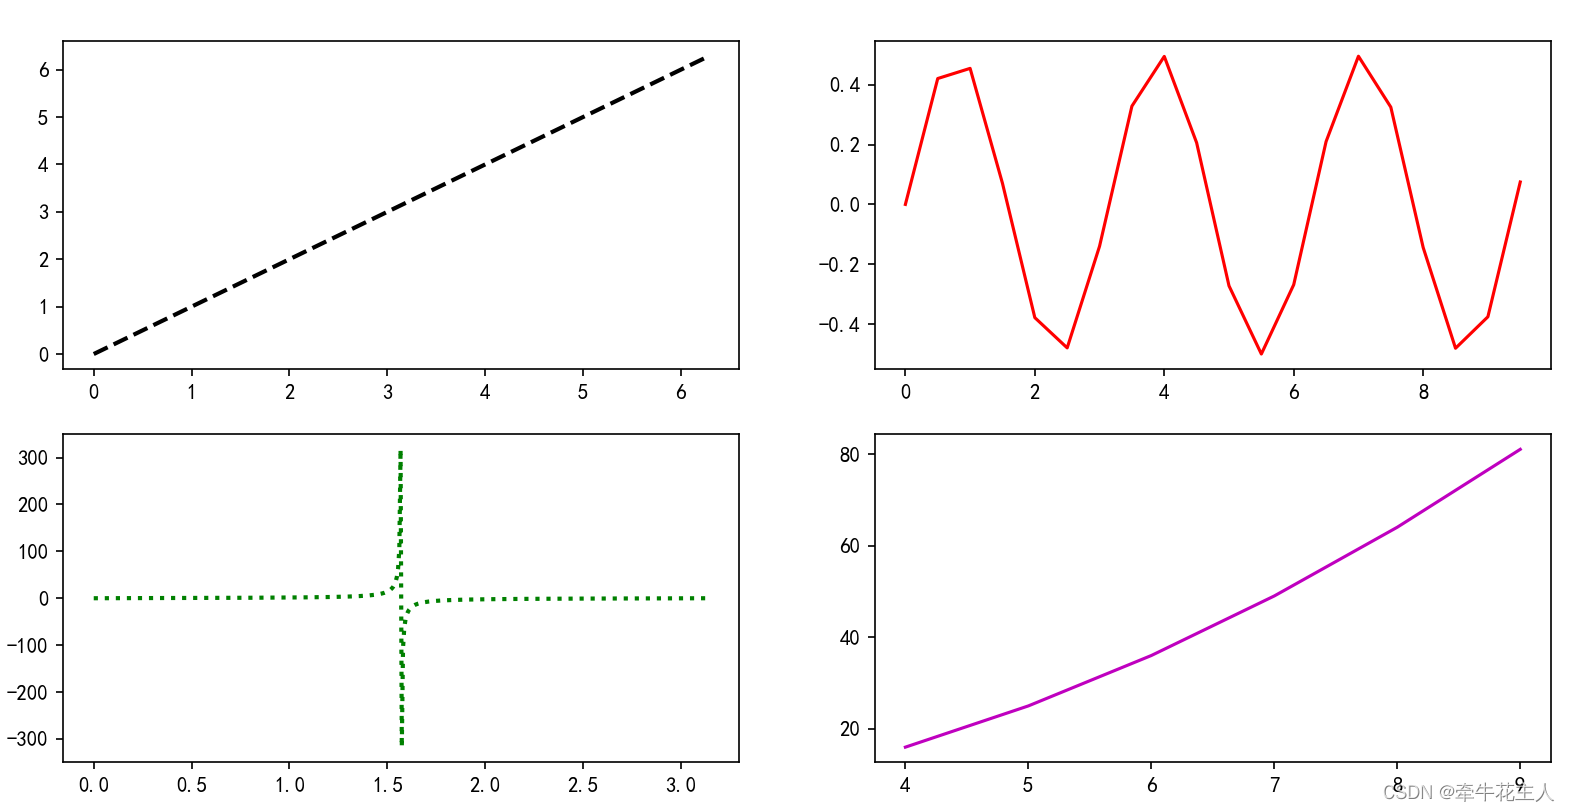
3.6.1 sharex=‘none’ 且 sharey=‘none’
这种情况下相当于sharex=False,sharey=Fasle;每个子区的坐标轴均相互独立
import matplotlib.pyplot as plt
import numpy as np
import matplotlib as mpl

mpl.rcParams['font.sans-serif'] = ['KaiTi']
mpl.rcParams['axes.unicode_minus'] = False

x1 = np.linspace(0, 2 * np.pi, 500)
y1 = x1
x2 = np.arange(0,10,0.5)
y2 = np.sin(x2) * np.cos(x2)
x3 = np.linspace(0,  np.pi, 500)
y3 = np.tan(x3)
x4 = np.arange(4,10,1)
y4 = x4**2

fig, ax = plt.subplots(2, 2, sharex='none', sharey='none')
ax[0, 0].plot(x1, y1, ls='--', color='k', lw=2)
ax[0, 1].plot(x2, y2, c='r')
ax[1, 0].plot(x3, y3, ls=':', c='g', lw=2)
ax[1, 1].plot(x4, y4, c='m')
plt.show()
3.6.2 sharex=‘all’ 且 sharey=‘none’
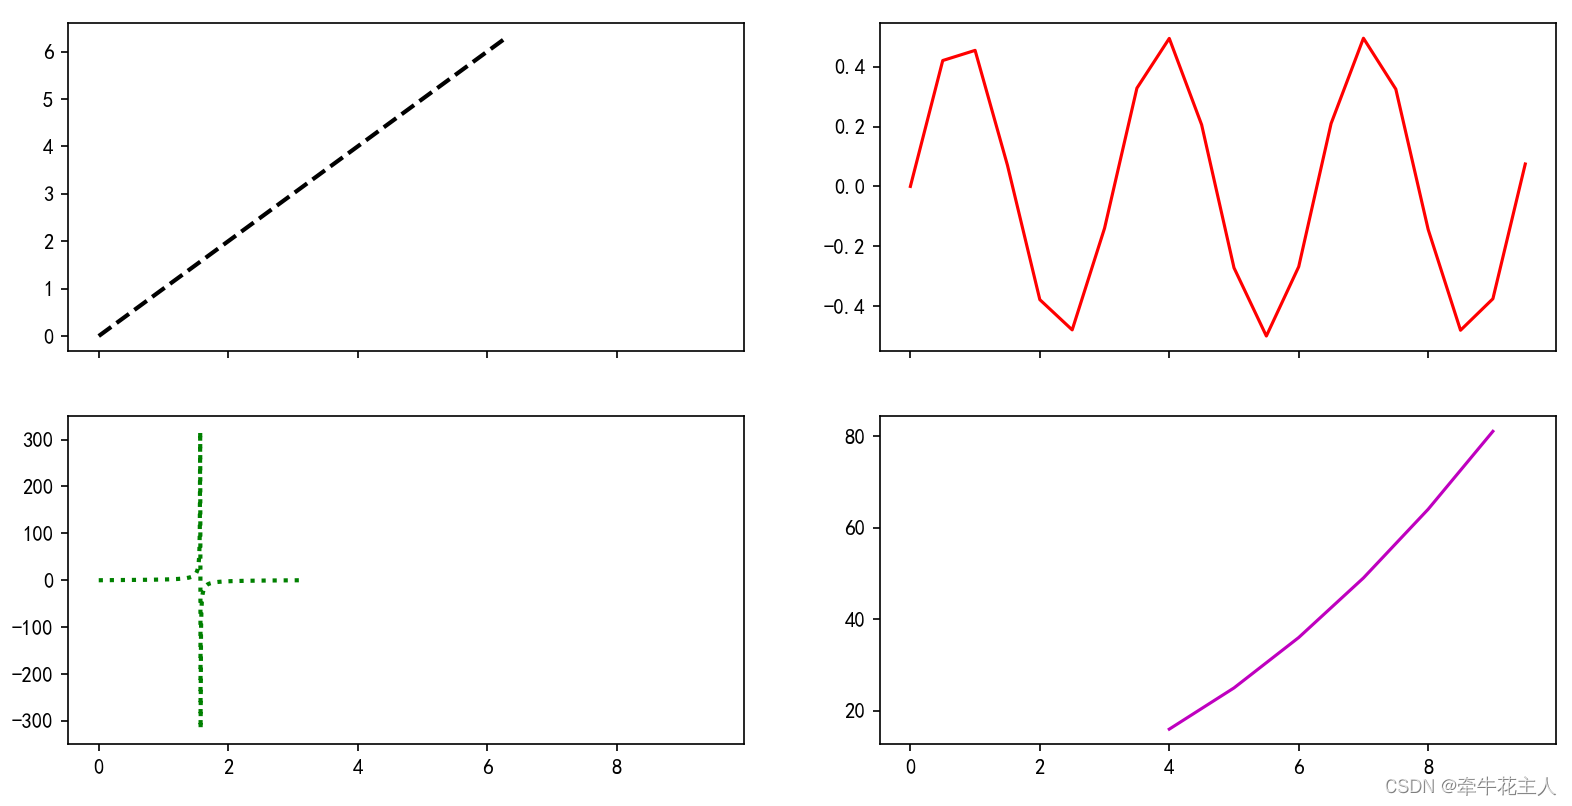
这种情况下相当于sharex='all' 且 sharey='none';每个子区x轴的均使用相同刻度,最后一行显示刻度标签
fig, ax = plt.subplots(2, 2, sharex='all', sharey='none')
3.6.3 sharex=‘none’ 且 sharey=‘all’
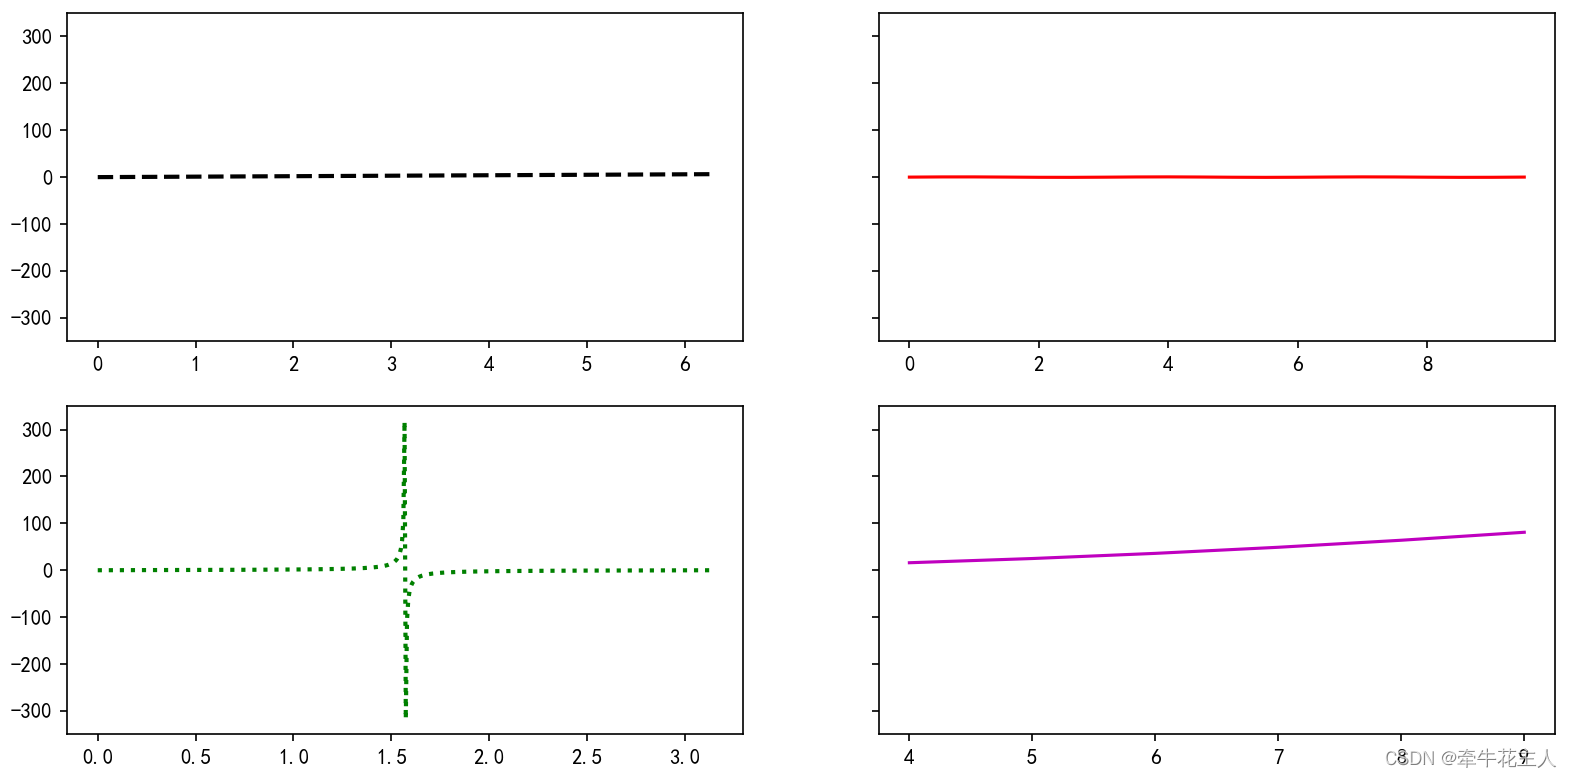
这种情况下相当于sharex='none' 且 sharey='all';每个子区y轴的均使用相同刻度,第一列显示共同的刻度标签
fig, ax = plt.subplots(2, 2, sharex='none', sharey='all')
3.6.4 sharex=‘all’ 且 sharey=‘all’
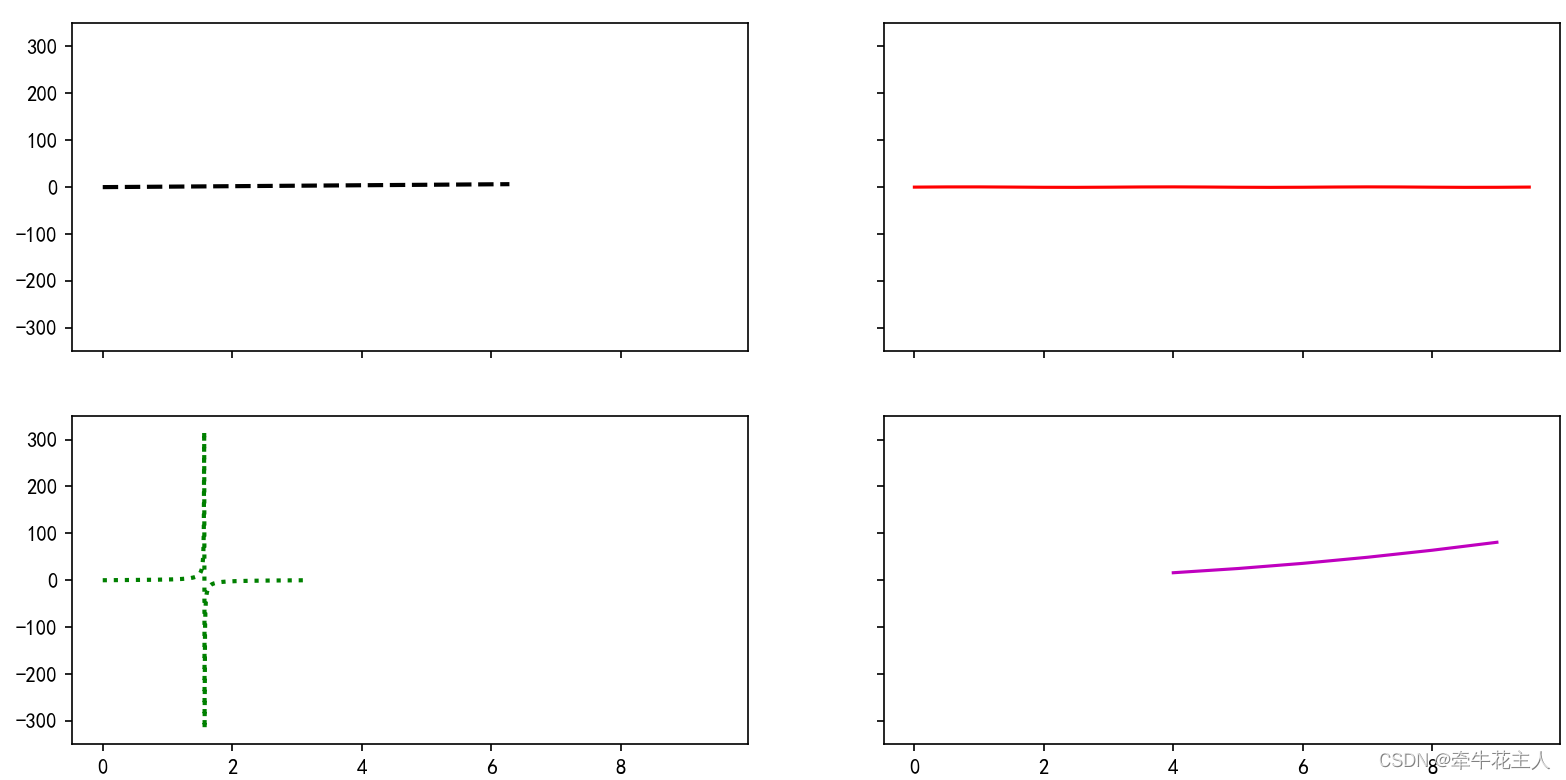
这种情况下相当于sharex='all' 且 sharey='all';每个子区x轴与y轴的均使用相同刻度,第一列与最后一行显示共同的刻度标签
fig, ax = plt.subplots(2, 2, sharex='all', sharey='all')
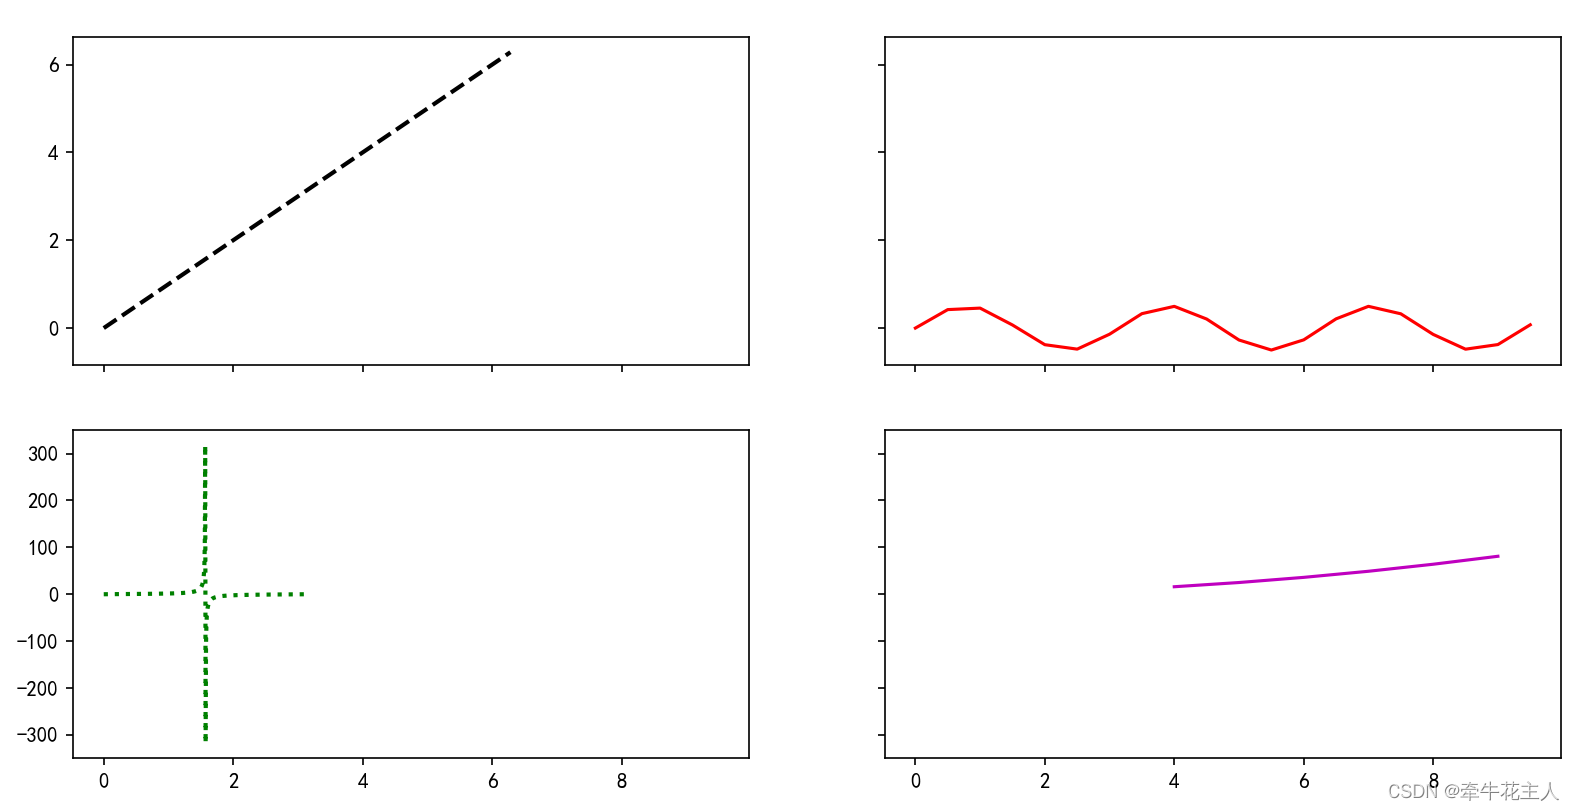
3.6.5 sharex=‘all’ 且 sharey=‘row’
此时所有子区的x轴共享,同一行的y轴共享
fig, ax = plt.subplots(2, 2, sharex='all', sharey='row')
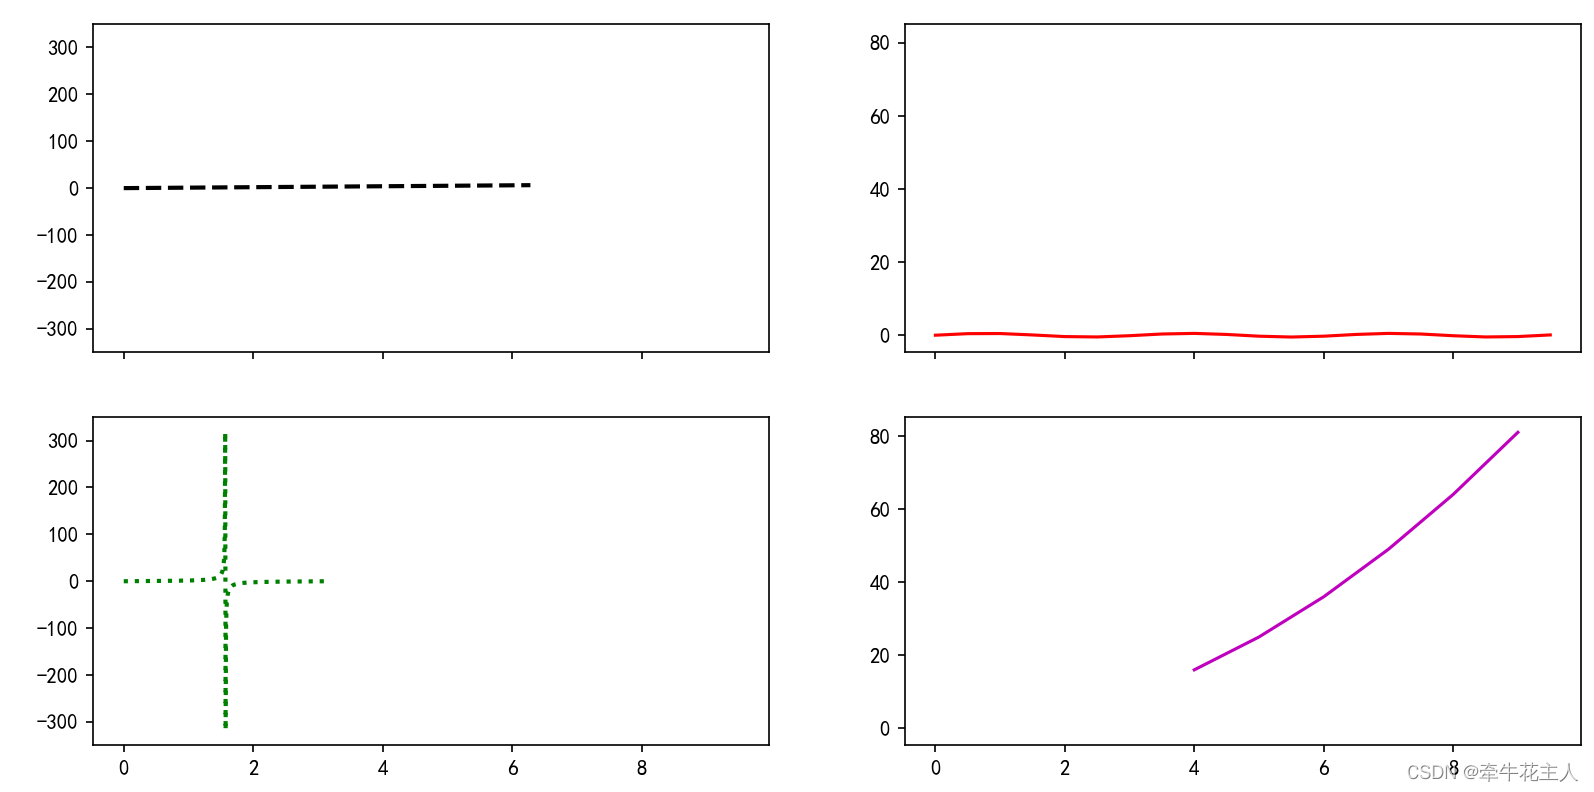
3.6.6 sharex=‘all’ 且 sharey=‘col’
此时所有子区的x轴共享,同一列的y轴共享
fig, ax = plt.subplots(2, 2, sharex='all', sharey='col')
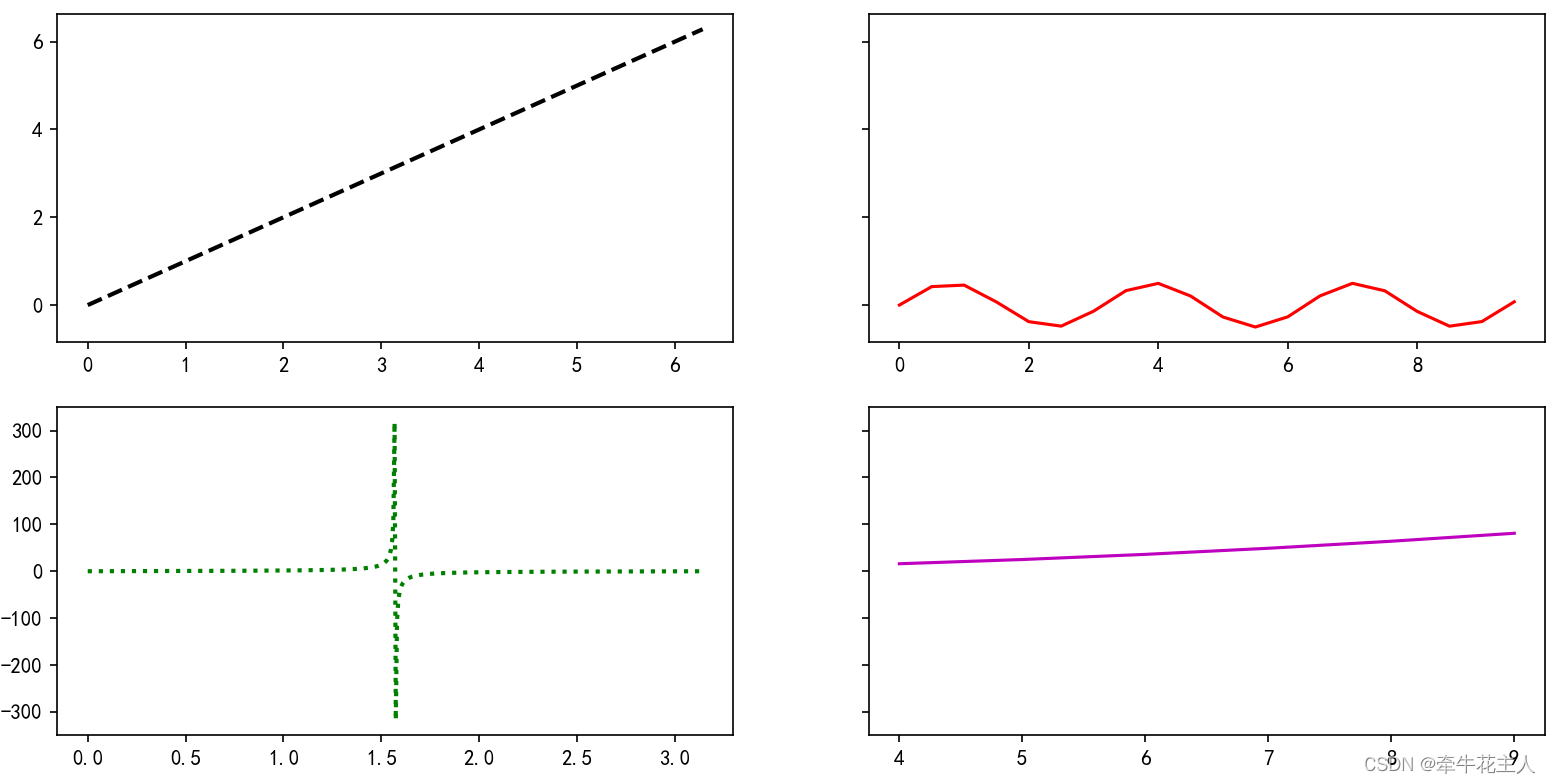
3.6.7 sharex=‘none’ 且 sharey=‘row’
每个子区使用独立的x轴,每行共享相同的y轴
fig, ax = plt.subplots(2, 2, sharex='none', sharey='row')
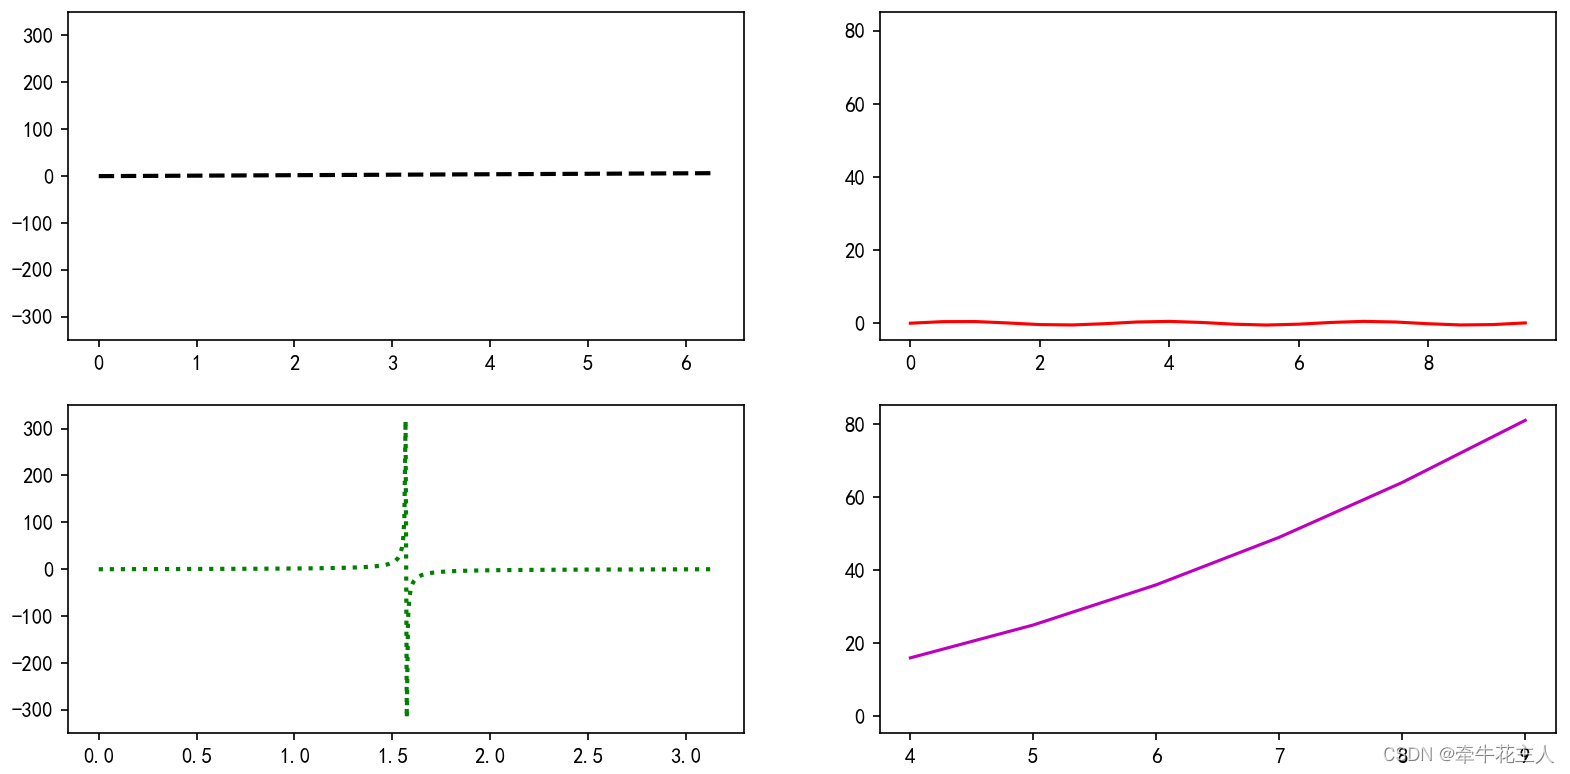
3.6.8 sharex=‘none’ 且 sharey=‘col’
每个子区使用独立的x轴,每列共享相同的y轴
fig, ax = plt.subplots(2, 2, sharex='none', sharey='col')
3.6.9 sharex=‘row’ 且 sharey=‘all’
每行子区使用相同的x轴,所有子区使用相同的y轴
fig, ax = plt.subplots(2, 2, sharex='row', sharey='all')

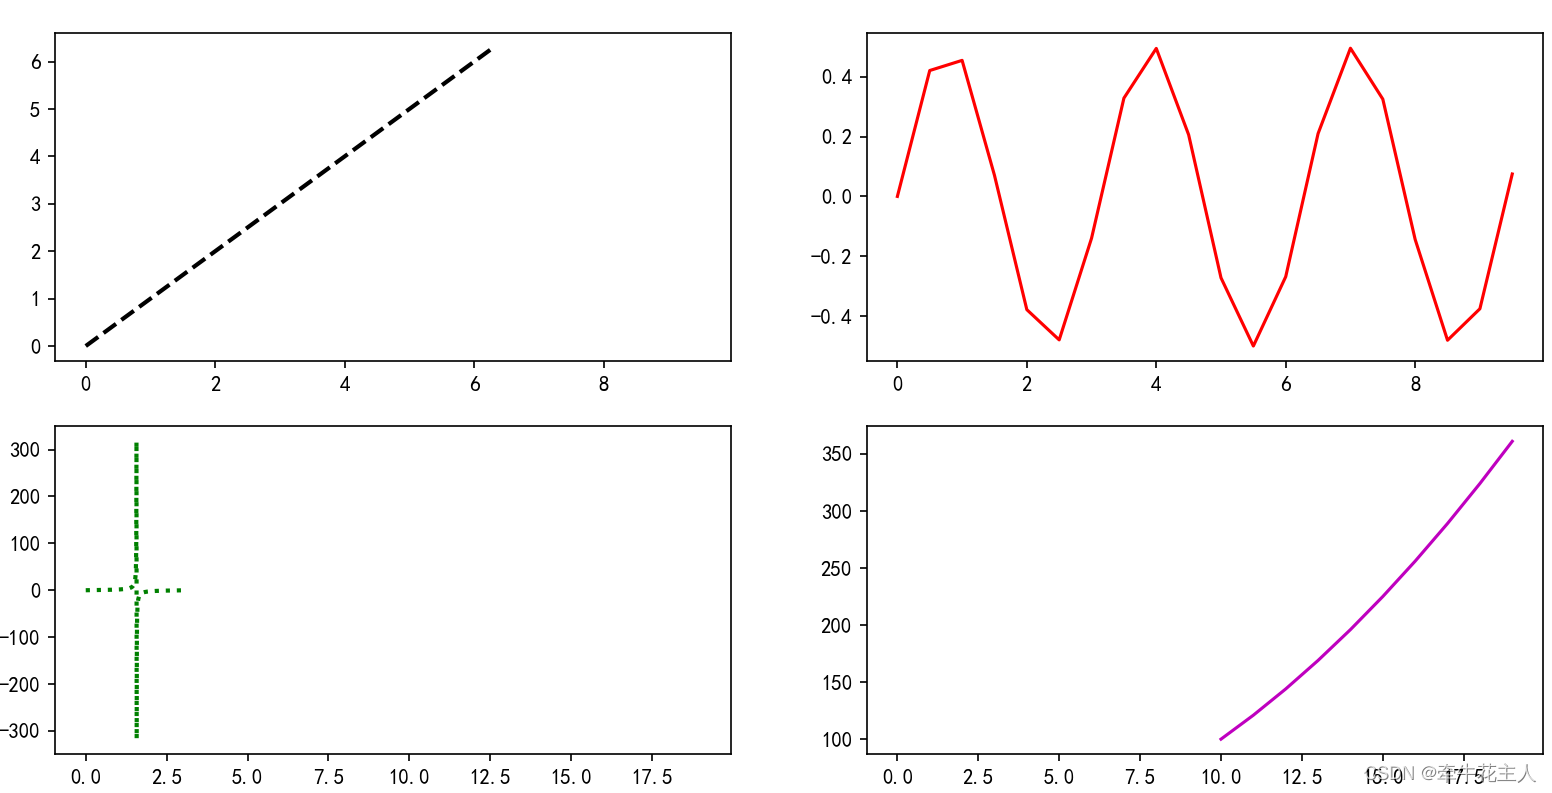
3.6.10 sharex=‘row’ 且 sharey=‘none’
每行子区使用相同的x轴,所有子区使用各自独立的y轴
import matplotlib.pyplot as plt
import numpy as np
import matplotlib as mpl

mpl.rcParams['font.sans-serif'] = ['KaiTi']
mpl.rcParams['axes.unicode_minus'] = False

x1 = np.linspace(0, 2 * np.pi, 500)
y1 = x1
x2 = np.arange(0,10,0.5)
y2 = np.sin(x2) * np.cos(x2)
x3 = np.linspace(0,  np.pi, 500)
y3 = np.tan(x3)
x4 = np.arange(10,20,1)
y4 = x4**2

fig, ax = plt.subplots(2, 2, sharex='row', sharey='none')
ax[0, 0].plot(x1, y1, ls='--', color='k', lw=2)
ax[0, 1].plot(x2, y2, c='r')
ax[1, 0].plot(x3, y3, ls=':', c='g', lw=2)
ax[1, 1].plot(x4, y4, c='m')
plt.show()
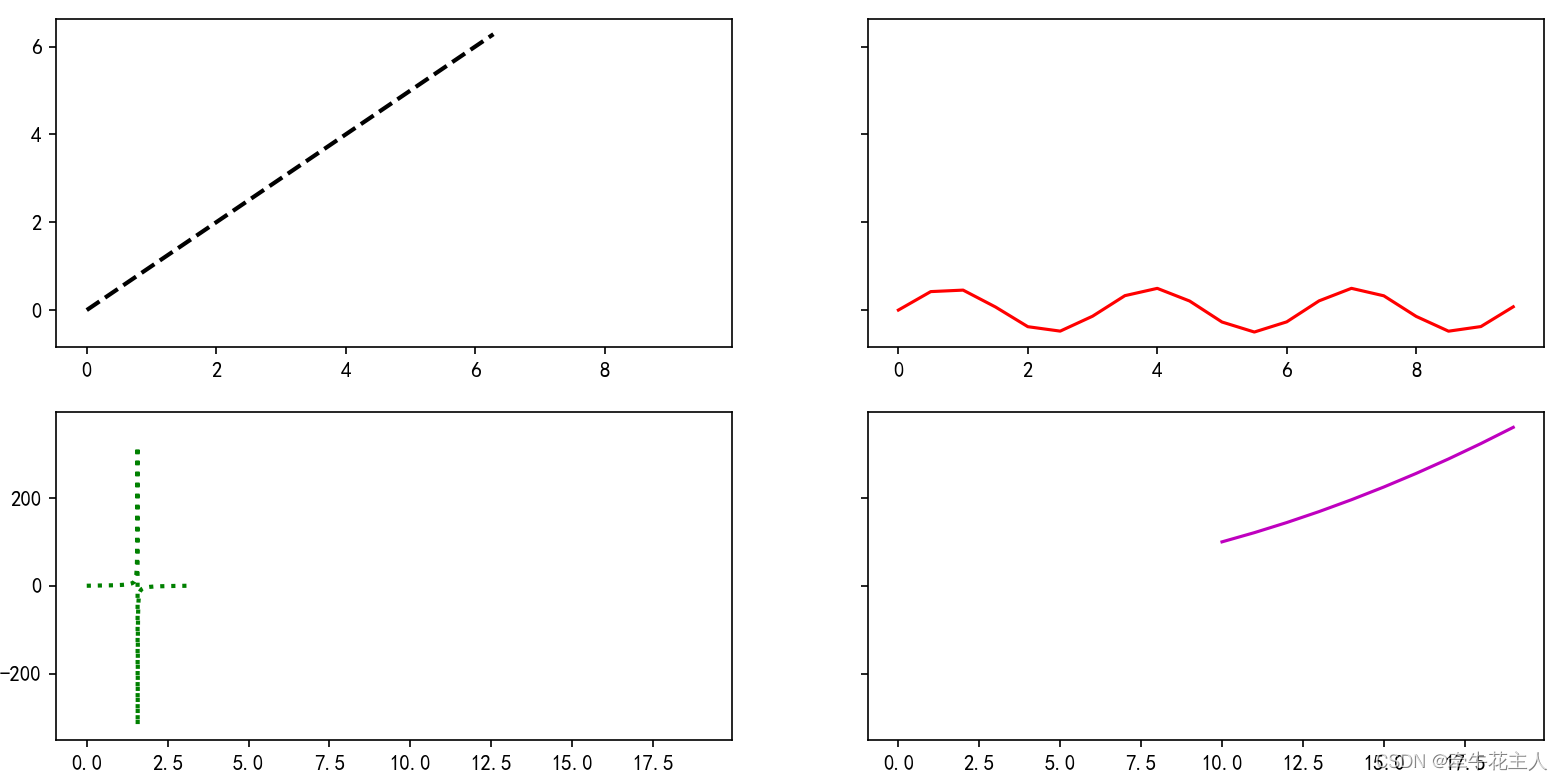
3.6.11 sharex=‘row’ 且 sharey=‘row’
每行子区使用相同的x轴,每行子区共享y轴
fig, ax = plt.subplots(2, 2, sharex='row', sharey='row')
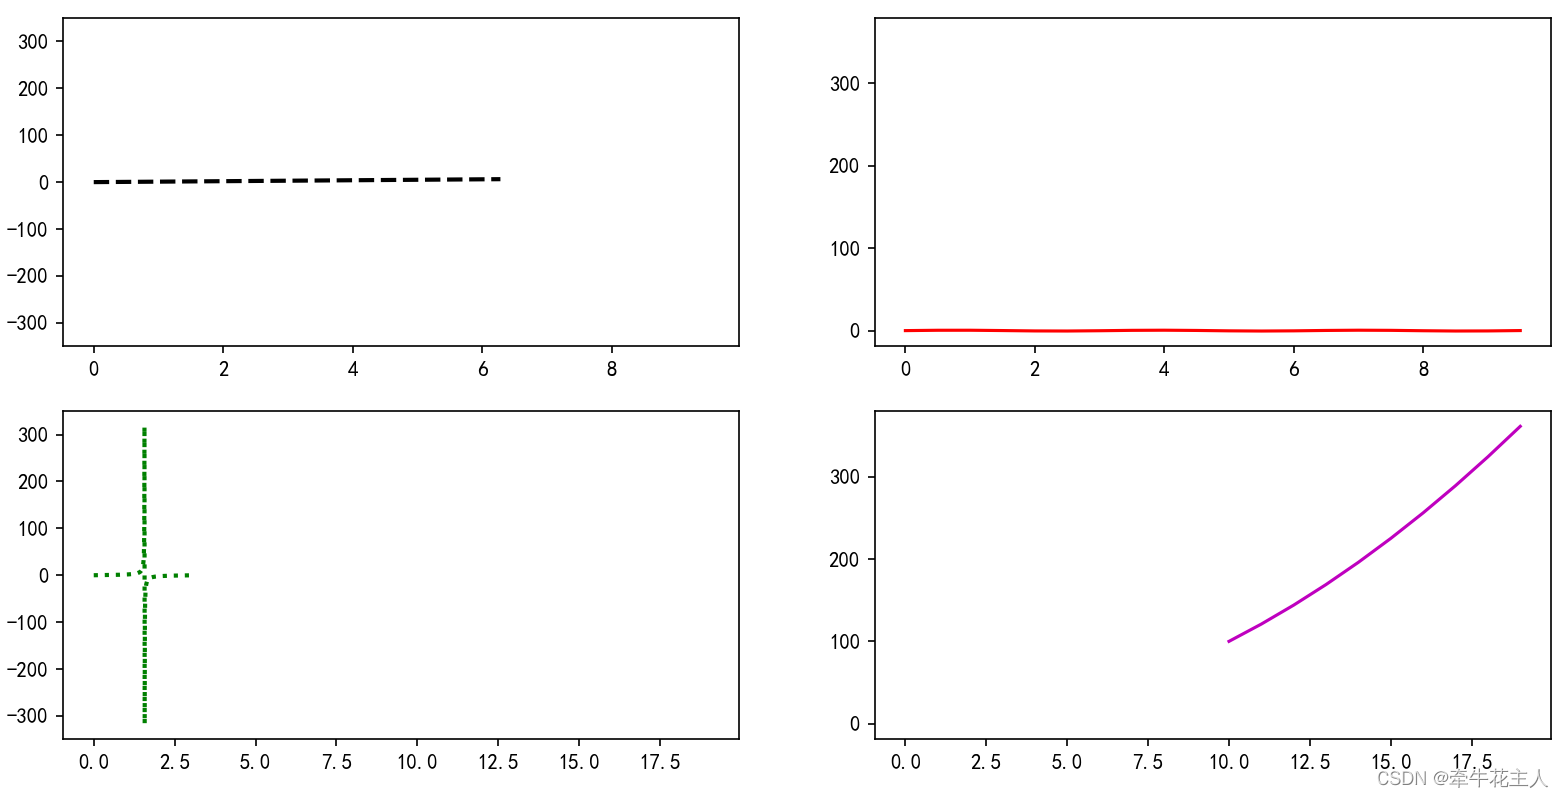
3.6.12 sharex=‘row’ 且 sharey=‘col’
每行子区使用相同的x轴,每列子区共享y轴
fig, ax = plt.subplots(2, 2, sharex='row', sharey='col')
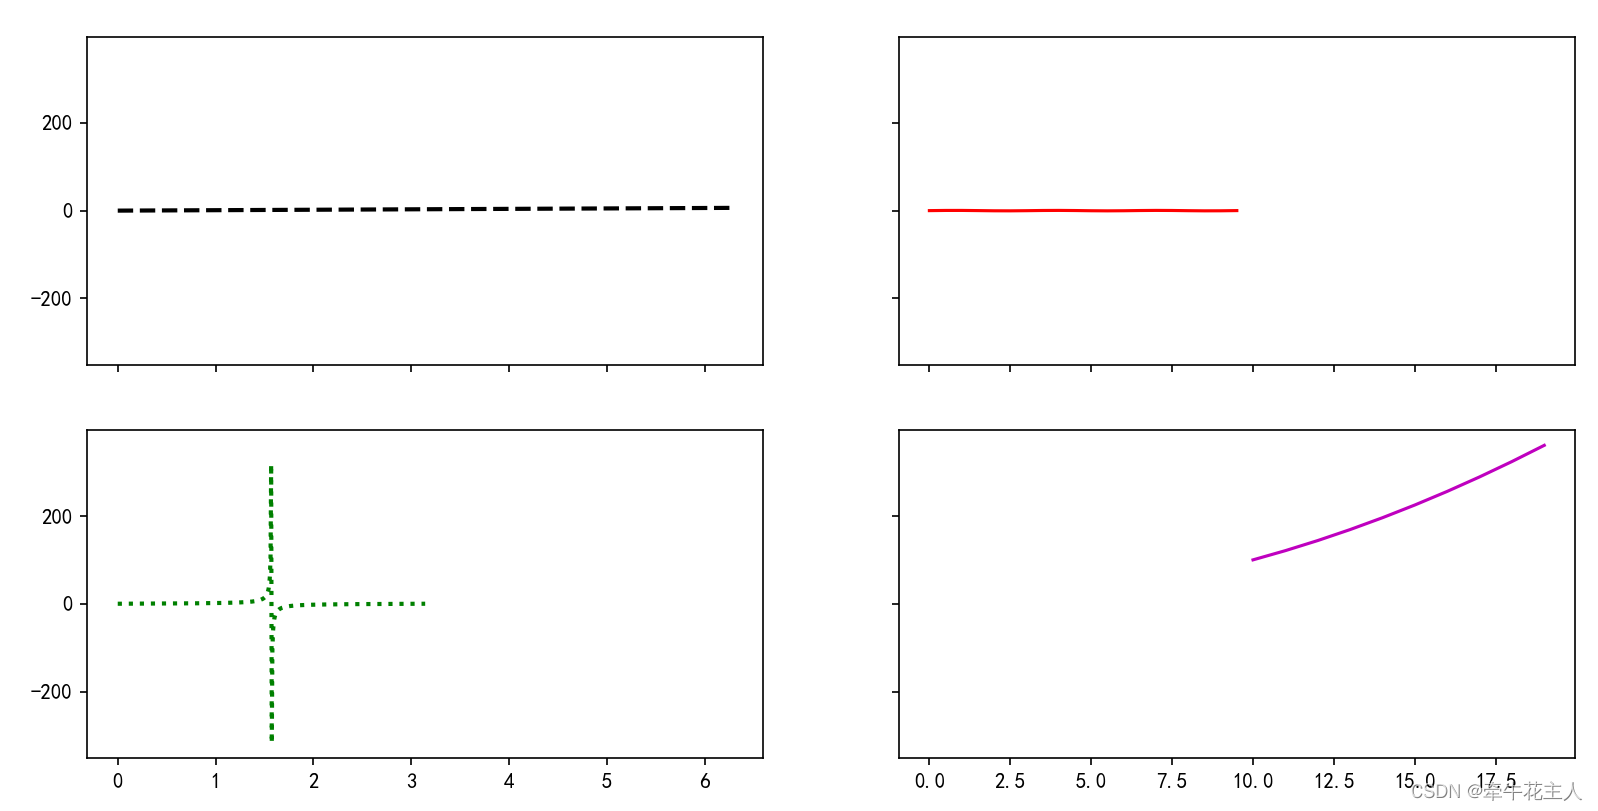
3.6.13 sharex=‘col’ 且 sharey=‘all’
每列共享x轴,所有子区共享y轴
fig, ax = plt.subplots(2, 2, sharex='col', sharey='all')
3.6.14 sharex=‘col’ 且 sharey=‘all’
每列共享x轴,每个子区独立使用各自的y轴
fig, ax = plt.subplots(2, 2, sharex='col', sharey='none')

3.6.15 sharex=‘col’ 且 sharey=‘row’
每列共享x轴,每行共享y轴
fig, ax = plt.subplots(2, 2, sharex='col', sharey='row')
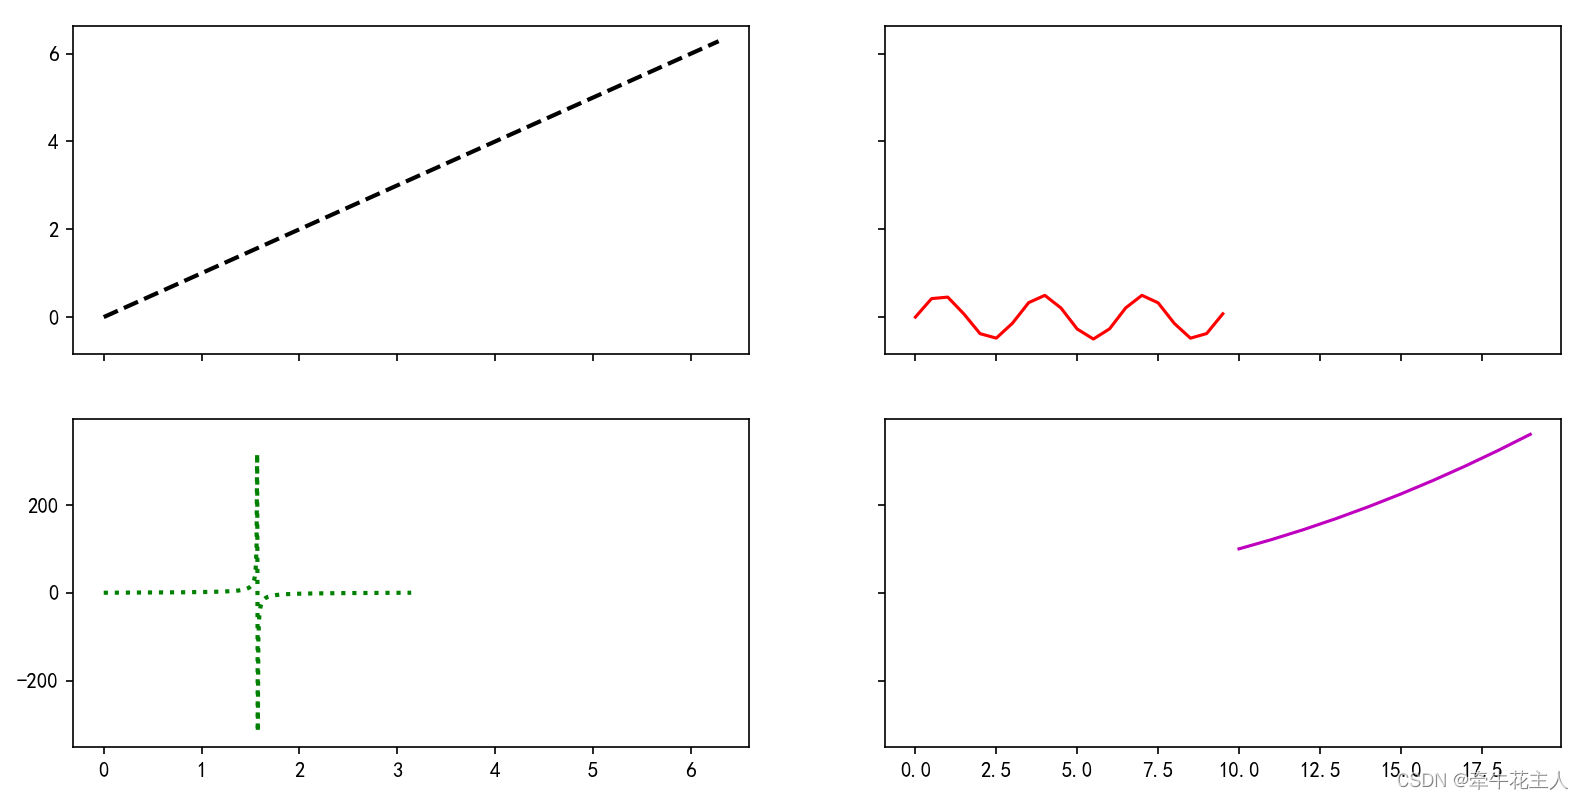
3.6.16 sharex=‘col’ 且 sharey=‘col’
每列共享x轴,每列共享y轴
fig, ax = plt.subplots(2, 2, sharex='col', sharey='col')
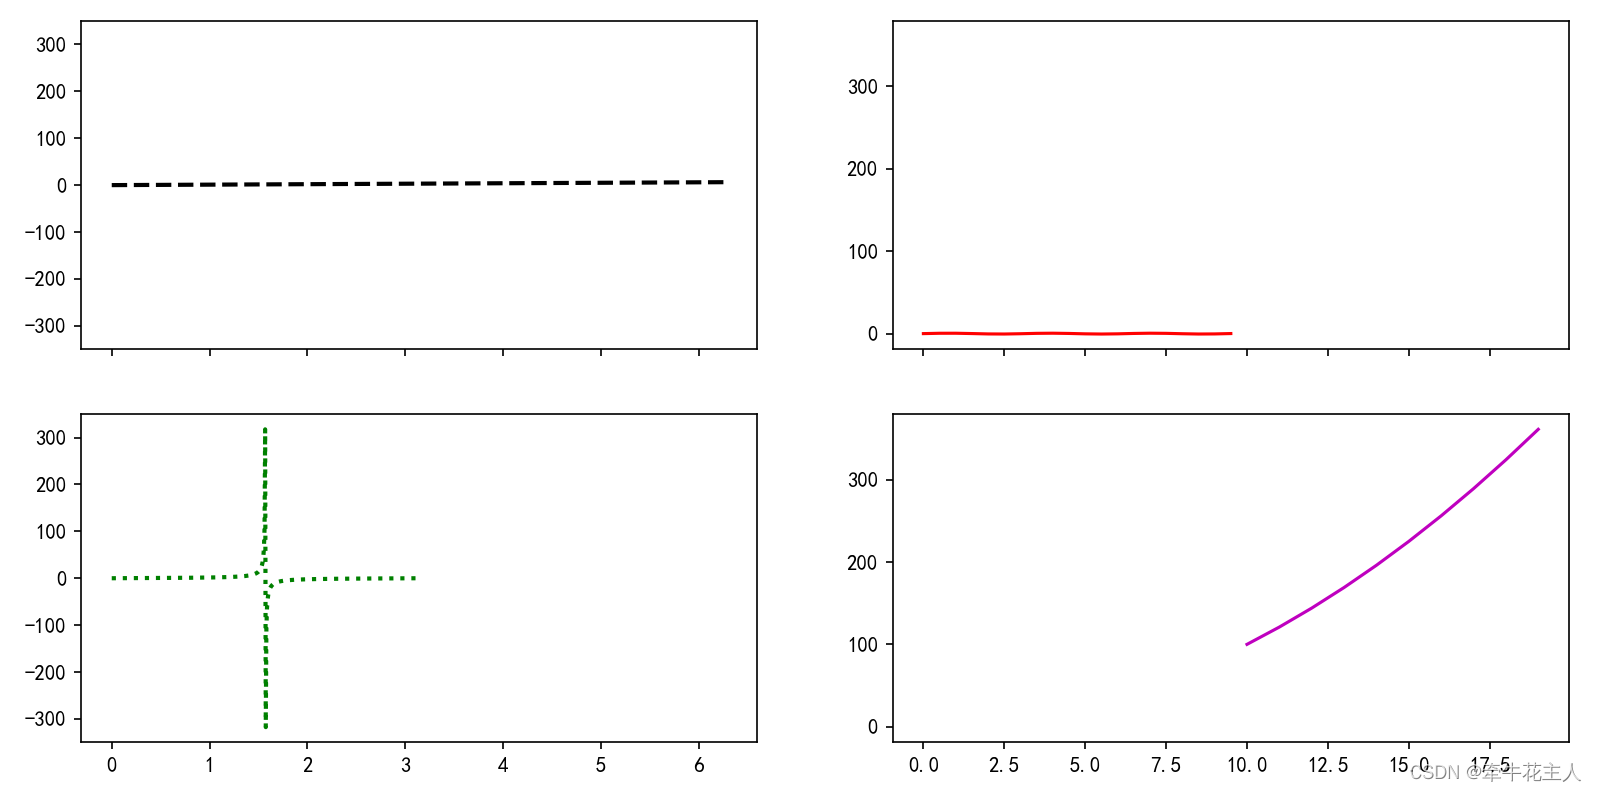
3.6 总结
| 取值 | 含义 |
|---|---|
| sharex=‘all’, sharey=‘all’ | 所有子区共享x轴与y轴 |
| sharex=‘all’, sharey=‘none’ | 所有子区共享x轴,每个子区独立使用各自的y轴 |
| sharex=‘all’, sharey=‘row’ | 所有子区共享x轴,每行子区共享y轴 |
| sharex=‘all’, sharey=‘col’ | 所有子区共享x轴,每列子区共享y轴 |
| sharex=‘none’, sharey=‘all’ | 每个子区独立使用各自的x轴,所有子区共享y轴 |
| sharex=‘none’, sharey=‘none’ | 每个子区独立使用各自的x轴与y轴 |
| sharex=‘none’, sharey=‘row’ | 每个子区独立使用各自的x轴,每行子区共享y轴 |
| sharex=‘none’, sharey=‘col’ | 每个子区独立使用各自的x轴,每列子区共享y轴 |
| sharex=‘row’, sharey=‘all’ | 每行子区共享x轴, 所有子区共享y轴 |
| sharex=‘row’, sharey=‘none’ | 每行子区共享x轴, 每个子区独立使用各自的y轴 |
| sharex=‘row’, sharey=‘row’ | 每行子区共享x轴, 每行子区共享y轴 |
| sharex=‘row’, sharey=‘col’ | 每行子区共享x轴, 每列子区共享y轴 |
| sharex=‘col’, sharey=‘all’ | 每列子区共享x轴, 所有子区共享y轴 |
| sharex=‘col’, sharey=‘none’ | 每列子区共享x轴,每个子区独立使用各自的y轴 |
| sharex=‘col’, sharey=‘row’ | 每列子区共享x轴, 每行子区共享y轴 |
| sharex=‘col’, sharey=‘col’ | 每列子区共享x轴, 每列子区共享y轴 |
4. 返回值
1). 4.1 figure画布
2). 4.2 axes数组
![[SpringBoot] Spring Boot注册Web原生组件/拦截器HandlerInterceptor](https://img-blog.csdnimg.cn/4ce9aa9084c54549bc755db425f4a157.png)



![[架构之路-57]:目标系统 - 平台软件 - 用户空间驱动与硬件抽象层HAL](https://img-blog.csdnimg.cn/26144b7a7b0044538bccf100fd3831cd.png)


