来源
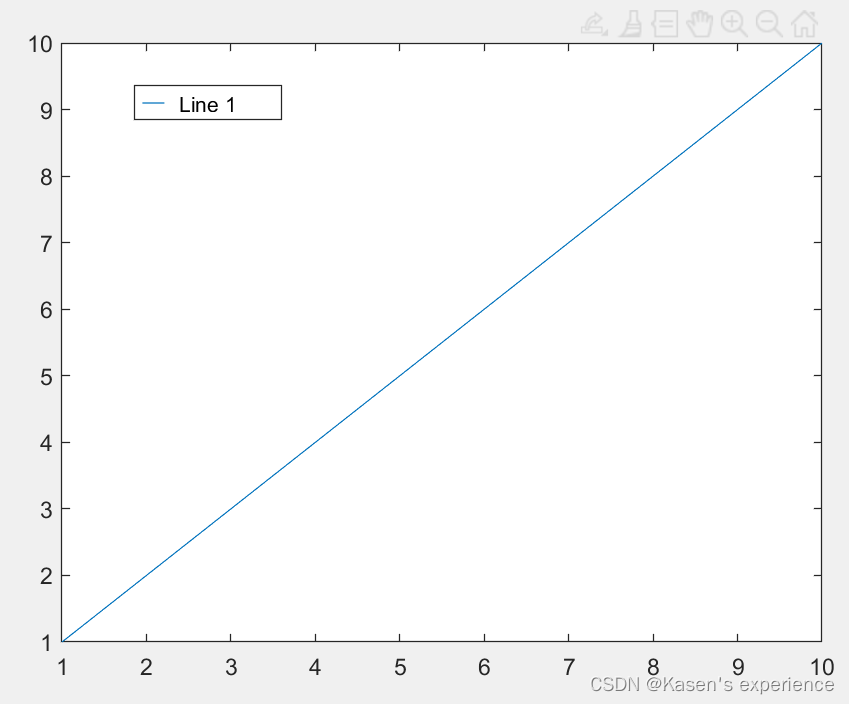
绘图时,稍微减小文字已经不能正常放下图例,想通过调整图例指示线段长度缩减整个图例长度。
方法一
参考matlab官方论坛
leg = legend('Plot1','Plot2',...);
leg.ItemTokenSize = [x1,x2];
By default x1=30 and x2=18 so put larger or smaller numbers as x1,x2 to increase or decrease the legend line size.
自己的代码
lgd = legend({'Theore. SM--------F', 'Theore. SM--------',...
    'Experi. SM--------', 'Experi. SM--------'});
lgd.ItemTokenSize = [15,18];   % 这一句调整图例示例线段长度
lgd.Position = [0.562 0.735 0.4 0.25];
lgd.FontName = 'Arial';
lgd.FontSize = 7;
set(gca, 'Position', [0.565 0.125 0.435 0.6])

方法二
单独运行这段代码没问题,但是多个曲线时报错
h1 = plot(1:10);
[hh,icons,plots,txt] = legend({'Line 1'});
p1 = icons(1).Position;
icons(1).Position = [0.3 p1(2) 0];
icons(2).XData = [0.05 0.2];
![[保研/考研机试] 猫狗收容所 C++实现](https://img-blog.csdnimg.cn/59f202297ce2471a8ed815d7b0564cdb.png)


