一、前言
本博客介绍如何由浅入深的使用一些qcustomplot的用法,对于开源的qcustomplot来说,功能实在实在是太强大了,如果只用于显示简单的曲线真是太浪费前人的心血了,本文就来介绍一些好玩的用法,可以实现的功能有:
1.输入导入数据,曲线显示(非实时,是历史数据)
2.数据分类为不同的曲线显示,可以对曲线动态选择是否刷新显示
3.可以通过单光标移动全局查看每个分类数据数值
4.单击曲线图例标题可以单独显示选中曲线,并高亮变粗,取消选择后恢复显示的曲线显示效果
二、环境
windows10
qt5.7
qcustomplot2.0
三、正文
1.需要准备qcustomplot 2.0版本或以上文件,这个我就不放了,网上一把
2.然后就是重绘的mytracer文件,这个文件网上也有很多,也可以参照我之前的帖子,也有放出,这里我再放一遍目前的。
mytracer.cpp
#include "mytracer.h"
myTracer::myTracer(QCustomPlot *_plot, QCPGraph *_graph, TracerType _type,uint _point) : plot(_plot),
    graph(_graph),
    type(_type),
    point(_point),
    visible(false)
{
    if (plot)
    {
        //指向曲线的圆圈●设置
        tracer = new QCPItemTracer(plot);
        tracer->setStyle(QCPItemTracer::tsCircle);//可以选择设置追踪光标的样式,这个是小十字,还有大十字,圆点等样式
        if(point==0){
            tracer->setPen(QPen(QColor(255,150,50),2));//设置tracer的颜色默认紫色
            tracer->setBrush(QPen(QColor(255,150,50),2).color());
        }
        else{
            tracer->setPen(QPen(QColor(0,255,255),2));//设置tracer的颜色默认紫色
            tracer->setBrush(QPen(QColor(0,255,255),2).color());
        }
        tracer->setSize(5);
        //字体
//        label = new QCPItemText(plot);
//        label->setLayer("overlay");
//        label->setClipToAxisRect(false);
//        label->setPadding(QMargins(2, 2, 2, 2));
//        label->position->setParentAnchor(tracer->position);
//        label->setFont(QFont("宋体", 12));
        //箭头
        arrow = new QCPItemLine(plot);
        arrow->setLayer("overlay");
        if(point==0)
            arrow->setPen(QPen(QColor(0,255,0),2));//设置line的颜色
        else
            arrow->setPen(QPen(QColor(0,0,255),2));//设置line的颜色
        arrow->setClipToAxisRect(true);//设置为true,则线不会超过坐标轴,false,线会超过坐标轴显示
        arrow->setHead(QCPLineEnding::esNone);

        switch (type) {
        case DataTracer:
        {
            tracer->position->setTypeX(QCPItemPosition::ptPlotCoords);
            tracer->position->setTypeY(QCPItemPosition::ptPlotCoords);
//            label->setBrush(QBrush(QColor(200, 15, 40, 150)));//字体背景颜色
//            label->setPen(QPen(QColor(226,60,255,0)));//边框颜色 透明
//            label->setColor(Qt::white);//字体颜色
//            label->setPositionAlignment(Qt::AlignLeft|Qt::AlignVCenter);
            arrow->start->setParentAnchor(tracer->position);
            arrow->end->setParentAnchor(tracer->position);

            break;
        }
        default:
            break;
        }
        setVisible(false);
    }
}
myTracer::~myTracer()
{
    if (tracer)
        plot->removeItem(tracer);
//    if (label)
//        plot->removeItem(label);
    if (arrow)
        plot->removeItem(arrow);
}
void myTracer::setPen(const QPen &pen)
{
    tracer->setPen(pen);
    arrow->setPen(pen);
}
void myTracer::setBrush(const QBrush &brush)
{
    tracer->setBrush(brush);
}
void myTracer::setLabelPen(const QPen &pen)
{
//    label->setPen(pen);
}
void myTracer::setText(const QString &text,const QString &text1)
{
//    label->setText(tr("x:%1 y:%2").arg(text).arg(text1));
}
void myTracer::setVisible(bool visible)
{
    tracer->setVisible(visible);
//    label->setVisible(visible);
    arrow->setVisible(visible);
}
void myTracer::updatePosition(double xValue, double yValue,bool mode)
{
    if (!visible){
        setVisible(true);
        visible = true;
    }
    if (yValue > plot->yAxis->range().upper)
        yValue = plot->yAxis->range().upper;
    switch (type) {
    case DataTracer:
    {
        tracer->position->setCoords(xValue, yValue);
//        label->position->setCoords(10, 0);
        arrow->start->setCoords(0, -1000);//641为控件高度
        arrow->end->setCoords(0,1000);
        break;
    }
    default:
        break;
    }
}
mytracer.h
#ifndef MYTRACER_H
#define MYTRACER_H
#include <QObject>
#include "qcustomplot.h"
enum TracerType
{
    XAxisTracer,
    YAxisTracer,
    DataTracer
};
class myTracer : public QObject
{
    Q_OBJECT
public:
    explicit myTracer(QCustomPlot *_plot,QCPGraph *_graph, TracerType _type,uint _point);//这里与原贴不同,按照原贴构造总是过不去
    ~myTracer();
    void setPen(const QPen &pen);
    void setBrush(const QBrush &brush);
    void setText(const QString &text,const QString &text1);
    void setLabelPen(const QPen &pen);
    void updatePosition(double xValue, double yValue,bool mode);
    void setVisible(bool visible);
protected:
protected:
    QCustomPlot *plot ;	     //传入实例化的QcustomPlot
    QCPGraph *graph;	   	 //这里是存传入的绘图图层
    TracerType type;
    uint point;
    QCPItemTracer *tracer;   // 跟踪的点
    QCPItemText *label;   	 // 显示的数值
    QCPItemLine *arrow;  	 // 箭头
    bool visible;
signals:
public slots:
};
#endif // MYTRACER_H3.之后就是核心程序部分了,首先在ui中创建好提升完控件的qcustomplot控件,在随便创建几个QCheckBox控件,还有一个是用于是否使能放大缩小曲线的。如下图所示。

4. 之后就是代码部分了,首先我们需要曲线初始化函数和曲线更新函数,如下:
//初始化主界面曲线
void FaultboxHistorycheck::QCustomPlot_Init(QCustomPlot *CustomPlot,char mode)
{
    if(mode==1){//重新初始化,清空删除旧曲线
        CustomPlot->clearGraphs();//初始化删除所有曲线
    }
    QString group_name[21]={"xx信号","xx信号","xx信号","xx信号","xx信号","xx信号","xx信号","xx信号","xx信号","xx信号","xx信号","xx信号","xx信号","xx信号","xx信号","xx信号","xx信号","xx信号","xx信号","xx信号","xx信号"};
    QPen graphPen;
    graphPen.setWidthF(4);//曲线粗度
    CustomPlot->addGraph();//添加坐标轴曲线
    CustomPlot->graph(0)->setPen(QPen(QColor(255,0,0),4));//设置曲线颜色
    CustomPlot->graph(0)->setName("x刻度");//设置曲线名称
    char plotcount=0;//计数显示的曲线数量,赋值id使用
    for(int i=0;i<21;i++){
        QCustid[i]=0;//归零
        if(QCustShow[i]){
            QCustid[i]=++plotcount; //设置对应曲线id,从数字1开始,跳过x轴曲线
            CustomPlot->addGraph();
            graphPen.setColor(colors[i]);//设置曲线颜色
            CustomPlot->graph(QCustid[i])->setPen(graphPen);//设置曲线颜色
            CustomPlot->graph(QCustid[i])->setName(group_name[i]);//设置曲线名称
    //        CustomPlot->graph(0)->setBrush(QBrush(QColor(170,225,255,150))); //设置曲线与x轴0点覆盖颜色
        }
    }
    CustomPlot->xAxis->setLabel("时间线");
    CustomPlot->yAxis->setLabel("幅值");
    CustomPlot->yAxis->setRange(0,10);//设置y轴范围
//    QLinearGradient plotGradient;
//    plotGradient.setStart(0, 0);
//    plotGradient.setFinalStop(0, 350);
//    plotGradient.setColorAt(0, QColor(80, 80, 80));
//    plotGradient.setColorAt(1, QColor(50, 50, 50));
    CustomPlot->setBackground(QColor(90, 90, 90));      // 设置背景颜色
//    QLinearGradient axisRectGradient;
//    axisRectGradient.setStart(0, 0);
//    axisRectGradient.setFinalStop(0, 350);
//    axisRectGradient.setColorAt(0, QColor(80, 80, 80));
//    axisRectGradient.setColorAt(1, QColor(30, 30, 30));
    CustomPlot->axisRect()->setBackground(QColor(90, 90, 90));   // 设置QCPAxisRect背景颜色
    CustomPlot->xAxis->setBasePen(QPen(Qt::white,2));//设置x轴坐标轴颜色
    CustomPlot->yAxis->setBasePen(QPen(Qt::white,2));//设置y轴坐标轴颜色
    CustomPlot->xAxis->setTickPen(QPen(Qt::white, 2));  // 轴刻度线的画笔
    CustomPlot->yAxis->setTickPen(QPen(Qt::white, 2));  // 轴刻度线的画笔
    CustomPlot->xAxis->setSubTickPen(QPen(Qt::white, 1)); // 轴子刻度线的画笔
    CustomPlot->yAxis->setSubTickPen(QPen(Qt::white, 1)); // 轴子刻度线的画笔
    CustomPlot->xAxis->setTickLabelColor(Qt::white);//设置x轴坐标颜色
    CustomPlot->yAxis->setTickLabelColor(Qt::white);//设置y轴坐标颜色
    CustomPlot->xAxis->setLabelColor(Qt::white);//设置x轴名称颜色
    CustomPlot->yAxis->setLabelColor(Qt::white);//设置y轴名称颜色
    CustomPlot->xAxis->setUpperEnding(QCPLineEnding::esSpikeArrow);  // 设置轴线结束时的风格为 实角三角形但内部有凹陷的形状, setLowerEnding设置轴线开始时的风格
    CustomPlot->yAxis->setUpperEnding(QCPLineEnding::esSpikeArrow);  // 设置轴线结束时的风格为 实角三角形但内部有凹陷的形状, setLowerEnding设置轴线开始时的风格
    // 每条网格对应一个刻度
    CustomPlot->xAxis->grid()->setVisible(true);// 显示大网格线
    CustomPlot->yAxis->grid()->setVisible(true);
    CustomPlot->xAxis->grid()->setPen(QPen(QColor(140, 140, 140), 1, Qt::DotLine));     // 网格线(对应刻度)画笔
    CustomPlot->yAxis->grid()->setPen(QPen(QColor(140, 140, 140), 1, Qt::DotLine));
    CustomPlot->xAxis->grid()->setSubGridVisible(true);     // 显示子网格线
    CustomPlot->yAxis->grid()->setSubGridVisible(true);
    CustomPlot->xAxis->grid()->setSubGridPen(QPen(QColor(120, 120, 120), 1, Qt::DotLine)); // 子网格线(对应子刻度)画笔
    CustomPlot->yAxis->grid()->setSubGridPen(QPen(QColor(120, 120, 120), 1, Qt::DotLine));
    CustomPlot->xAxis->grid()->setZeroLinePen(QPen(Qt::red));   // 设置刻度为0时的网格线的画笔
    CustomPlot->yAxis->grid()->setZeroLinePen(QPen(Qt::red));
    //设置曲线名称显示
    CustomPlot->legend->setBrush(QColor(90, 190, 190,0));//设置图例提示背景色(曲线名称背景色)
    CustomPlot->legend->setVisible(true);//设置曲线名称可见
    CustomPlot->legend->setBorderPen(Qt::NoPen);//设置文字边框不可见
    CustomPlot->legend->setMargins(QMargins(0,0,0,0));//设置文字与边框距离,边框不可见无效
    CustomPlot->legend->setTextColor(Qt::white);//black
    CustomPlot->legend->setFont(QFont("黑体", 10));//设置文字颜色
    CustomPlot->legend->setSelectedFont(QFont("黑体", 12));
    CustomPlot->legend->setRowSpacing(10);//设置文字间隔
    CustomPlot->legend->setFillOrder(QCPLayoutGrid::foColumnsFirst);//设置图例行优先排列,默认竖着排序名称
    char rowcount=0;
    for (int i=0; i<CustomPlot->graphCount(); i++){//放置曲线标题位置,自动判断曲线数量,一行放7个曲线标题
        CustomPlot->legend->addElement(rowcount,i%7,CustomPlot->legend->item(i));
        if(i%7==6)++rowcount;
    }
    if(mode==0){//第一次初始化曲线将legend放入新插入的layout中
        CustomPlot->plotLayout()->insertRow(0);//插入0行Layout,使曲线名称放在其中,放在Layout中,而不是放在曲线中
        CustomPlot->plotLayout()->addElement(0 , 0, CustomPlot->legend);//设置图例位置,这里选择显示在QCPAxisRect下方,同理可设置显示在QCustomPlot中任意位置
        CustomPlot->plotLayout()->setRowStretchFactor(0, 0.001);
    }
    //设置基本坐标轴(左侧Y轴和下方X轴)可拖动、可缩放、曲线可选、legend可选、设置伸缩比例,使所有图例可见
    CustomPlot->setInteractions(QCP::iRangeDrag|QCP::iRangeZoom| QCP::iSelectAxes | QCP::iSelectLegend | QCP::iSelectPlottables);
    CustomPlot->legend->setSelectableParts(QCPLegend::spItems);//设置legend只能选择图例
}
这个算是比较通用的曲线初始化函数了,包含了很多配置信息,像基本的曲线边框颜色,坐标颜色,网格线,曲线名称,等等都有介绍,可以看见其中有一个mode入口参数,这个mode入口参数的作用是很重要的,用于区分是否为初始化的还是后续更新改变状态的,当mode为0时,在曲线中插入了一行layout,这样之后状态更新时mode为1就不会每次都添加无用的行了,当mode为1时会进入清除当前所有曲线函数,然后根据当前用户设定的曲线数量在重新刷新曲线,标题我是按照7行一换行刷新的,其中与初始化和后续相关的一些参数和变量设置如下:
4.1.定义了颜色数组,不同的分类参数全部显示时颜色是不一致的
const QColor colors[21] = {"#ffcccc","#ffaaaa","#ff7777","#ff5555","#991100","#ffffcc","#ffff77","#ffff00","#aaffaa","#77ff77","#44ff44","#00ff00","#aaffff","#55ffff","#00ffff","#99aaff","#9955ff","#9900FF","#ffaaff","#ff55ff","#ff00ff"};
4.2.定义了一些刷新曲线显示曲线使用的私有变量:
   private:
    bool QCustShow[16+3+2];//曲线显示状态
    char QCustid[16+3+2];//曲线对应id
    bool m_moveflag=false;//曲线移动标志
    bool m_move_enabled;//曲线光标移动使能
    bool m_mouse_pressflag=false;//鼠标按下未抬起标志
    QSharedPointer<myTracer> m1_TracerY;
    int m_cursor;//曲线x当前位置
4.3初始化函数补充如下:
    QCheckBox *groupcheckbox[21]={ui->cbx_1,ui->cbx_2,ui->cbx_3,ui->cbx_4,ui->cbx_5,ui->cbx_6,ui->cbx_7,ui->cbx_8,ui->cbx_9,ui->cbx_10,
                                 ui->cbx_11,ui->cbx_12,ui->cbx_13,ui->cbx_14,ui->cbx_15,ui->cbx_16,ui->cbx_17,ui->cbx_18,ui->cbx_19,ui->cbx_20,ui->cbx_21};
    //曲线显示checkbox
    for(int i=0;i<21;i++){
        QCustShow[i]=groupcheckbox[i]->isChecked();
        connect(groupcheckbox[i],&QCheckBox::clicked,[=](bool res){//更新checkbox状态,刷新曲线显示
            QCustShow[i]=groupcheckbox[i]->isChecked();
            QCustomPlot_Init(ui->customplotwidget1,1);//初始化QCustomPlot控件
            QCustomPlot_Updata(ui->customplotwidget1);//更新曲线显示
            on_checkBox_clicked(false);//默认禁止移动曲线
        });
    }
    //曲线初始化
    QCustomPlot_Init(ui->customplotwidget1,0);//初始化QCustomPlot控件
    connect(ui->customplotwidget1,&QCustomPlot::selectionChangedByUser,[=](){selectionChanged(ui->customplotwidget1);});
    m1_TracerY = QSharedPointer<myTracer> (new myTracer(ui->customplotwidget1, ui->customplotwidget1->graph(0), DataTracer,0));
    on_checkBox_clicked(false);//默认禁止移动曲线
    connect(ui->customplotwidget1, SIGNAL(mousePress(QMouseEvent*)), this, SLOT(my_mousePress1(QMouseEvent*)));
    connect(ui->customplotwidget1, SIGNAL(mouseMove(QMouseEvent*)), this, SLOT(my_mouseMove1(QMouseEvent*)));
    connect(ui->customplotwidget1, SIGNAL(mouseRelease(QMouseEvent*)), this, SLOT(my_mouseRelease1(QMouseEvent*)));
这里可以看见,不仅仅是初始化了qcustomplot这个函数,还对QCheckBox控件做了槽函数绑定,当选择状态改变时,会重新更新qcustomplot函数,重新定义曲线显示数量,每次初始化复位是设置mode为1的,只有软件界面第一次启动mode为0,然后有对mytracer函数进行了初始化和鼠标状态绑定,还有对点击图例进行槽函数绑定,初始化就是这些部分。
5.其次就是各个函数条用了,如下所示:
5.1
//选中标题栏
void FaultboxHistorycheck::selectionChanged(QCustomPlot *CustomPlot)
{
  // make top and bottom axes be selected synchronously, and handle axis and tick labels as one selectable object:
  if (CustomPlot->xAxis->selectedParts().testFlag(QCPAxis::spAxis) || CustomPlot->xAxis->selectedParts().testFlag(QCPAxis::spTickLabels) ||
      CustomPlot->xAxis2->selectedParts().testFlag(QCPAxis::spAxis) || CustomPlot->xAxis2->selectedParts().testFlag(QCPAxis::spTickLabels))
  {
    CustomPlot->xAxis2->setSelectedParts(QCPAxis::spAxis|QCPAxis::spTickLabels);
    CustomPlot->xAxis->setSelectedParts(QCPAxis::spAxis|QCPAxis::spTickLabels);
  }
  // make left and right axes be selected synchronously, and handle axis and tick labels as one selectable object:
  if (CustomPlot->yAxis->selectedParts().testFlag(QCPAxis::spAxis) || CustomPlot->yAxis->selectedParts().testFlag(QCPAxis::spTickLabels) ||
      CustomPlot->yAxis2->selectedParts().testFlag(QCPAxis::spAxis) || CustomPlot->yAxis2->selectedParts().testFlag(QCPAxis::spTickLabels))
  {
    CustomPlot->yAxis2->setSelectedParts(QCPAxis::spAxis|QCPAxis::spTickLabels);
    CustomPlot->yAxis->setSelectedParts(QCPAxis::spAxis|QCPAxis::spTickLabels);
  }

  // 将图形的选择与相应图例项的选择同步
//  qDebug()<<QString::number(CustomPlot->graphCount());
    bool haveselected=false;//曲线选中标志
    for (int i=0; i<CustomPlot->graphCount(); ++i){
        QCPGraph *graph = CustomPlot->graph(i);
        graph->setVisible(false);//首先设置全部隐藏
        QCPPlottableLegendItem *item = CustomPlot->legend->itemWithPlottable(graph);
        if (item->selected() || graph->selected()){
            haveselected=true;//标记有曲线被选中
            graph->setVisible(true);//显示选中的曲线
            item->setSelected(true);//设置选中图例
            QColor plotcolor(255,0,0);//逆向推算当前选择的曲线id对应全部的1-21排序号,获取对应颜色
            for(int j=0;j<21;j++)if(QCustid[j]==i&&i>0)plotcolor=colors[j];
            item->setSelectedTextColor(plotcolor);//设置选中图例文字颜色
            graph->selectionDecorator()->setPen(QPen(plotcolor,8));//设置选中图例曲线颜色
            //注意:这句需要Qcustomplot2.0系列版本
            graph->setSelection(QCPDataSelection(graph->data()->dataRange()));
            //这句1.0系列版本即可
            //graph->setSelected(true);
        }
    }
    if(haveselected==false){//如果取消选择曲线,或者未选中曲线,恢复所有曲线显示
        for (int i=0; i<CustomPlot->graphCount(); ++i){
            QCPGraph *graph = CustomPlot->graph(i);
            graph->setVisible(true);//全部恢复显示
        }
    }
}
此函数的作用是点击图例时会只显示当前图例,其他界面里的曲线全部被隐藏掉,当取消选中图例时,会恢复全部可见曲线显示,注意这里是恢复全部可见曲线,在checkbox控件设置未刷新的曲线是不可见曲线,不会刷新的。这里有一个重点介绍就是我的第一个曲线是x轴用于辅助刷新光标的,不是实际数据曲线,所以在函数处理上对于第一个取消是默认和跳过的,默认红色, 点击当然也会高亮,只不过他就是在现有数据长度的x轴而已,其中还有一个简单算法就是还原当前选择曲线对应全部曲线的id,有些曲线设置不可见之后id排序是跳着的,比如1,2,3不可见,那么数据4才是曲线1,这里就是反推去寻找点击曲线1是,计算出来数据是4,然后更新4的数据,并显示高亮数据4对应的颜色。
5.2
//更新主界面曲线函数
void FaultboxHistorycheck::QCustomPlot_Updata(QCustomPlot *CustomPlot)
{
    QVector<double> x_vec_p1[22],x_p1; //存放数据的容器
    for(int i=0;i<m_groupdata.size();i++){
        x_p1.append(i);
        x_vec_p1[0].append(0);
        for(int j=0;j<16;j++)x_vec_p1[1+j].append(m_groupdata[i].cgq_value[j]);
        for(int j=0;j<3;j++)x_vec_p1[1+16+j].append(m_groupdata[i].cgq_warn[j]);
        for(int j=0;j<2;j++)x_vec_p1[1+16+3+j].append(m_groupdata[i].cgq_temp[j]);
    }
    //设置坐标轴范围
    CustomPlot->xAxis->setRange(0,x_p1.size());//设置x轴范围
    CustomPlot->yAxis->setRange(-1,6);//设置y轴范围

    //CustomPlot->yAxis->rescale(true);//设置Y轴坐标系 自动缩放以正常显示所有的数据
    CustomPlot->graph(0)->setData(x_p1,x_vec_p1[0]);//设置数据
    for(int i=0;i<21;i++){
        if(QCustShow[i]){
            CustomPlot->graph(QCustid[i])->setVisible(QCustShow[i]);//设置曲线是否显示//这里必然显示,保留
            CustomPlot->graph(QCustid[i])->setData(x_p1,x_vec_p1[1+i]);//设置数据
            CustomPlot->graph(QCustid[i])->rescaleAxes(true);//根据图像最高点最低点自动缩放坐标轴
        }
    }

    m_cursor=0;//复位光标位置
    ui->lab_cusor->setText("当前位置:"+QString::number(m_cursor));
    m1_TracerY->updatePosition(m_cursor, 0,false);//刷新光标位置
    CustomPlot->replot();//重绘制
}
此函数就是更新数据曲线,这里没什么特殊介绍的,就是刷新当前可见曲线的数据。
5.3
//设置曲线移动使能和失能
void FaultboxHistorycheck::on_checkBox_clicked(bool checked)
{
    ui->checkBox->setChecked(checked);
    if(checked){
        m_move_enabled=false;//移动光标失能
        ui->customplotwidget1->setInteractions(QCP::iRangeDrag|QCP::iRangeZoom| QCP::iSelectAxes | QCP::iSelectLegend | QCP::iSelectPlottables);//可拖拽、放大缩小、选中标题
    }
    else{
        m_move_enabled=true;//移动光标使能
//        ui->customplotwidget1->setInteractions(false);//可以进行鼠标位置 放大缩小 拖拽  放大缩小坐标系!!!功能非常强大
        ui->customplotwidget1->setInteractions(QCP::iSelectAxes | QCP::iSelectLegend | QCP::iSelectPlottables);//不可拖拽、放大缩小,可选中标题
    }
}
这个函数作用就是使能或失能曲线是否可以拖拽、放大、缩小等操作,但是图例选择是一直允许的。
5.4
//鼠标点击回调函数1
void FaultboxHistorycheck::my_mousePress1(QMouseEvent* event)
{
    if(event->pos().y()>100){//设置点击曲线坐标y小于100点击不刷新光标,否则无法选中图列名称
        m_moveflag=false;//移动曲线
        m_mouse_pressflag=true;//按键按下标志
    }
}
//鼠标移动回调函数1
void FaultboxHistorycheck::my_mouseMove1(QMouseEvent* event)
{
    if(m_move_enabled&&m_mouse_pressflag){//判断按键使能移动,和按键是否按下中,才能拖拽光标
        if(allpacket>0&&m_nownum==m_allnum)
            my_mouseRelease1_refresh(event);
    }
    else
        m_moveflag=true;//移动曲线
}
//曲线1鼠标抬起回调函数
void FaultboxHistorycheck::my_mouseRelease1(QMouseEvent* event)
{
    m_mouse_pressflag=false;
    if(allpacket>0&&m_nownum==m_allnum)
        my_mouseRelease1_refresh(event);
}
//曲线1更新数据函数
void FaultboxHistorycheck::my_mouseRelease1_refresh(QMouseEvent* event)
{
    QLabel *grouplabelname[37]={ui->lab_1,ui->lab_2,ui->lab_3,ui->lab_4,ui->lab_5,ui->lab_6,ui->lab_7,ui->lab_8,ui->lab_9,ui->lab_10,
                               ui->lab_11,ui->lab_12,ui->lab_13,ui->lab_14,ui->lab_15,ui->lab_16,ui->lab_17,ui->lab_18,ui->lab_19,ui->lab_20,
                               ui->lab_21,ui->lab_22,ui->lab_23,ui->lab_24,ui->lab_25,ui->lab_26,ui->lab_27,ui->lab_28,ui->lab_29,ui->lab_30,
                               ui->lab_31,ui->lab_32,ui->lab_33,ui->lab_34,ui->lab_35,ui->lab_36,ui->lab_37};
    //获取鼠标坐标点
    double x_val = ui->customplotwidget1->xAxis->pixelToCoord(event->pos().x());
    //限制x在实际曲线之内
    if(x_val<0)x_val=0;
    if(x_val>(allpacket-1))x_val=allpacket-1;
//    qDebug()<<x_val<<m_moveflag<<m_cursor;
    //处理鼠标点击事件 处理光标
    if(m_moveflag==false){//未滑动鼠标,单点击
        m_cursor=x_val;
//        qDebug()<<m_cursor<<mode;
      这里更新数据到界面控件中,这里是鼠标拖拽光标实时更新查看数据时刻
    }
    ui->lab_cusor->setText("当前位置:"+QString::number(m_cursor));
    m1_TracerY->updatePosition(m_cursor, 0,false);//刷新光标位置
    ui->customplotwidget1->replot();
}
最后就是鼠标操作光标回调函数部分了,这里用了几个变量组合一个小时序逻辑,控制当曲线可以拖拽的时候,不会不可控的自动点击到光标,当曲线不能拖拽,光标可以拖拽时,可以实时拖拽光标回调函数显示每一个时刻的数据数值。
最终效果:
初始界面效果,没放历史数据,随便画画,都一样
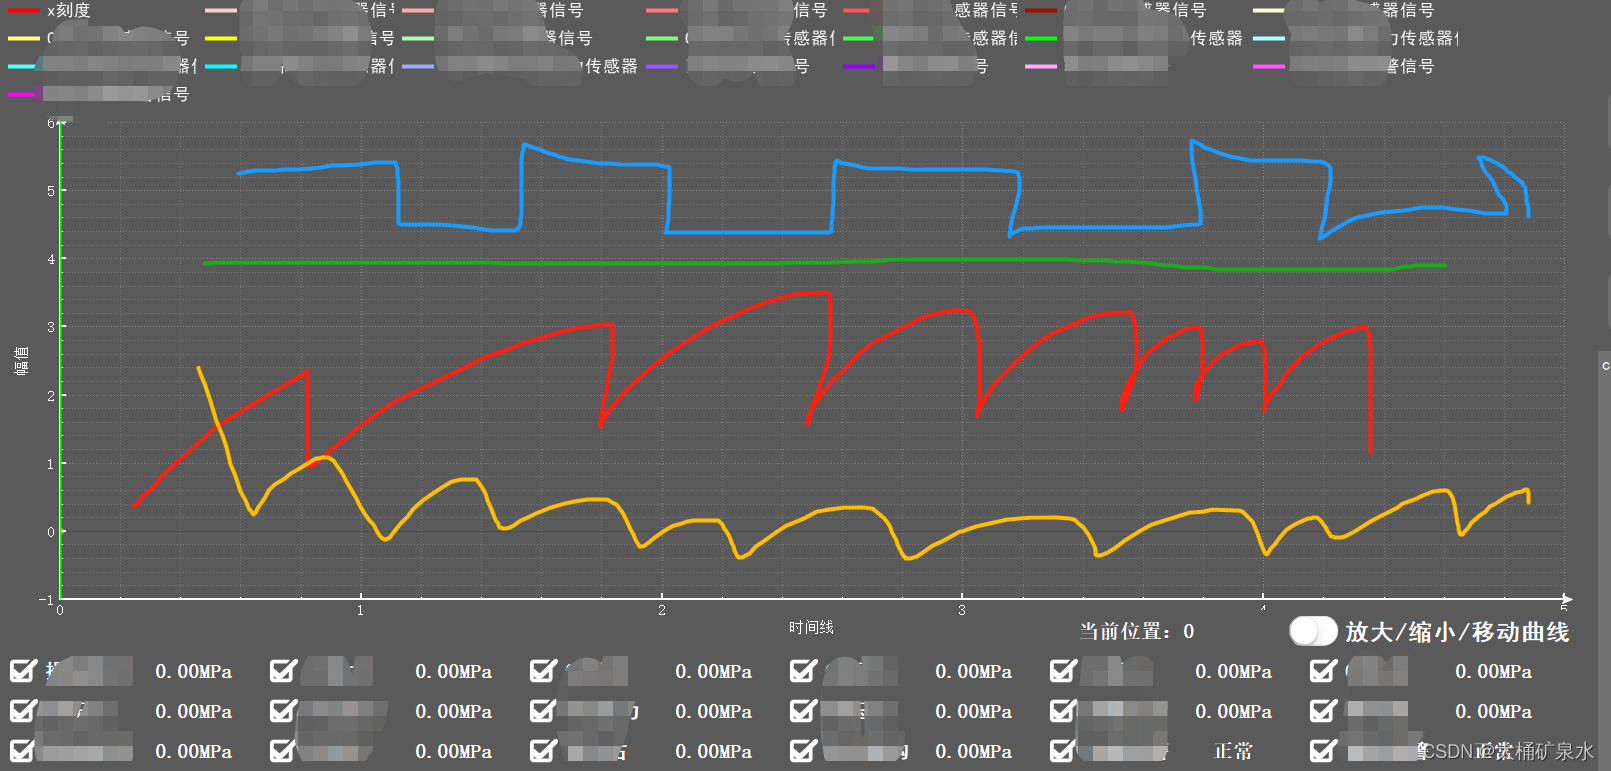
当取消一些QCheckBox选择后,对应曲线图例也会更新,就算有历史数据也不会刷新勾选掉的数据

四、结语
qcustomplot是一个非常非常强大的控件, 开发者们真的很了不起,我相信没有人能够使用完他所有的功能,所以就让我们一点一点发掘吧!
![[附源码]Python计算机毕业设计大学生扶贫创业平台Django(程序+LW)](https://img-blog.csdnimg.cn/3824cbbf49bc4c878ded7203d86025ba.png)
![[附源码]Python计算机毕业设计SSM基于的企业人事管理系统(程序+LW)](https://img-blog.csdnimg.cn/ae096b8702784b6f8ec7092508d5078c.png)


![[附源码]Node.js计算机毕业设计大学生心理健康管理系统Express](https://img-blog.csdnimg.cn/c2e3f6b2435840678cedbe2adc03ccb6.png)