需求: 需要在图表的某几个点上,添加相应的文字显示。效果如下:
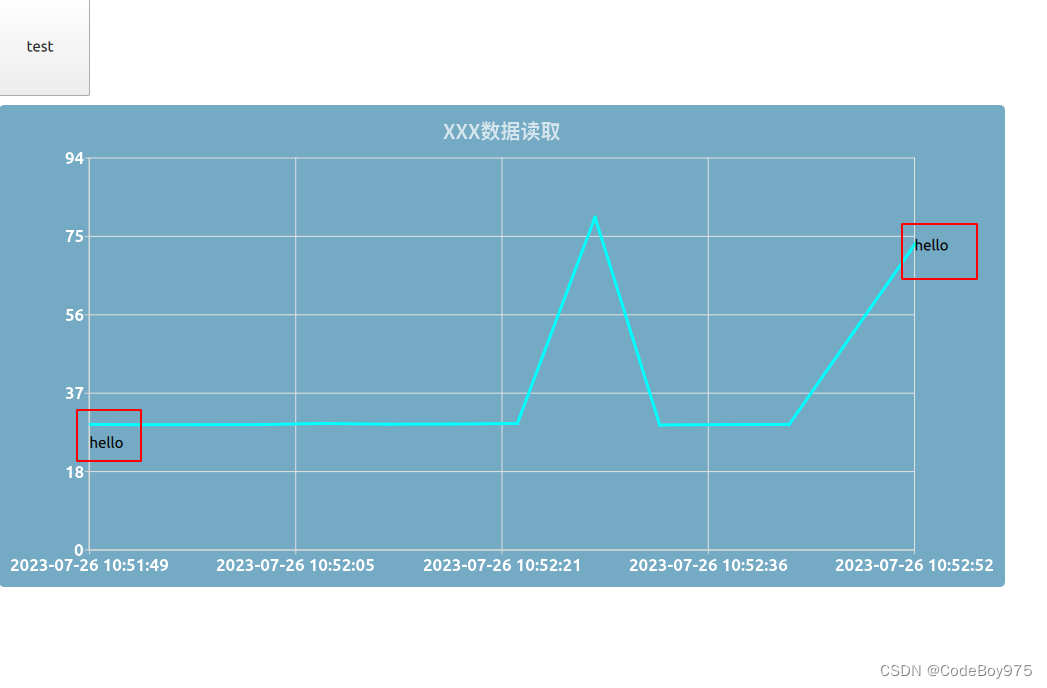
主要是,如何将坐标进行转化为图表的相对坐标,然后动态创建文本后,将转换坐标设置到Text中。
演示demo。需要点击Text按钮后,图表显示。
import QtQuick 2.12
import QtQuick.Controls 2.12
import Qt.labs.qmlmodels 1.0
import QtQuick.Layouts
import QtCharts 2.15

Item {
    id: item
    width: 440
    height: 330
    property bool sourceLoaded: false
    property int timer: 0
    Column{
        Rectangle{
            width:1024
            height: 100
            Button{

                width:100
                height: 100
                text:"test"
                onClicked: {

                    // 动态返回的数据
                    var test = {"1690339907226":29.75,"1690339912226":29.6299991607666,"1690339917226":29.6299991607666,"1690339922226":29.649999618530275,"1690339927226":29.93000030517578,"1690339932226":29.75,"1690339937226":29.790000915527345,"1690339942228":29.93000030517578,"1690339948226":80,"1690339953226":29.56999969482422,"1690339958226":29.649999618530275,"1690339963226":29.690000534057618,"1690339974171":79}
                    var firstKey = Object.keys(test)[0];

                    var keys = Object.keys(test);
                    var lastKey = keys[keys.length-1]

                    console.log("firstKey",firstKey)
                    console.log("lastKEY",lastKey)
                    myAxisX.min = new Date(parseInt(firstKey))
                    myAxisX.max = new Date(parseInt(lastKey))

                    lineSeries.clear();
                    for(let key in test) {
                        lineSeries.append(parseInt(key),test[key]);
                        console.log("x",parseInt(key))
                        console.log("y",test[key])
                    }
                    // 坐标位置转换
                    var p = chartView.mapToPosition(Qt.point(1690339974171,80), lineSeries);
                    var p1 = chartView.mapToPosition(Qt.point(1690339907226,29.6299991607666), lineSeries);

                    var temp = Qt.createQmlObject("import QtQuick 2.3;  Text {text: '"+"hello"+"'; }", chartView, "")
                            temp.x = p.x
                            temp.y = p.y
                    var temp1 = Qt.createQmlObject("import QtQuick 2.3;  Text {text: '"+"hello"+"'; }", chartView, "")
                            temp1.x = p1.x
                            temp1.y = p1.y
                }

            }

        }
        ListModel{
            id: testModel
        }
        Rectangle{
            width: 1024
            height: 500
            ChartView {
                id: chartView
                anchors.fill: parent
                title: "XXX数据读取"
                antialiasing: true
                backgroundColor: "#9917719b"
                animationOptions: ChartView.SeriesAnimations
                titleColor: "#ccffffff"
                titleFont.bold: true
                titleFont.family: "方正粗倩_GBK"
                titleFont.pointSize: 15
                legend.visible:false
                margins.left: 10
                margins.right: 10
                margins.top: 10
                margins.bottom: 10

                DateTimeAxis {
                    id: myAxisX
                    //             min: new Date()
                    //             max: new Date(new Date().getTime() + 10000)
                    labelsColor: "#ffffff"
                    labelsFont.pointSize: 13
                    labelsFont.bold: true
                    format: "yyyy-MM-dd hh:mm:ss"
                }
                ValuesAxis{
                    id:myAxisY
                    min:0
                    max:100
                    tickCount: 6
                    labelsColor: "#ffffff"
                    labelsFont.pointSize: 13
                    labelsFont.bold: true
                    labelFormat: '%d'
                }


                LineSeries {
                    id:lineSeries
                    name: "LineSeries"
                    axisX: myAxisX
                    axisY:myAxisY
                    color: "#00ffff"
                    width: 3
                    //            XYPoint{x:new Date().getTime(); y:11}
                    //            XYPoint{x:new Date().getTime() + 1000; y:22}
                    //            XYPoint{x:new Date().getTime() + 2000; y:11}
                    //            XYPoint{x:new Date().getTime() + 3000; y:22}
                    //            XYPoint{x:new Date().getTime() + 4000; y:11}
                    //            XYPoint{x:new Date().getTime() + 5000; y:22}
                    Component.onCompleted: {


                    }
                }
                // 放大缩小功能
                MouseArea{
                    id:mosuearea
                    anchors.fill: parent

                    property point clickPos: "0,0"


                    onWheel: {
                        if(wheel.angleDelta.y > 0)
                        {
                            chartView.zoom(1.1 )
                        }else
                        {
                            chartView.zoom(0.9)
                        }
                    }
                    onPressed: {
                        clickPos  = Qt.point(mouse.x,mouse.y)
                    }


                    onPositionChanged: {
                        var delta = Qt.point(mouse.x-clickPos.x, mouse.y-clickPos.y)

                        if(delta.x > 30)
                        {
                            chartView.scrollLeft(30)
                        }
                        else if(delta.x< -30)
                        {
                            chartView.scrollLeft(-30)
                        }else
                        {
                            chartView.scrollLeft(delta.x)
                        }

                        if(delta.y > 30)
                        {
                            chartView.scrollUp(30)
                        }
                        else if(delta.y< -30)
                        {
                            chartView.scrollUp(-30)
                        }else
                        {
                            chartView.scrollUp(delta.y)
                        }

                        clickPos  = Qt.point(mouse.x,mouse.y)
                    }
                }


            }


        }

    }


}
