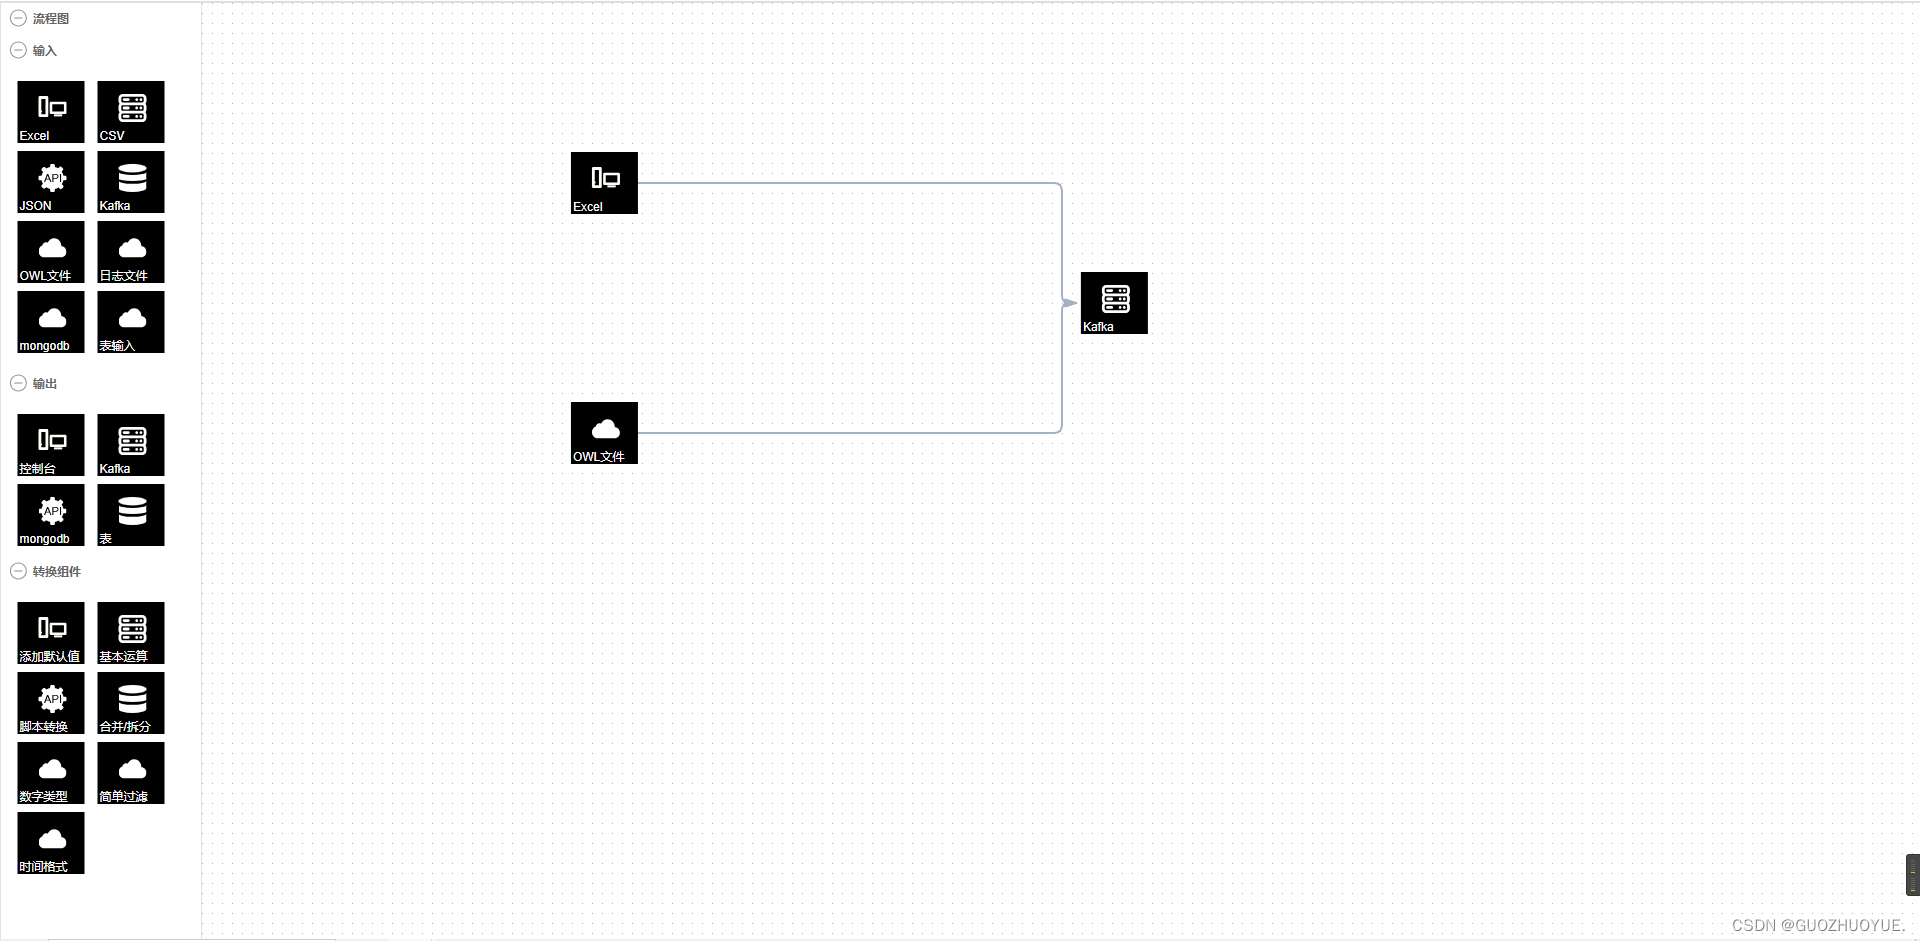
vue3+vite+Ts 基于Antv/x6 绘制流程图

news2024/9/22 11:29:05

需求效果:


需求:

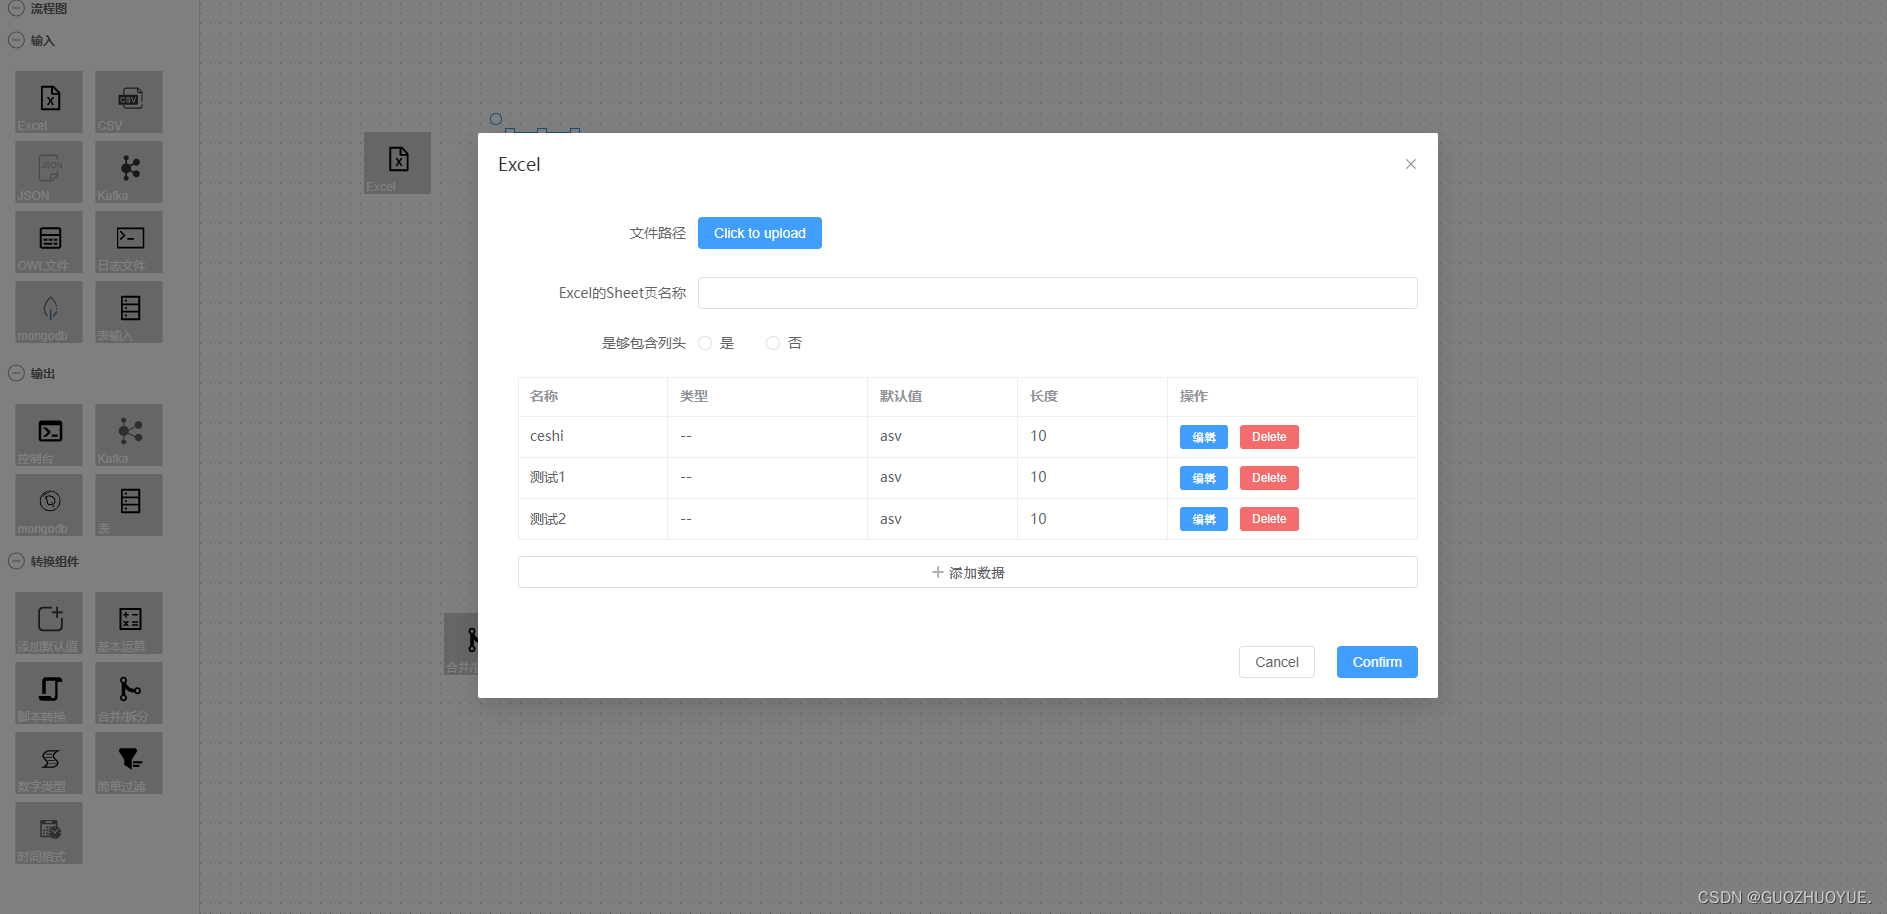
实现一个流程图,双击可对相应的组件进行一些功能操作;

工具栈:

这里使用@antv/x6, 基于vue3+vite+ts进行开发

官网地址:

 https://x6.antv.antgroup.com/examples/showcase/practices/#flowchart

代码:

<template>
    <div id="container">
        <router-view />
    </div>
</template>
  
<script lang="ts" setup>
import { Graph, Shape } from '@antv/x6'
import { Stencil } from '@antv/x6-plugin-stencil'
import { Transform } from '@antv/x6-plugin-transform'
import { Selection } from '@antv/x6-plugin-selection'
import { Snapline } from '@antv/x6-plugin-snapline'
import { Keyboard } from '@antv/x6-plugin-keyboard'
import { Clipboard } from '@antv/x6-plugin-clipboard'
import { History } from '@antv/x6-plugin-history'
import insertCss from 'insert-css'


import { useRouter } from "vue-router"


// 引入本地图片
const getImageUrl = (url: any) => {
    return new URL(url, import.meta.url).href;
}

const router = useRouter()


onMounted(() => {
    // 为了协助代码演示
    preWork()

    // #region 初始化画布
    const graph = new Graph({
        container: document.getElementById('graph-container')!,
        grid: true,
        mousewheel: {
            enabled: true,
            zoomAtMousePosition: true,
            modifiers: 'ctrl',
            minScale: 0.5,
            maxScale: 3,
        },
        connecting: {
            router: 'manhattan',
            connector: {
                name: 'rounded',
                args: {
                    radius: 8,
                },
            },
            anchor: 'left',
            connectionPoint: 'anchor',
            allowBlank: false,
            snap: {
                radius: 20,
            },
            createEdge() {
                return new Shape.Edge({
                    attrs: {
                        line: {
                            stroke: '#A2B1C3',
                            strokeWidth: 2,
                            targetMarker: {
                                name: 'block',
                                width: 12,
                                height: 8,
                            },
                        },
                    },
                    zIndex: 0,
                    //....
                })
            },
            validateConnection({ targetMagnet }) {
                return !!targetMagnet
            },
        },
        highlighting: {
            magnetAdsorbed: {
                name: 'stroke',
                args: {
                    attrs: {
                        fill: '#5F95FF',
                        stroke: '#5F95FF',
                    },
                },
            },
        },
    })
    // #endregion

    // #region 使用插件
    graph
        .use(
            new Transform({
                resizing: true,
                rotating: true,
            }),
        )
        .use(
            new Selection({
                rubberband: true,
                showNodeSelectionBox: true,
            }),
        )
        .use(new Snapline())
        .use(new Keyboard())
        .use(new Clipboard())
        .use(new History())
    // #endregion

    // #region 初始化 stencil
    const stencil = new Stencil({
        title: '流程图',
        target: graph,
        stencilGraphWidth: 300,
        stencilGraphHeight: 180,
        collapsable: true,
        groups: [

            {
                title: '输入',
                name: 'group2',
                graphHeight: 300,
                layoutOptions: {
                    rowHeight: 70,
                },
            },
            {
                title: '输出',
                name: 'group3',
                graphHeight: 0,
                layoutOptions: {
                    rowHeight: 70,
                },
            },
            {
                title: '转换组件',
                name: 'group1',
                graphHeight: 300,
                layoutOptions: {
                    rowHeight: 70,
                },
            },
        ],
        layoutOptions: {
            columns: 2,
            columnWidth: 80,
            rowHeight: 55,
        },
    })
    document.getElementById('stencil')!.appendChild(stencil.container)
    // #endregion

    // #region 快捷键与事件
    graph.bindKey(['meta+c', 'ctrl+c'], () => {
        const cells = graph.getSelectedCells()
        if (cells.length) {
            graph.copy(cells)
        }
        return false
    })
    graph.bindKey(['meta+x', 'ctrl+x'], () => {
        const cells = graph.getSelectedCells()
        if (cells.length) {
            graph.cut(cells)
        }
        return false
    })
    graph.bindKey(['meta+v', 'ctrl+v'], () => {
        if (!graph.isClipboardEmpty()) {
            const cells = graph.paste({ offset: 32 })
            graph.cleanSelection()
            graph.select(cells)
        }
        return false
    })

    // undo redo
    graph.bindKey(['meta+z', 'ctrl+z'], () => {
        if (graph.canUndo()) {
            graph.undo()
        }
        return false
    })
    graph.bindKey(['meta+shift+z', 'ctrl+shift+z'], () => {
        if (graph.canRedo()) {
            graph.redo()
        }
        return false
    })

    // select all
    graph.bindKey(['meta+a', 'ctrl+a'], () => {
        const nodes = graph.getNodes()
        if (nodes) {
            graph.select(nodes)
        }
    })

    // delete
    graph.bindKey('backspace', () => {
        const cells = graph.getSelectedCells()
        if (cells.length) {
            graph.removeCells(cells)
        }
    })

    // zoom
    graph.bindKey(['ctrl+1', 'meta+1'], () => {
        const zoom = graph.zoom()
        if (zoom < 1.5) {
            graph.zoom(0.1)
        }
    })
    graph.bindKey(['ctrl+2', 'meta+2'], () => {
        const zoom = graph.zoom()
        if (zoom > 0.5) {
            graph.zoom(-0.1)
        }
    })

    // 控制连接桩显示/隐藏
    const showPorts = (ports: NodeListOf<SVGElement>, show: boolean) => {
        for (let i = 0, len = ports.length; i < len; i += 1) {
            ports[i].style.visibility = show ? 'visible' : 'hidden'
        }
    }
    graph.on('node:mouseenter', () => {
        const container = document.getElementById('graph-container')!
        const ports = container.querySelectorAll(
            '.x6-port-body',
        ) as NodeListOf<SVGElement>
        showPorts(ports, true)
    })
    graph.on('node:mouseleave', () => {
        const container = document.getElementById('graph-container')!
        const ports = container.querySelectorAll(
            '.x6-port-body',
        ) as NodeListOf<SVGElement>
        showPorts(ports, false)
    })
    // #endregion

    // #region 初始化图形
    const ports = {
        groups: {
            top: {
                position: 'top',
                attrs: {
                    circle: {
                        r: 4,
                        magnet: true,
                        stroke: '#5F95FF',
                        strokeWidth: 1,
                        fill: '#fff',
                        style: {
                            visibility: 'hidden',
                        },
                    },
                },
            },
            right: {
                position: 'right',
                attrs: {
                    circle: {
                        r: 4,
                        magnet: true,
                        stroke: '#5F95FF',
                        strokeWidth: 1,
                        fill: '#fff',
                        style: {
                            visibility: 'hidden',
                        },
                    },
                },
            },
            bottom: {
                position: 'bottom',
                attrs: {
                    circle: {
                        r: 4,
                        magnet: true,
                        stroke: '#5F95FF',
                        strokeWidth: 1,
                        fill: '#fff',
                        style: {
                            visibility: 'hidden',
                        },
                    },
                },
            },
            left: {
                position: 'left',
                attrs: {
                    circle: {
                        r: 4,
                        magnet: true,
                        stroke: '#5F95FF',
                        strokeWidth: 1,
                        fill: '#fff',
                        style: {
                            visibility: 'hidden',
                        },
                    },
                },
            },
        },
        items: [
            {
                group: 'top',
            },
            {
                group: 'right',
            },
            {
                group: 'bottom',
            },
            {
                group: 'left',
            },
        ],
    }

    Graph.registerNode(
        'custom-rect',
        {
            inherit: 'rect',
            width: 66,
            height: 36,
            attrs: {
                body: {
                    strokeWidth: 1,
                    stroke: '#5F95FF',
                    fill: '#EFF4FF',
                },
                text: {
                    fontSize: 12,
                    fill: '#262626',
                },
            },
            ports: { ...ports },
        },
        true,
    )

    Graph.registerNode(
        'custom-polygon',
        {
            inherit: 'polygon',
            width: 66,
            height: 36,
            attrs: {
                body: {
                    strokeWidth: 1,
                    stroke: '#5F95FF',
                    fill: '#EFF4FF',
                },
                text: {
                    fontSize: 12,
                    fill: '#262626',
                },
            },
            ports: {
                ...ports,
                items: [
                    {
                        group: 'top',
                    },
                    {
                        group: 'bottom',
                    },
                ],
            },
        },
        true,
    )

    Graph.registerNode(
        'custom-circle',
        {
            inherit: 'circle',
            width: 45,
            height: 45,
            attrs: {
                body: {
                    strokeWidth: 1,
                    stroke: '#5F95FF',
                    fill: '#EFF4FF',
                },
                text: {
                    fontSize: 12,
                    fill: '#262626',
                },
            },
            ports: { ...ports },
        },
        true,
    )

    Graph.registerNode(
        'custom-image',
        {
            inherit: 'rect',
            width: 65,
            height: 60,
            markup: [
                {
                    tagName: 'rect',
                    selector: 'body',
                },
                {
                    tagName: 'image',
                },
                {
                    tagName: 'text',
                    selector: 'label',
                },
            ],
            attrs: {
                body: {
                    stroke: '#ccc',
                    fill: '#ccc', //..
                },
                image: {
                    width: 28,
                    height: 28,
                    refX: 20,
                    refY: 12,
                },
                label: {
                    refX: 1,
                    refY: 48,
                    textAnchor: 'bottom',
                    textVerticalAnchor: 'top',
                    fontSize: 12,
                    fill: '#fff',
                },
            },
            ports: {
                groups: {
                    top: {
                        position: 'top',
                        attrs: {
                            circle: {
                                r: 4,
                                magnet: true,
                                stroke: '#5F95FF',
                                strokeWidth: 1,
                                fill: '#fff',
                                style: {
                                    visibility: 'hidden',
                                },
                            },
                        },
                    },
                    right: {
                        position: 'right',
                        attrs: {
                            circle: {
                                r: 4,
                                magnet: true,
                                stroke: '#5F95FF',
                                strokeWidth: 1,
                                fill: '#fff',
                                style: {
                                    visibility: 'hidden',
                                },
                            },
                        },
                    },
                    bottom: {
                        position: 'bottom',
                        attrs: {
                            circle: {
                                r: 4,
                                magnet: true,
                                stroke: '#5F95FF',
                                strokeWidth: 1,
                                fill: '#fff',
                                style: {
                                    visibility: 'hidden',
                                },
                            },
                        },
                    },
                    left: {
                        position: 'left',
                        attrs: {
                            circle: {
                                r: 4,
                                magnet: true,
                                stroke: '#5F95FF',
                                strokeWidth: 1,
                                fill: '#fff',
                                style: {
                                    visibility: 'hidden',
                                },
                            },
                        },
                    },
                },
            },
        },
        true,
    )

    //转换组件
    const convertDataList = [
        {
            label: '添加默认值',
            path: "addDefault",
            image: getImageUrl("../../assets/tool_image/information_add.svg"),
        },
        {
            label: '基本运算',
            path: "basicoPerations",
            image:
                getImageUrl("../../assets/tool_image/calculator.svg"),
        },
        {
            label: '脚本转换',
            path: "conversionScript",
            image:
                getImageUrl("../../assets/tool_image/script.svg"),
        },
        {
            label: '合并/拆分',
            path: "mergeSplit",
            image:
                getImageUrl("../../assets/tool_image/merge.svg"),
        },
        {
            label: '数字类型',
            path: "numberType",
            image:
                getImageUrl("../../assets/tool_image/script_1.svg"),
        },
        {
            label: '简单过滤',
            path: "simpleFiltering",
            image:
                getImageUrl("../../assets/tool_image/filter-records-fill.svg"),
        },
        {
            label: '时间格式',
            path: "timeConversion",
            image:
                getImageUrl("../../assets/tool_image/Date_time.svg"),
        },
    ]
    const convertNodes = convertDataList.map((item) =>
        graph.createNode({
            shape: 'custom-image',
            label: item.label,
            data: item.path,
            attrs: {
                image: {
                    'xlink:href': item.image,
                }
            },
            ports: {
                items: [
                    {
                        group: 'right',
                    },
                    {
                        group: 'left',
                    },
                ],
            }
        }),
        graph.on('node:dblclick', ({ cell }) => { // cell 基类对象 view 视图对象
            // 目标数据logic
            router.push({
                name: cell.data,
                query: {}
            })
        })
    )
    stencil.load(convertNodes, 'group1')
    //end


    const imageShapes = [
        {
            label: 'Excel',
            path: "Excel",
            image:
                getImageUrl("../../assets/tool_image/file-excel.svg"),
        },
        {
            label: 'CSV',
            path: "CSV",
            image:
                getImageUrl("../../assets/tool_image/CSV.svg"),
        },
        {
            label: 'JSON',
            path: "JSON",
            image:
                getImageUrl("../../assets/tool_image/json_1.svg"),
        },
        {
            label: 'Kafka',
            path: "Kafka",
            image:
                getImageUrl("../../assets/tool_image/Kafka_1.svg"),
        },
        {
            label: 'OWL文件',
            path: "OWL",
            image:
                getImageUrl("../../assets/tool_image/calculator_1.svg"),
        },
        {
            label: '日志文件',
            path: "Log",
            image:
                getImageUrl("../../assets/tool_image/console2.svg"),
        },
        {
            label: 'mongodb',
            path: "mongodb",
            image:
                getImageUrl("../../assets/tool_image/yunshujukuMongoDB.svg"),
        },
        {
            label: '表输入',
            path: "outside",
            image:
                getImageUrl("../../assets/tool_image/database.svg"),
        },
    ]
    const imageNodes = imageShapes.map((item) =>
        graph.createNode({
            shape: 'custom-image',
            label: item.label,
            data: item.path,
            attrs: {
                image: {
                    'xlink:href': item.image,
                },
            },
            ports: {
                items: [
                    {
                        group: 'right',
                    },
                ],
            }
        }),
        graph.on('node:dblclick', ({ cell }) => { // cell 基类对象 view 视图对象
            // 目标数据logic
            console.log(cell.data, 'aaa')
            router.push({
                name: cell.data,
                query: {}
            })
        })
    )
    stencil.load(imageNodes, 'group2')


    //output
    const outputDataList = [
        {
            label: '控制台',
            path: "consoleoutput",
            image:
                getImageUrl("../../assets/tool_image/console.svg"),
        },
        {
            label: 'Kafka',
            path: "kafkaoutput",
            image:
                getImageUrl("../../assets/tool_image/Kafka.svg"),
        },
        {
            label: 'mongodb',
            path: "mongodboutput",
            image:
                getImageUrl("../../assets/tool_image/mongo.svg"),
        },
        {
            label: '表',
            path: "tableOut",
            image:
                getImageUrl("../../assets/tool_image/database.svg"),
        }
    ]

    const outputNodes = outputDataList.map((item) =>
        graph.createNode({
            shape: 'custom-image',
            label: item.label,
            data: item.path,
            attrs: {
                image: {
                    'xlink:href': item.image,
                },
            },
            ports: {
                items: [
                    {
                        group: 'left',
                    },
                ],
            }
        }),
        graph.on('node:dblclick', ({ cell }) => { // cell 基类对象 view 视图对象
            // 目标数据logic
            console.log(cell.data, 'aaa')
            router.push({
                name: cell.data,
                query: {}
            })
        })
    )
    stencil.load(outputNodes, 'group3')
    // #endregion

    function preWork() {
        // 这里协助演示的代码,在实际项目中根据实际情况进行调整
        const container = document.getElementById('container')!
        const stencilContainer = document.createElement('div')
        stencilContainer.id = 'stencil'
        const graphContainer = document.createElement('div')
        graphContainer.id = 'graph-container'
        container.appendChild(stencilContainer)
        container.appendChild(graphContainer)

        insertCss(`
        #container {
      display: flex;
      border: 1px solid #dfe3e8;
    }
    #stencil {
      width: 200px;
      height: 100%;
      position: relative;
      border-right: 1px solid #dfe3e8;
    }
    #graph-container {
      width: calc(100% - 180px);
      height: 100%;
    }
    .x6-widget-stencil  {
      background-color: #fff;
    }
    .x6-widget-stencil-title {
      background-color: #fff;
    }
    .x6-widget-stencil-group-title {
      background-color: #fff !important;
    }
    .x6-widget-transform {
      margin: -1px 0 0 -1px;
      padding: 0px;
      border: 1px solid #239edd;
    }
    .x6-widget-transform > div {
      border: 1px solid #239edd;
    }
    .x6-widget-transform > div:hover {
      background-color: #3dafe4;
    }
    .x6-widget-transform-active-handle {
      background-color: #3dafe4;
    }
    .x6-widget-transform-resize {
      border-radius: 0;
    }
    .x6-widget-selection-inner {
      border: 1px solid #239edd;
    }
    .x6-widget-selection-box {
      opacity: 0;
    }
  `)
    }
})


</script>
  
<style scoped lang="less">
#container {
    width: 100%;
    height: 100vh;
    overflow: hidden !important;
    display: flex;
    justify-content: center;
}
</style>

本文来自互联网用户投稿,该文观点仅代表作者本人,不代表本站立场。本站仅提供信息存储空间服务,不拥有所有权,不承担相关法律责任。如若转载,请注明出处:http://www.coloradmin.cn/o/739996.html

如若内容造成侵权/违法违规/事实不符,请联系多彩编程网进行投诉反馈,一经查实,立即删除!

相关文章

港联证券|dmi指标的用法和实战技巧?

DMI指标是一种技术分析工具&#xff0c;可用于评估股票、期货和外汇市场的趋势强度。DMI指标由三条线组成&#xff0c;分别是DI&#xff08;上升方向指标&#xff09;、-DI&#xff08;下降方向指标&#xff09;和ADX&#xff08;平均趋向指数&#xff09;。在使用DMI指标之前&…

Unity DOTS纯ECS实现虚拟摇杆Joystick控制角色移动

上篇已经实现了ECS框架下的IBeginDragHandler、IDragHandler、IEndDragHandler这几个拖动事件&#xff0c;使得可以任意给ECS框架下的UI(2D entity)响应拖动事件。本篇分享下在前篇实现的功能的基础上再实现一个常用的摇杆控制角色移动的功能。 需要注意的一点&#xff0c;目前…

[数据分析与可视化] 基于matplotlib和plottable库绘制精美表格

plottable是一个Python库&#xff0c;用于在matplotlib中绘制精美定制的图形表格。plottable的官方仓库地址为&#xff1a;plottable。本文主要参考其官方文档&#xff0c;plottable的官方文档地址为&#xff1a;plottable-doc。plottable安装命令如下&#xff1a; pip install…

猿人web学刷题18

1.第十八题 jsvmp - 猿人学 问题: 1.第一页请求正常能返回数据 2.第二页开始之后出现{"error": "Unexpected token/Validation failed"} 分析&#xff1a; 1.第二页开始&#xff0c;有带加密参数&#xff0c;直接重发请求无果&#xff0c;应该带了时间戳…

尚硅谷Docker实战教程-笔记11【高级篇,Docker网络】

尚硅谷大数据技术-教程-学习路线-笔记汇总表【课程资料下载】视频地址&#xff1a;尚硅谷Docker实战教程&#xff08;docker教程天花板&#xff09;_哔哩哔哩_bilibili 尚硅谷Docker实战教程-笔记01【基础篇&#xff0c;Docker理念简介、官网介绍、平台入门图解、平台架构图解】…

盛格塾暑期公益课程《学活LINUX》

学习LINUX有很多种方法&#xff0c;本系列课程以动手试验为主&#xff0c;取一个活的LINUX系统&#xff08;GDK8&#xff09;作为目标&#xff0c;使用内核调试器&#xff08;挥码枪&#xff09;将其中断到调试器&#xff0c;在调试器的帮助下&#xff0c;观察调用过程、执行现…

【1++的Linux】之基础开发工具

&#x1f44d;作者主页&#xff1a;进击的1 &#x1f929; 专栏链接&#xff1a;【1的Linux】 文章目录 一&#xff0c;Linux软件包管理管理器二&#xff0c;Linux编辑器--vim2.1 什么是vim2.2 vim的基本操作 三&#xff0c;gcc的使用四&#xff0c;gdb的使用五&#xff0c;项目…

课时7:Trustzone基础知识

快速链接: . 👉👉👉 个人博客笔记导读目录(全部) 👈👈👈 付费专栏-付费课程 【购买须知】:Secureboot从入门到精通-[目录] 👈👈👈目录 Trustzone安全扩展双系统架构Trustone架构多方位支持的安全

探索Gradio库中的Textbox模块及其强大功能

❤️觉得内容不错的话&#xff0c;欢迎点赞收藏加关注&#x1f60a;&#x1f60a;&#x1f60a;&#xff0c;后续会继续输入更多优质内容❤️ &#x1f449;有问题欢迎大家加关注私戳或者评论&#xff08;包括但不限于NLP算法相关&#xff0c;linux学习相关&#xff0c;读研读博…

作用域、垃圾回收机制、闭包、构造函数

作用域 作用域规定了变量能够被访问的 ‘范围’&#xff0c;离开了这个范围变量便不能被访问 分为&#xff1a; 局部作用域 函数作用域块级作用域 let/const 全局作用域 作用域链 嵌套关系的作用域串联起来形成了作用域链 作用:作用域链本质上是底层的变量的查找机制 函…

简写MKL库windows安装以及python如何调用dll库

MKL安装: 最新MKL库下载地址 Donwload: Accelerate Fast Math with Intel oneAPI Math Kernel Library 64位以及32位我直接都安装了 之后配置各种包含目录以及环境变量&#xff1a;网上有很多配置vs的配置教程&#xff0c;这里就不贴了。 &#xff08;ps: 2023 在vs2019上&a…

nodejs高级编程-核心模块

一、path 1 获取路径中的基础名称 const path require(path)// console.log(__filename) // /Users/liuchongyang/Desktop/分享/网页读取本地文件/node.js// 1 获取路径中的基础名称 /*** 01 返回的就是接收路径当中的最后一部分 * 02 第二个参数表示扩展名&#xff0c;如果…

手把手教-单片机stm32基于w25q128使用文件系统

一、开发测试环境 ①野火stm32f407开发板 ②rtthread操作系统 W25Q128的电路原理图&#xff1a; 二、开发步骤 ①使能spi驱动。 ②使能spi bus/device 驱动&#xff0c;选择sfud驱动。 ③开启dfs功能&#xff0c;选择elm文件系统。 ④保存&#xff0c;重新生成工程。 ⑤下载到…

VueCli 脚手架使用

VueCli 脚手架 到目前为止&#xff0c;已经会了Vue基本使用&#xff08;去创建vue实例&#xff0c;创建之后再去挂载&#xff0c;挂载之后就去使用各种功能&#xff0c;挂载之后就可以使用其各种功能&#xff0c;data methods compute 以及各个生命周期&#xff0c;常用的属性以…

779. 最长公共字符串后缀

题面&#xff1a; 给出若干个字符串&#xff0c;输出这些字符串的最长公共后缀。 输入格式 由若干组输入组成。 每组输入的第一行是一个整数 NN。 NN 为 00 时表示输入结束&#xff0c;否则后面会继续有 NN 行输入&#xff0c;每行是一个字符串&#xff08;字符串内不含空白符&…

Redis深入 —— 持久化和事务

前言 最近的学习中&#xff0c;荔枝深入了解了Redis的持久化、Redis事务相关的知识点并整理相应的学习笔记&#xff0c;在这篇文章中荔枝也主要梳理了相应的笔记和基本知识&#xff0c;小伙伴们如果需要的话可以看看哈。 文章目录 前言 一、Redis持久化 1.1 RDB 1.1.1 Redi…

掌握驱动之道:L298N模块多方式驱动电机的优劣分析

L298N模块是一种常用的直流电机驱动模块&#xff0c;它可以通过控制输入端口来实现对电机的速度和方向的控制。L298N模块有3个输入端口&#xff1a;IN1、IN2和EN。 方法一&#xff1a;使用高级定时器输出通道和互补输出通道控制电机 将模块的IN1和IN2分别连接到STM32高级定时器…

Python GUI编程利器:Tkinker中的事件处理(11)

​ 小朋友们好&#xff0c;大朋友们好&#xff01; 我是猫妹&#xff0c;一名爱上Python编程的小学生。 和猫妹学Python&#xff0c;一起趣味学编程。 今日目标 学习下事件处理的相关知识点&#xff1a; 事件处理四要素 事件序列 事件绑定 今天要实现如下效果&#xff1…

Java在Excel中进行数据分析

摘要&#xff1a;本文由葡萄城技术团队于CSDN原创并首发。转载请注明出处&#xff1a;葡萄城官网&#xff0c;葡萄城为开发者提供专业的开发工具、解决方案和服务&#xff0c;赋能开发者。 前一段时间淘宝出了一个“淘宝人生”的模块&#xff0c;可以看从注册淘宝账号至今的消…

k8s实战3-使用Helm在AKS上发布应用

AKS(Azure Kubenetes Service)是微软云azure上的K8s服务。 主要分为三步 1 连接到AKS 2 用kubectl发布应用 3 用Helm发布应用 1 登录 az login 2 连接dp-npr-dsm-aks&#xff08;Dsm项目的AKS&#xff09; az account set --subscription {{subID}} az aks get-credent…