QT-qcustomplot应用示例
- 前言
- 一、演示效果
- 二、关键程序
- 三、资源链接
前言
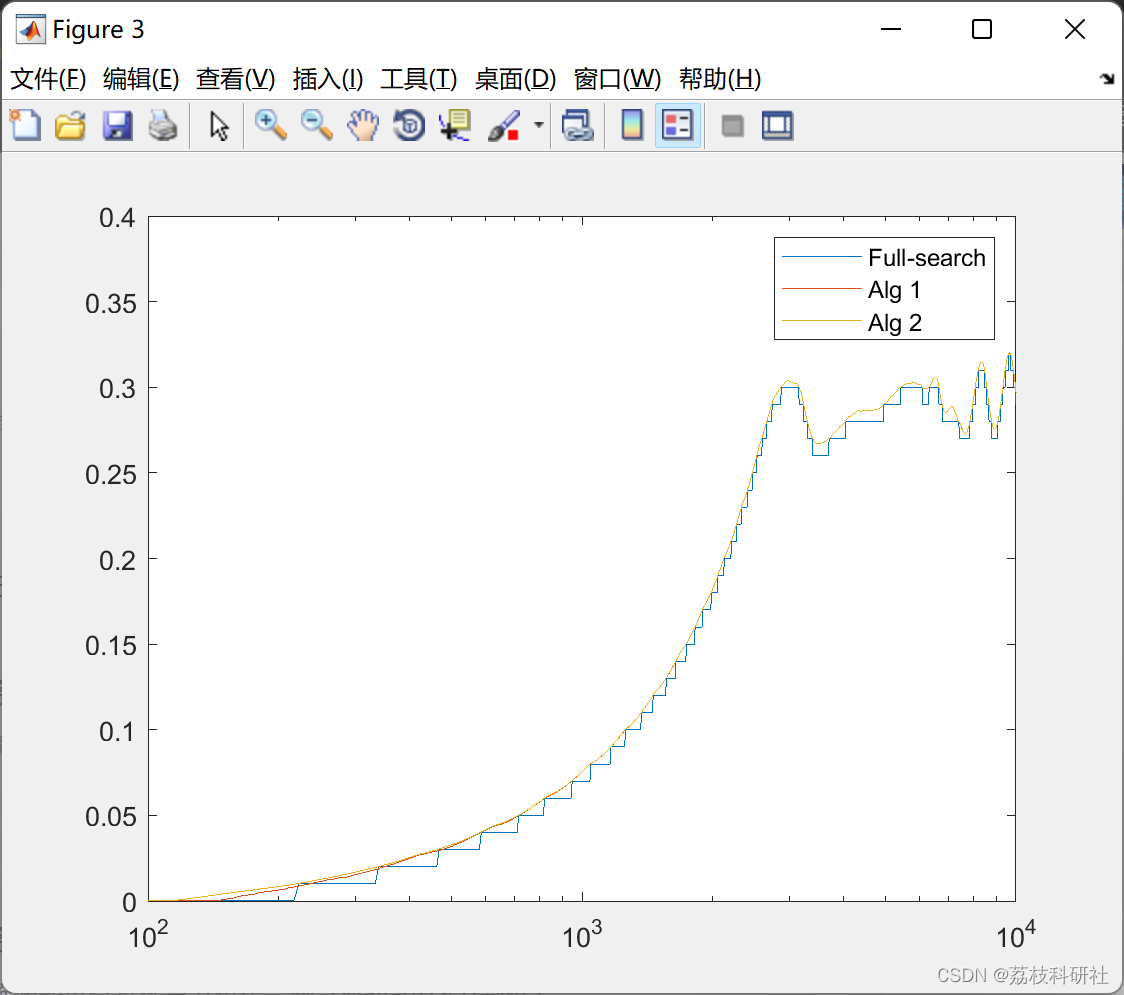
提供曲线显示示例过程
一、演示效果
二、关键程序
// 生成曲线图
void QtWidgetsApplication1::setupQuadratic()
{
	if (m_strViewMachineIndexList.size() <= 0)
		return;

	// 进度条默认0
	ui.progressBar->setValue(0);

	// 算每个机器显示要多少值
	int nProgessItem = 100 / m_strViewMachineIndexList.size();
	int nProgessValue = 0;

	auto customPlot = ui.customPlot;
	double fMinX = 100, fMaxX = -1;
	double fMinY = 100, fMaxY = -1;

	int nGraphIndex = -1;

	m_strXValueList.removeOne("");
	int nIndexColor=0;

	// 初始化图像显示
	customPlot->clearGraphs();
	customPlot->clearItems();
	customPlot->clearPlottables();

	// 颜色控件不可见
	for (int i = 0; i < m_pLabelList.size(); i++)
	{
		m_pLabelList[i]->setVisible(false);
		m_pFrameList[i]->setVisible(false);
	}

	// 根据要显示多个图像,再设置显示多少个颜色控件
	for (int i = 0; i < m_strViewMachineIndexList.size(); i++)
	{
		if (i >= m_pFrameList.size() || i >= m_pLabelList.size())
		{
			continue;
		}

		m_pLabelList[i]->setVisible(true);
		m_pFrameList[i]->setVisible(true);
		m_pLabelList[i]->setText(QString(u8"图像[%1]").arg(m_strViewMachineIndexList[i].toInt()));
	}

	// 遍历所有的机器
	for (size_t iMachine = 0; iMachine < m_strXValueList.size(); iMachine++)
	{
		// 如果不是选择的机器内的就不处理
		if (!m_strViewMachineIndexList.contains(QString("%1").arg(iMachine+1)))
		{
			continue;
		}

		// 获取曲线要显示的颜色
		QColor color;
		if (nIndexColor < m_colorList.size())
			color = m_colorList[nIndexColor++];

		// 按“ 2 ”切分字符
		QString strLine = m_strXValueList[iMachine];
		QStringList str2List = strLine.split(" 2 ");

		qDebug() << QString(u8"X[%1]:%2").arg(iMachine).arg(strLine);
		QString strLogX;
		QString strLogY;


		// 用来计算虚线过渡的显示
		QStringList strXTranList;
		QStringList strYTranList;
		for (size_t i = 0; i < str2List.size(); i++)
		{
			int nNext = i + 1;
			if (nNext < str2List.size())
			{
				QString str0 = str2List[i].split(" ").takeLast();
				QString str1 = str2List[nNext].split(" ").takeFirst();

				strXTranList << str0 << str1;
			}
		}

		int nPenSize = 2;   // 画曲线画笔的大小
		double fAe = 0;
		double fPm = 0;

		// 开始画
		for (size_t i2 = 0; i2 < str2List.size(); i2++)
		{
			if (i2 != 0)
				fPm++;

			double fFreeTime = 0;  // 空闲累计时间
			QStringList str1List = str2List[i2].split(" ");
			double dBeginValue = 0;
			double dAeTemp = 0;
			double dLastYValue = 0;   // 上一个Y值,主要是用来画空闲时间

			// 获取第一个首元素,X值需要做偏执
			dBeginValue = str2List[i2].split(" ").takeFirst().toDouble();

			str1List.removeOne("");
			for (int i1 = 0; i1 < str1List.size(); i1++)
			{
				bool bEnablFreeTime = false; // 判断当前是否再空闲时间区间内
				if (str1List[i1] == "1" && (i1-1)>=0 )
				{
					if (true)
					{
						// 画空闲直线
						int nCount = 2;
						QVector<double> x(nCount), y(nCount);
						x[0] = str1List[i1-1].toDouble();
						y[0] = dLastYValue;
						x[1] = str1List[i1 + 1].toDouble();
						y[1] = dLastYValue;

						nGraphIndex++;
						customPlot->addGraph();
						customPlot->graph(nGraphIndex)->setData(x, y);
						QPen pen;
						pen.setWidthF(nPenSize);
						pen.setColor(color);
						customPlot->graph(nGraphIndex)->setPen(pen);
					}

					// 遍历到1直接跳过
					continue;
				}
				int jNext = i1 + 1;
				if (jNext >= str1List.size())
				{
					// 越界
					break;
				}

				// 如果下个是1,继续获取
				if (str1List[jNext] == "1")
				{
					bEnablFreeTime = true;
					jNext += 1;
					if (jNext >= str1List.size())
					{
						break;
					}

				}

				double fX[2] = { 0 };
				double fY[2] = { 0 };

				// 更加X坐标获取Y轴
				fX[0] = str1List[i1].toDouble();
				fX[1] = str1List[jNext].toDouble();

				if (bEnablFreeTime)
				{
					fFreeTime = fFreeTime + (fX[1]-fX[0]);
					// 获取到空闲时间后返回
					continue;
				}
				fY[0] = getYValue(iMachine, fX[0] - dBeginValue - fFreeTime, fPm, fAe,true);
				fY[1] = getYValue(iMachine, fX[1] - dBeginValue - fFreeTime, fPm, fAe, true);

				dLastYValue = fY[1];

				strLogX = strLogX + QString("%1").arg(fX[0]) + " " + QString("%1").arg(fX[1]) + " ";
				strLogY = strLogY + QString("%1").arg(fY[0]) + " " + QString("%1").arg(fY[1]) + " ";

				if (strXTranList.contains(str1List[i1]))
					strYTranList << QString("%1").arg(fY[0]);

				if (strXTranList.contains(str1List[jNext]))
					strYTranList << QString("%1").arg(fY[1]);

				if (abs(fY[1] - fY[0]) < 0.01)
				{
					// 相等
					// 画直线
					int nCount = 2;
					QVector<double> x(nCount), y(nCount);
					x[0] = fX[0];
					y[0] = fY[0];
					x[1] = fX[1];
					y[1] = fY[1];

					nGraphIndex++;
					customPlot->addGraph();
					customPlot->graph(nGraphIndex)->setData(x, y);
					QPen pen;
					pen.setWidthF(nPenSize);
					pen.setColor(color);
					customPlot->graph(nGraphIndex)->setPen(pen);
				}
				else
				{
					// 画弧形
					int nCount = fX[1] - fX[0];

					// 做线段切分
					QVector<double> x(nCount), y(nCount);
					for (int i = 0; i < nCount; ++i)
					{
						x[i] = fX[0] + i;
						y[i] = getYValue(iMachine, x[i] - dBeginValue - fFreeTime, fPm, fAe);
					}

					nGraphIndex++;
					customPlot->addGraph();
					customPlot->graph(nGraphIndex)->setData(x, y);
					QPen pen;
					pen.setWidthF(nPenSize);
					pen.setColor(color);
					customPlot->graph(nGraphIndex)->setPen(pen);
				}

				// 累计机器的运行时间
				if (!bEnablFreeTime)
				{
					// 累计ae的值
					dAeTemp = dAeTemp + (fX[1] - fX[0]);
				}


				// 获取X,Y轴最大值和最小值
				for (int  j = 0; j < 2; j++)
				{
					if (fX[j] > fMaxX)
						fMaxX = fX[j];

					if (fX[j] < fMinX)
						fMinX = fX[j];

					if (fY[j] > fMaxY)
						fMaxY = fY[j];

					if (fY[j] < fMinY)
						fMinY = fY[j];
				}
			}

			fAe = dAeTemp;
		}

		// 画过度线
		if (strXTranList.size() == strYTranList.size()
			&& strXTranList.size() > 0)
		{
			for (size_t i = 0; i < strXTranList.size(); i+=2)
			{
				int iNext = i + 1;
				if (iNext < strXTranList.size())
				{
					// 画直线
					int nCount = 2;
					QVector<double> x(nCount), y(nCount);
					x[0] = strXTranList[i].toDouble();
					y[0] = strYTranList[i].toDouble();
					x[1] = strXTranList[iNext].toDouble();
					y[1] = strYTranList[i].toDouble();

					// 第一条虚线
					nGraphIndex++;
					customPlot->addGraph();
					customPlot->graph(nGraphIndex)->setData(x, y);
					QPen pen;
					pen.setWidthF(1);
					pen.setStyle(Qt::PenStyle::DashLine);
					pen.setColor(Qt::gray);
					customPlot->graph(nGraphIndex)->setPen(pen);

					// 第二条虚线
					x[0] = strXTranList[iNext].toDouble();
					y[0] = strYTranList[i].toDouble();
					x[1] = strXTranList[iNext].toDouble();
					y[1] = strYTranList[iNext].toDouble();
					nGraphIndex++;
					customPlot->addGraph();
					customPlot->graph(nGraphIndex)->setData(x, y);
					customPlot->graph(nGraphIndex)->setPen(pen);
					customPlot->graph(nGraphIndex)->setPen(pen);
				}
			}
		}

		nProgessValue += nProgessItem;
		ui.progressBar->setValue(nProgessValue);

		qDebug() << QString(u8"strLogX[%1]:%2").arg(iMachine).arg(strLogX);
		qDebug() << QString(u8"strLogY[%1]:%2").arg(iMachine).arg(strLogY) << "\n";


	}

	customPlot->xAxis->setLabel(u8"加工时间/t");
	customPlot->yAxis->setLabel(u8"健康评价函数值");

	customPlot->xAxis->setRange(fMinX, fMaxX);
	customPlot->yAxis->setRange(0, 1);
	customPlot->replot();
	ui.progressBar->setValue(100);

}

bool QtWidgetsApplication1::openFile(QString strPath)
{
	if (!strPath.isEmpty())
	{
		QFile file(strPath);
		if (file.open(QIODevice::ReadOnly | QIODevice::Text))
		{
			m_strXValueList.clear();
			QTextStream in(&file);
			while (!in.atEnd())
			{
				QString strLine = in.readLine();

				// 如果是“****”就不要
				if (strLine.indexOf("*") != -1)
					continue;

				if (!strLine.isEmpty())
					m_strXValueList << strLine;
			}

			file.close();
		}
	}

	if (m_strXValueList.size() == 0)
	{
		return false;
	}

	// 按照4组来
	int nSize = m_strXValueList.size() / 4;

	// 计算每组多少个机器
	int nCount = m_strXValueList.size() / nSize;

	// 看看有没除不尽的
	int nLeaveCount = m_strXValueList.size() % nSize;

	// 创建做多需要显示不同的颜色
	while (m_pHBoxLayoutList.size() < nSize)
	{
		// 创建水平布局
		auto pHbox = new QHBoxLayout(this);
		m_pHBoxLayoutList << pHbox;
		int nNum = m_pHBoxLayoutList.size();

		// 创建文本
		auto pLabel = new QLabel(QString("%1").arg(nNum), this);
		pLabel->setObjectName(QString("%1").arg(nNum));
		m_pLabelList << pLabel;

		// 生成随机颜色
		int r = rand() % 256;
		int g = rand() % 256;
		int b = rand() % 256;

		// 创建颜色显示
		auto pFrame = new QFrame(this);
		pFrame->setFixedSize(70, 30);
		pFrame->setStyleSheet(QString("background-color: rgb(%1, %2, %3);").arg(r).arg(g).arg(b));
		m_pFrameList << pFrame;
		m_colorList << QColor(qRgb(r, g, b));

		// 先进行水平布局
		pHbox->addWidget(pLabel);
		pHbox->addWidget(pFrame);
		pHbox->addStretch();

		// 将水平布局添加垂直布局
		m_pVBoxLayout->addLayout(pHbox);
		m_pVBoxLayout->addStretch();

	}


	// 显示单元项
	ui.listWidget->setStyleSheet("QListWidget::item { margin-bottom: 10px; }");
	ui.listWidget->clear();
	for (int i = 0; i < nCount; i++)
	{
		if (i == (nCount - 1) && nLeaveCount != 0)
			ui.listWidget->addItem(QString(u8"图像[%1~%2]").arg(i*nSize + 1).arg(i*nSize + nLeaveCount));
		else
			ui.listWidget->addItem(QString(u8"图像[%1~%2]").arg(i*nSize + 1).arg(i*nSize + nSize));
	}

	// 刷新X值列表显示
	updateTableWidget();

	// 设置默认显示
	int nDefalutIndex = 0;
	if (nDefalutIndex < ui.listWidget->count())
	{
		QListWidgetItem *item = ui.listWidget->item(nDefalutIndex);
		ui.listWidget->setCurrentItem(item);
	}

	// 先隐藏颜色控件不可见
	for (int i = 0; i < m_pLabelList.size(); i++)
	{
		m_pLabelList[i]->setVisible(false);
		m_pFrameList[i]->setVisible(false);
	}

	return true;
}
三、资源链接
https://download.csdn.net/download/u013083044/88027002