文章目录
- 一、监控进程
- 二、监控日志
- 三、监控mysql主从
- 四、监控mysql延迟
一、监控进程
- 示例:监控客户端上的httpd服务进程,当进程书少于1时,说明服务已经挂掉,需要及时处理。
1.客户端开启自定义监控功能。
vim  /usr/local/etc/zabbix_agentd.conf
UnsafeUserParameters=1       //设置为1,说明已开启功能。
UserParameter=<key>,<shell command>    //配置监控指标key,是和web中的监控项配置key对应的,shell comand是取出监控的指标,可以指定脚本来取。
2.客户端创建脚本目录和脚本文件
//写脚本。当进程数=0时,代表服务有问题,返回1;当进程数不等于0时,代表服务进程存在,是正常的返回0。
cat /opt/scripts/check_process.sh
#!/bin/bash
count=$(ps -ef|grep -Ev "grep|$0"|grep $1|wc -l)
if [ $count -eq 0 ];then
    echo '1'
else
    echo '0'
fi

//脚本添加执行权限。
chmod +x /opt/scripts/check_process.sh

//修改脚本属主属组。
chown -R zabbix.zabbix /opt/scripts/check_process.sh
3.测试脚本能否正常检测。

4.客户端配置文件定义key。
vim /usr/local/etc/zabbix_agentd.conf
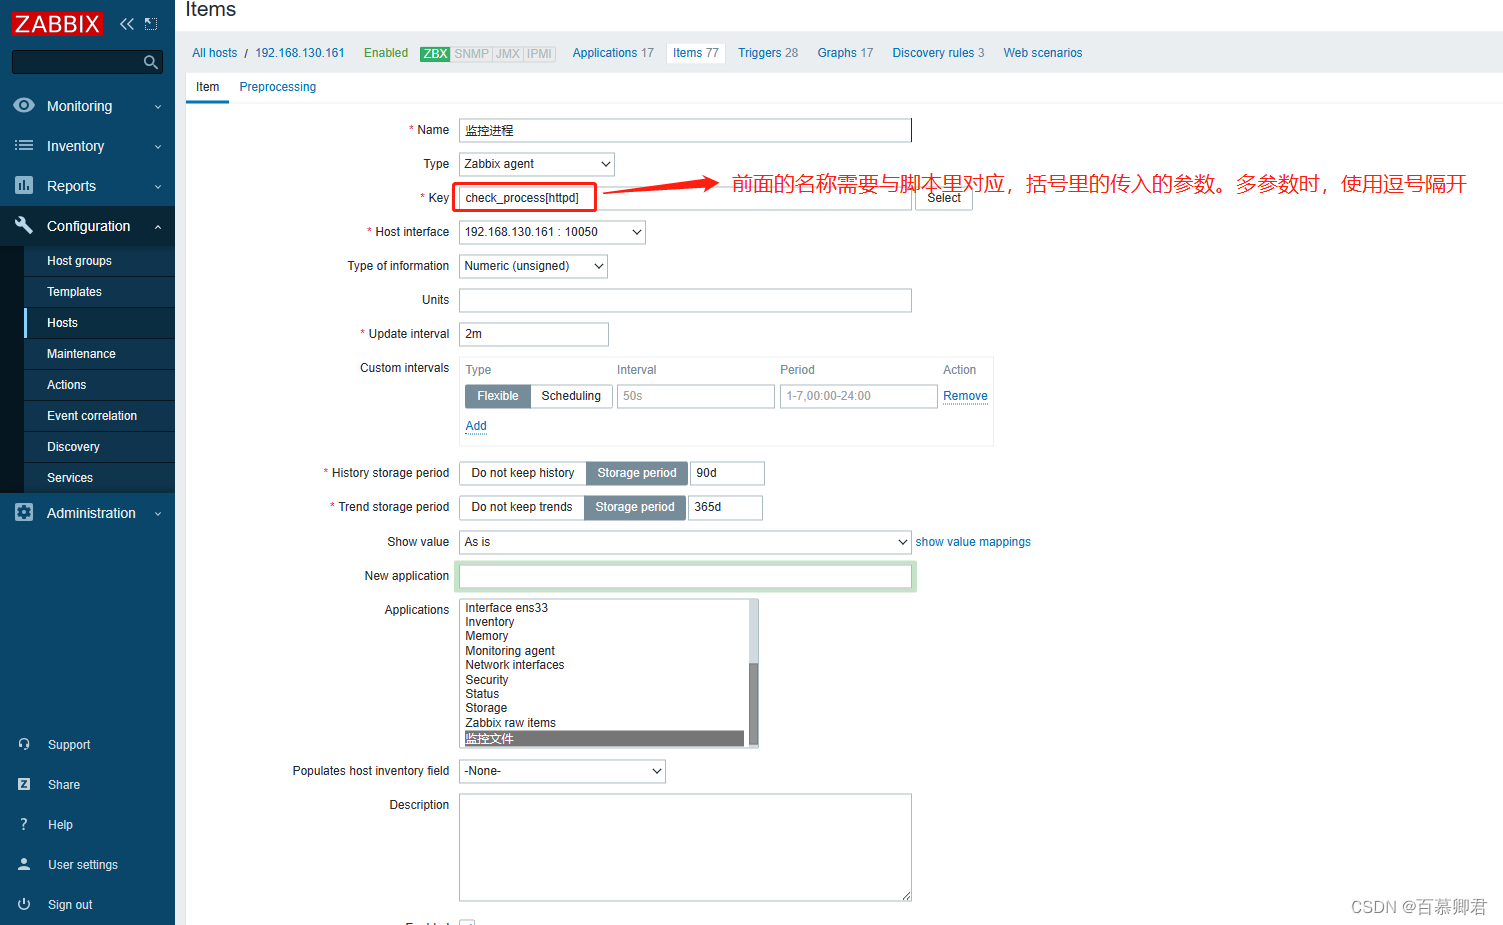
//check_process为自定义名称,需要与web页面的监控项一一对应。
//[*]表示传入的参数key,需要监控的key,也是脚本里取出来的值。
//后面指定监控脚本,$1表示传入的参数服务,在web页面进行定义传入。当需要监控多个进程时,则添加$2、$3...即可,在web页面里配置时需要使用逗号隔开。
UserParameter=check_process[*],/bin/bash /scripts/check_process.sh $1
5.重启客户端服务。
pkill zabbix
zabbix_agentd
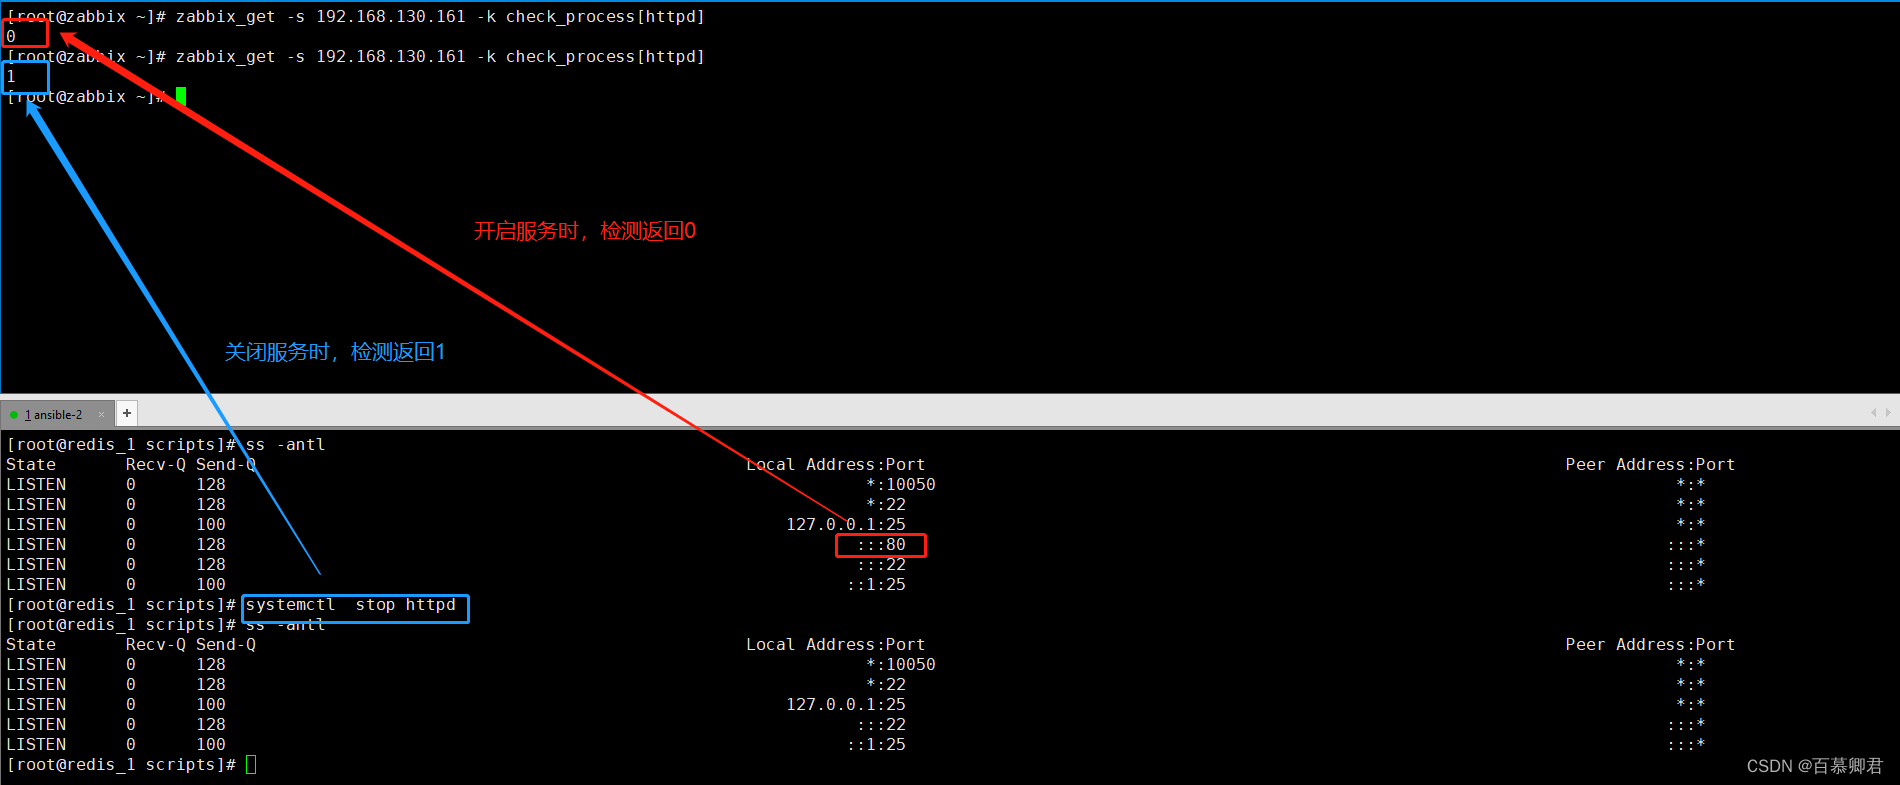
6.服务端测试脚本是否能正常检测。
//服务端命令检测。
zabbix_get -s 192.168.130.161 -k check_process[httpd]
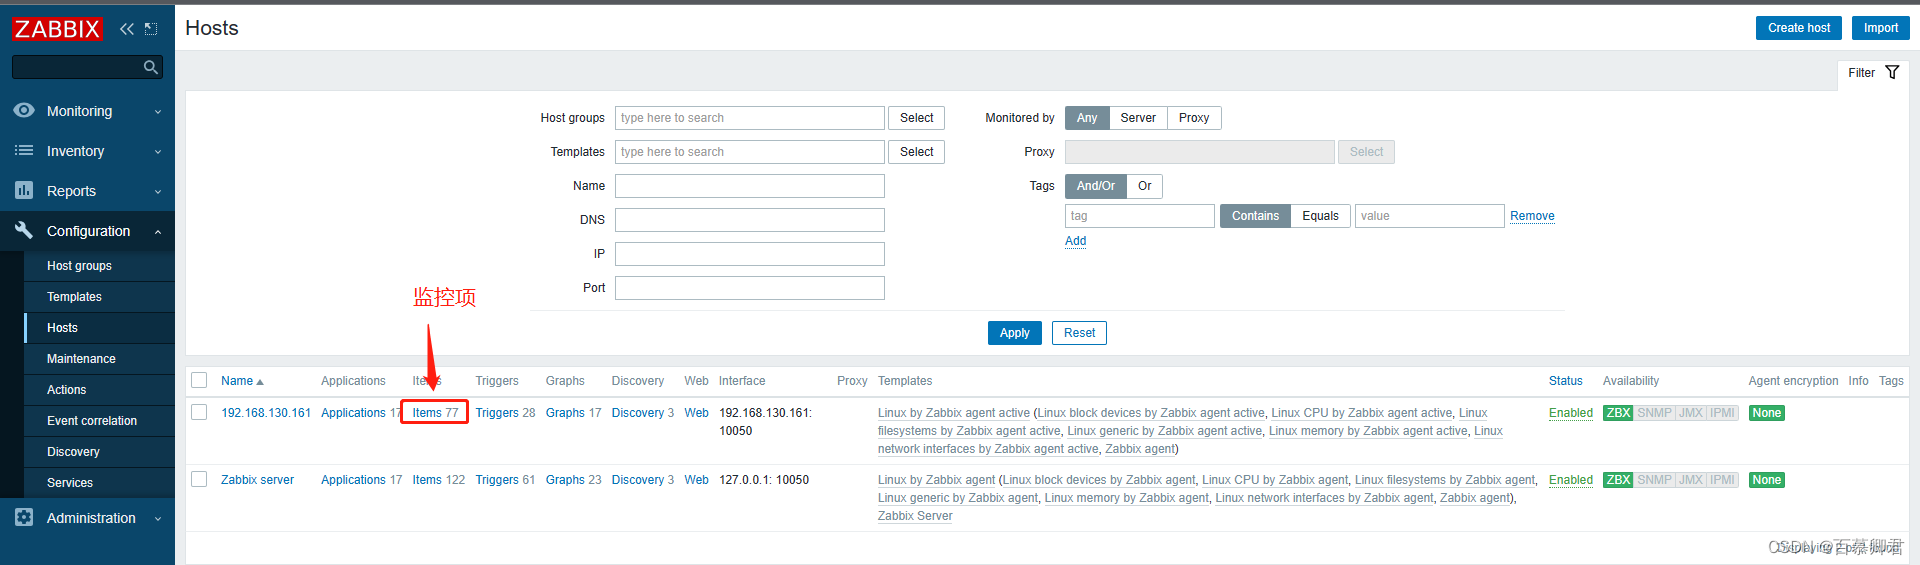
7.配置zabbix监控项。
8.添加触发器。


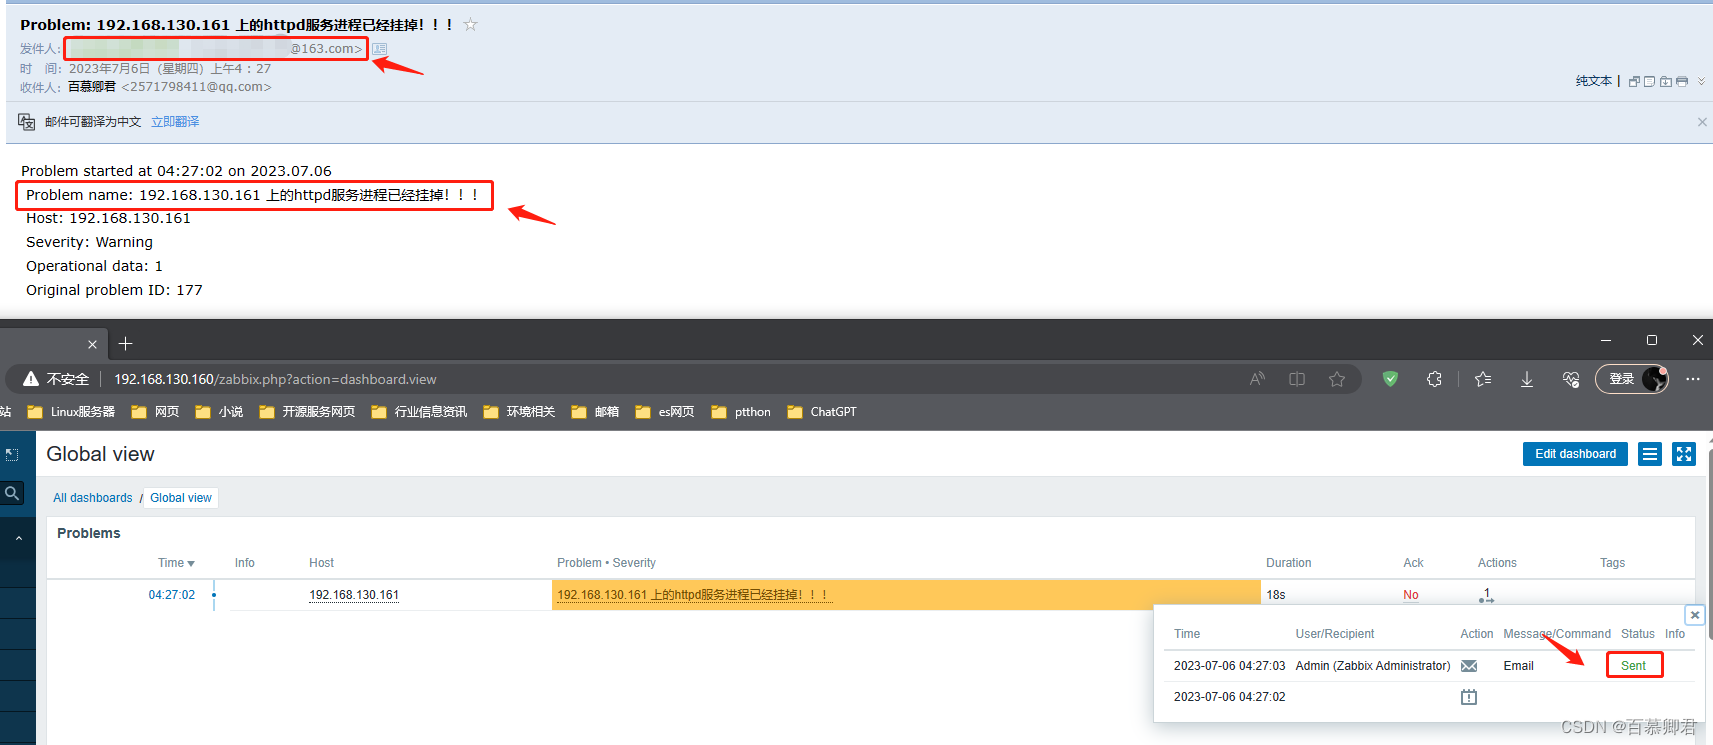
9.客户端关闭httpd服务,触发规则,验证结果。
systemctl stop httpd
二、监控日志
1.客户端开启自定义监控功能。
vim  /usr/local/etc/zabbix_agentd.conf
UnsafeUserParameters=1       //设置为1,说明已开启功能。
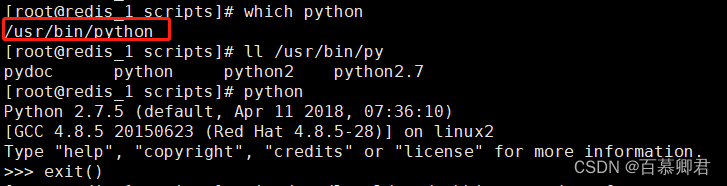
2.编写监控日志的python脚本,客户都安需要有python环境。
#!/usr/bin/env python3
import sys
import re

def prePos(seekfile):
    global curpos
    try:
        cf = open(seekfile)
    except IOError:
        curpos = 0
        return curpos
    except FileNotFoundError:
        curpos = 0
        return curpos
    else:
        try:
            curpos = int(cf.readline().strip())
        except ValueError:
            curpos = 0
            cf.close()
            return curpos
        cf.close()
    return curpos

def lastPos(filename):
    with open(filename) as lfile:
        if lfile.readline():
            lfile.seek(0,2)
        else:
            return 0
        lastPos = lfile.tell()
    return lastPos

def getSeekFile():
    try:
        seekfile = sys.argv[2]
    except IndexError:
        seekfile = '/tmp/logseek'
    return seekfile

def getKey():
    try:
        tagKey = str(sys.argv[3])
    except IndexError:
        tagKey = 'Error'
    return tagKey

def getResult(filename,seekfile,tagkey):
    destPos = prePos(seekfile)
    curPos = lastPos(filename)

    if curPos < destPos:
        curpos = 0

    try:
        f = open(filename)
    except IOError:
        print('Could not open file: %s' % filename)
    except FileNotFoundError:
        print('Could not open file: %s' % filename)
    else:
        f.seek(destPos)

        while curPos != 0 and f.tell() < curPos:
            rresult = f.readline().strip()
            global result
            if re.search(tagkey, rresult):
                result = 1
                break
            else:
                result = 0

        with open(seekfile,'w') as sf:
            sf.write(str(curPos))
    finally:
        f.close()
    return result

if __name__ == "__main__":
    result = 0
    curpos = 0
    tagkey = getKey()
    seekfile = getSeekFile()
    result = getResult(sys.argv[1],seekfile,tagkey)
    print(result)
3.客户端配置文件添加脚本监控配置。
vim /usr/local/etc/zabbix_agentd.conf

UserParameter=check_log[*],/usr/bin/python /opt/scripts/log.py $1 $2 $3
4.重启客户端agentd服务。
pkill zabbix
zabbix_agentd
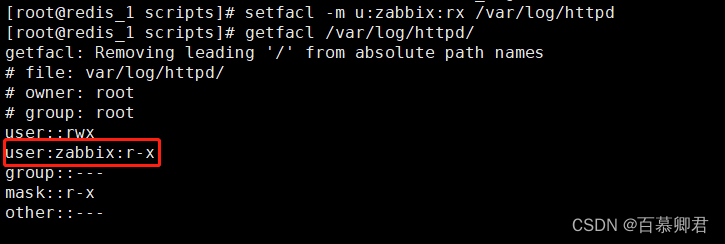
5.错误日志设置权限,使zabbix用户能够对该文件进行读、执行。
setfacl -m u:zabbix:rx /var/log/httpd
6.服务端验证脚本是否能正常监控。
//客户端追加错误参数
echo 'failed' >> /var/log/httpd/error_log

//服务端测试。1表示有错误,0表示正常。
//括号内容为:第一个为监控哪个文件;第二个为自定义记录错误日志中的具体位置文件存放路径;第三个参数为定义一个关键字。
zabbix_get -s 192.168.130.161 -k check_log[/var/log/httpd/error_log,/tmp/position,failed]

//测试产生的错误日志记录位置文件,此时记录到4003行。
cat /tmp/position
4003
7.创建监控项。

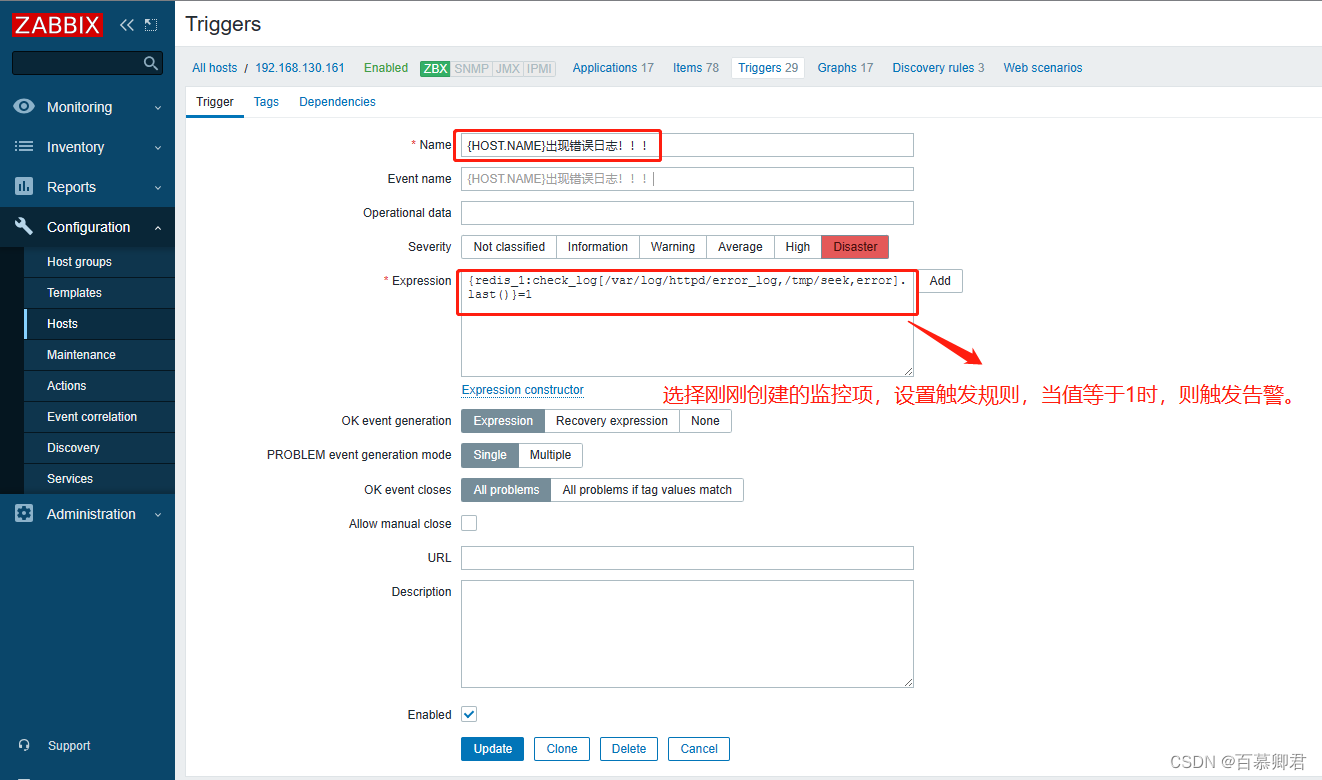
8.添加触发器。
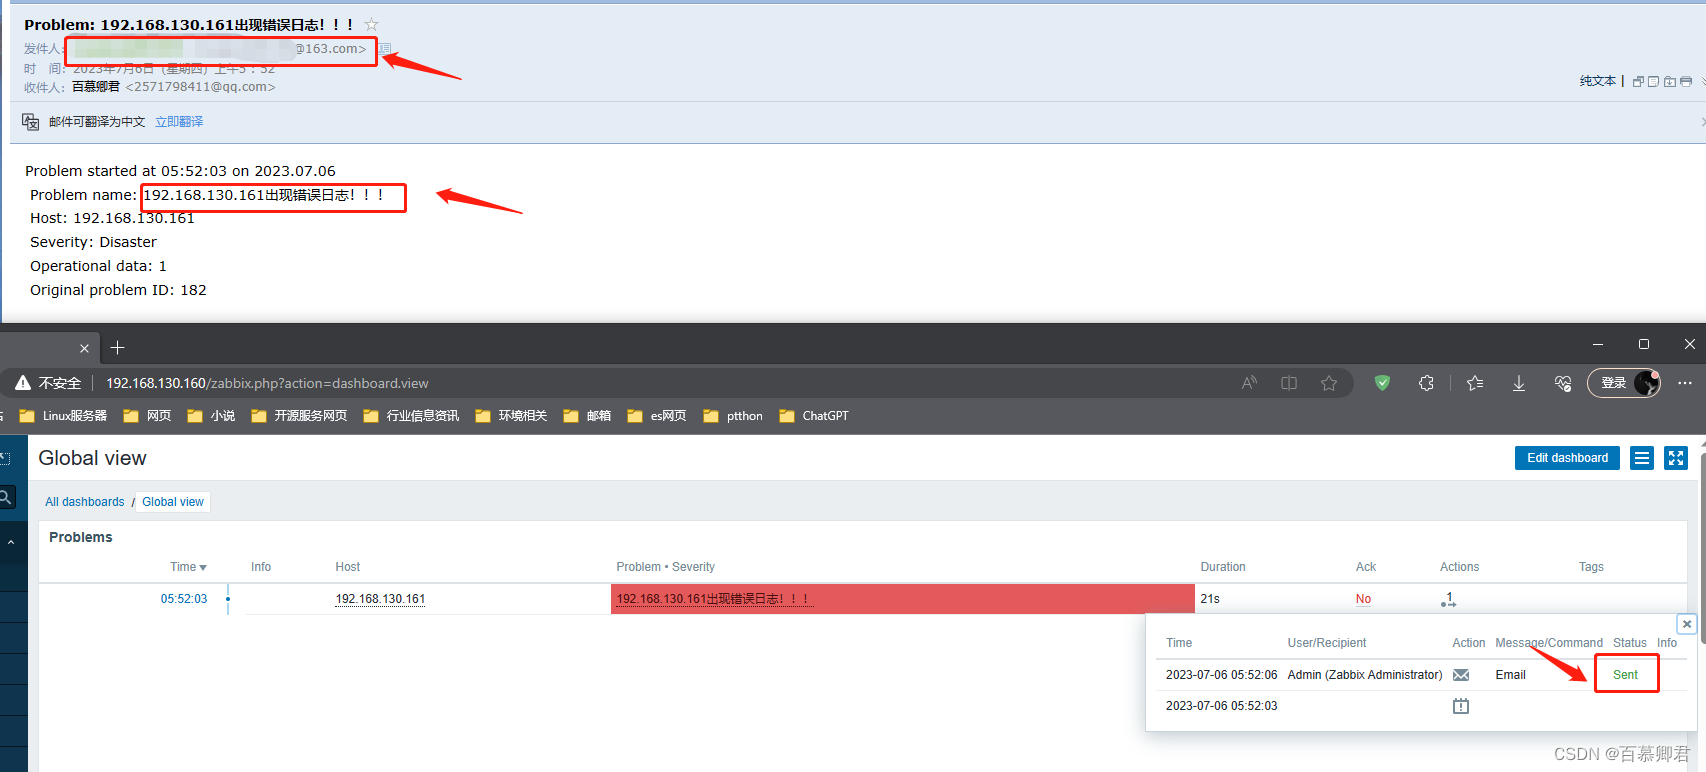
9.客户端追加关键词触发告警,验证效果。
echo 'error' >> /var/log/httpd/error_log
三、监控mysql主从
环境说明:
| 环境 | IP | 要安装的应用 |
|---|---|---|
| zabbix服务端 | 192.168.130.160 | lamp架构 zabbix server zabbix agent |
| mysql从 zabbix客户端 | 192.168.130.161 | mariadb* abbix_agentd |
| mysql主 | 192.168.130.162 | mariadb* |
1.提前主备mysql主从,监控mysql从主机,参考文章。需要保证登录数据库没有告警密码暴露问题,若是采用我的脚本安装,则需修改mysql客户端的主配置文件,添加用户和密码即可解决。
//添加如下三行。
vim /etc/my.conf
[client]
user = root
password = citms
2.mysql从机安装zabbix_agentd端。
//安装依赖包.
yum -y install net-snmp-devel libevent-devel make gcc gcc-c++ pcre*

//准备安装包,并解压。
tar xf zabbix-5.2.7.tar.gz
cd zabbix-5.2.7

//创建zabbix用户。
useradd -r -M -s /sbin/nologin zabbix

//源码编译。
./configure --enable-agent
make install

//编辑配置文件,指定服务端地址和本机标识。
vim /usr/local/etc/zabbix_agentd.conf
Server=192.168.130.160     //改成服务端IP地址 被动模式
ServerActive=192.168.130.160   //改成服务端IP地址 主动模式
Hostname=redis_1       //改成标识本机的代号,用于添加主机

//开启服务,关闭防火墙。
zabbix_agentd
systemctl  stop firewalld
systemctl  disable firewalld
setenforce 0
3.zabbix客户端编写监控脚本。
vim /opt/scripts/mysql_msstatus.sh
#!/bin/bash
yes_count=$(mysql -e 'show slave status\G'|grep -E 'IO_Running:|SQL_Running:'|grep -c 'Yes')
if [ $yes_count -ne 2 ];then
    echo '1'
else
    echo '0'
fi

//添加执行权限,修改属主属组。
chmod +x /opt/scripts/mysql_msstatus.sh
chown -R zabbix.zabbix /opt/scripts
4.zabbix客户端开启自定义监控功能,指定监控脚本。
vim /usr/local/etc/zabbix_agentd.conf
UnsafeUserParameters=1    //取消注释,并将0改为1
UserParameter=show_master_slave_status,/bin/bash /opt/scripts/mysql_msstatus.sh
5.重启zabbix客户端。
pkill zabbix
zabbix_agentd
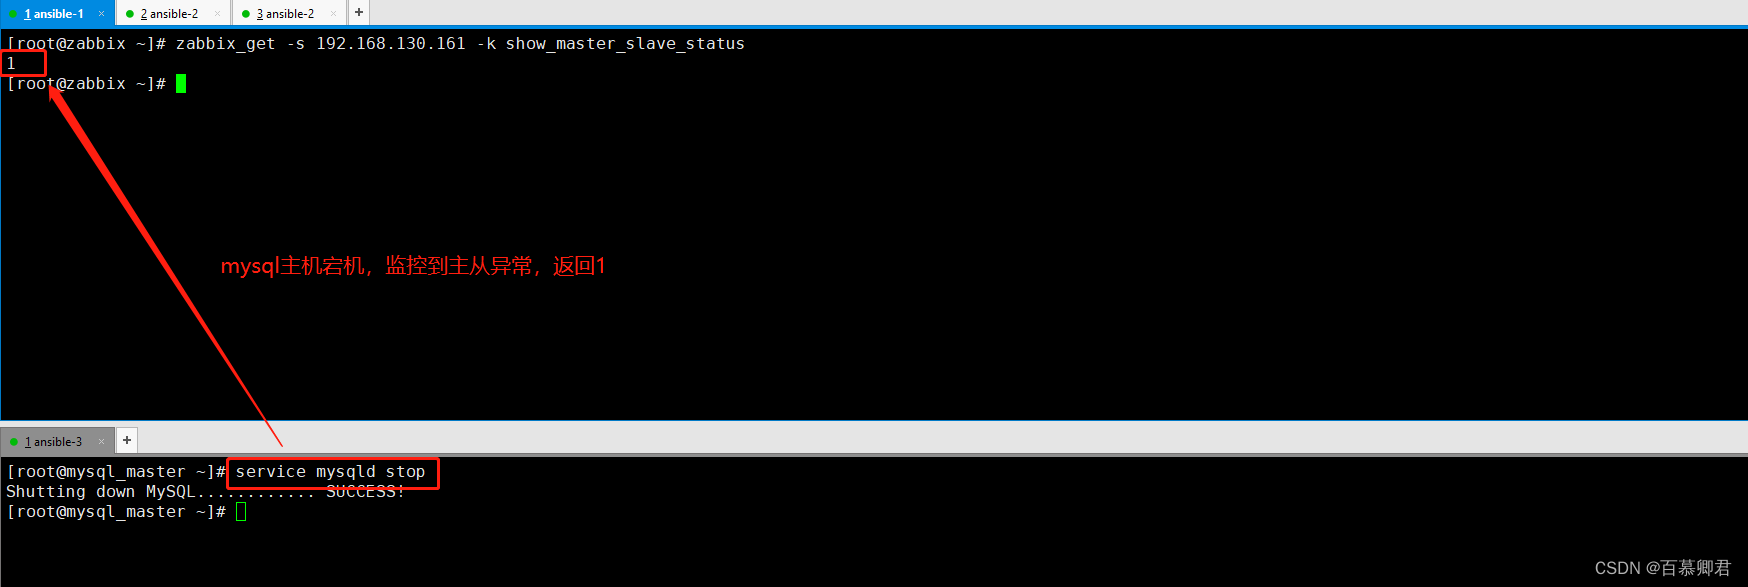
6.zabbix服务端测试监控脚本是否能正常监控。

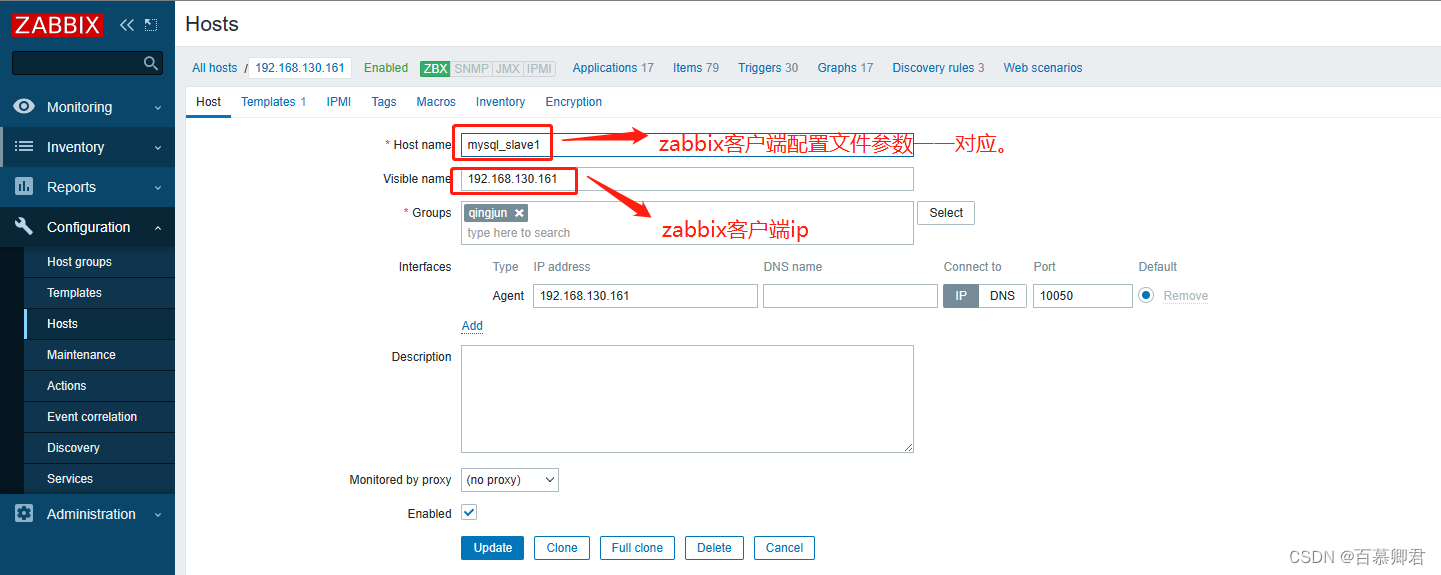
7.配置zabbix网页,修改主机模板。
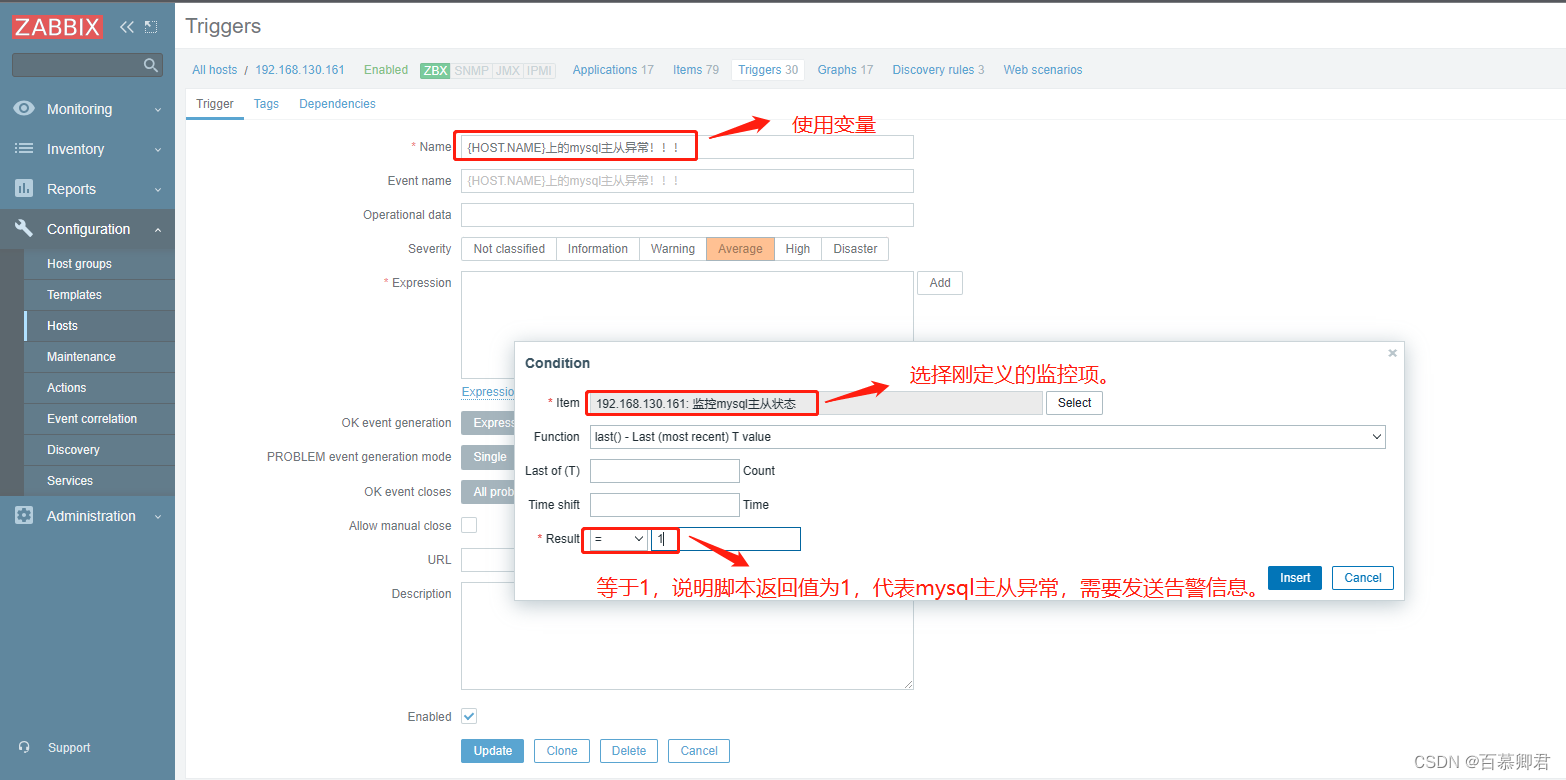
8.添加监控项。
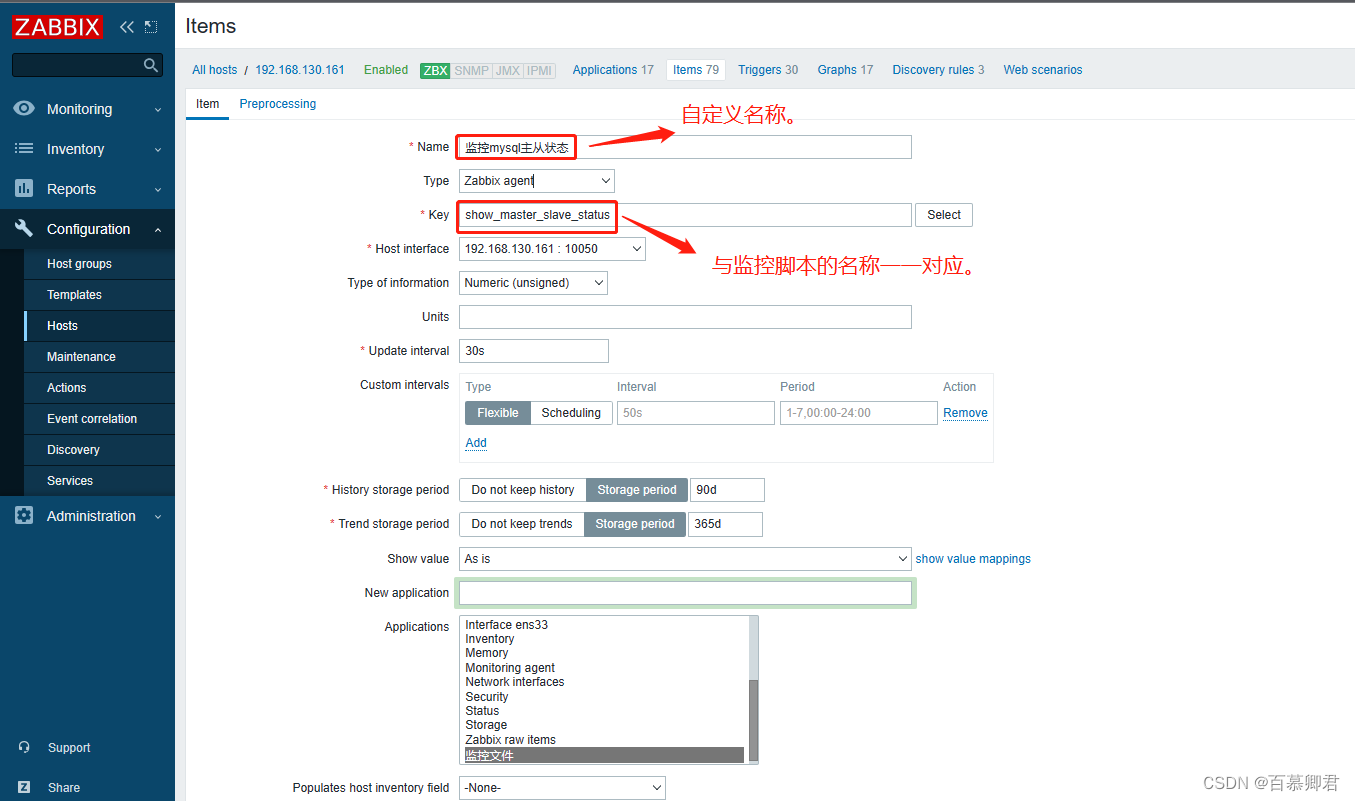
9.添加监控项。
10.停止mysql主服务,验证效果。
service mysqld stop
四、监控mysql延迟
- mysql延迟时正常的,但若延迟数越来越大说明就有问题,此时就需要排查问题了。
- mysql延迟是在mysql主从基础上来玩的,所以如下的基本配置都是基于上文mysql主从来实现的。
1.提前配置好mysql主从,并在从机上配置zabbix_agent。
2.zabbix客户端编写监控脚本。
vim /opt/scripts/scripts/mysql_delay.sh
#!/bin/bash
delay=$(mysql -e 'show slave status\G'|grep 'Seconds_Behind_Master'|awk '{print $2}')
echo $delay

//添加执行权限,修改属主属组。
chmod +x /opt/scripts/scripts/mysql_delay.sh
chown -R zabbix.zabbix /opt/scripts/scripts/mysql_delay.sh
3.zabbix客户端开启自定义监控功能,指定监控脚本。
vim /usr/local/etc/zabbix_agentd.conf
UnsafeUserParameters=1    //取消注释,并将0改为1
UserParameter=show_mysql_delay,/bin/bash /opt/scripts/mysql_delay.sh
4.重启服务。
pkill zabbix
zabbix_agentd
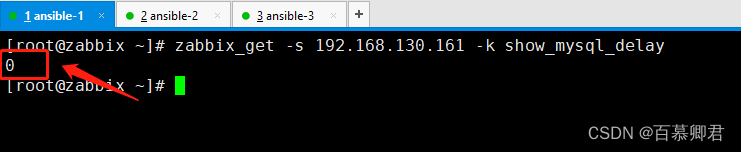
5.zabbix服务端测试监控脚本是否能正常监控到mysql延迟值。
zabbix_get -s 192.168.130.161 -k show_mysql_delay
6.添加监控项。

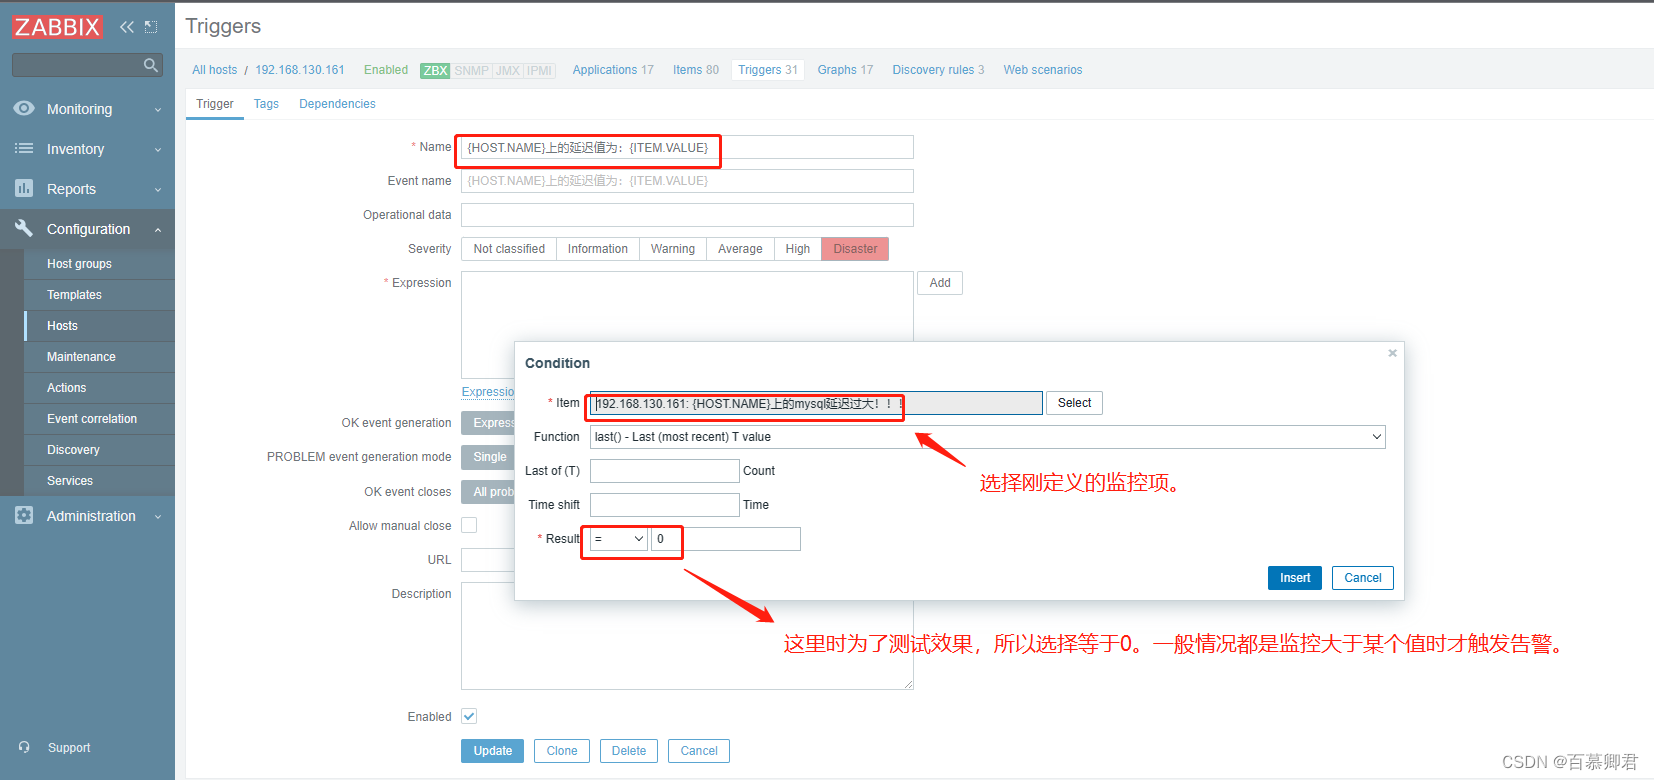
7.添加触发器。这里的触发条件需要根据实际情况修改,等于0只是为了测试效果。
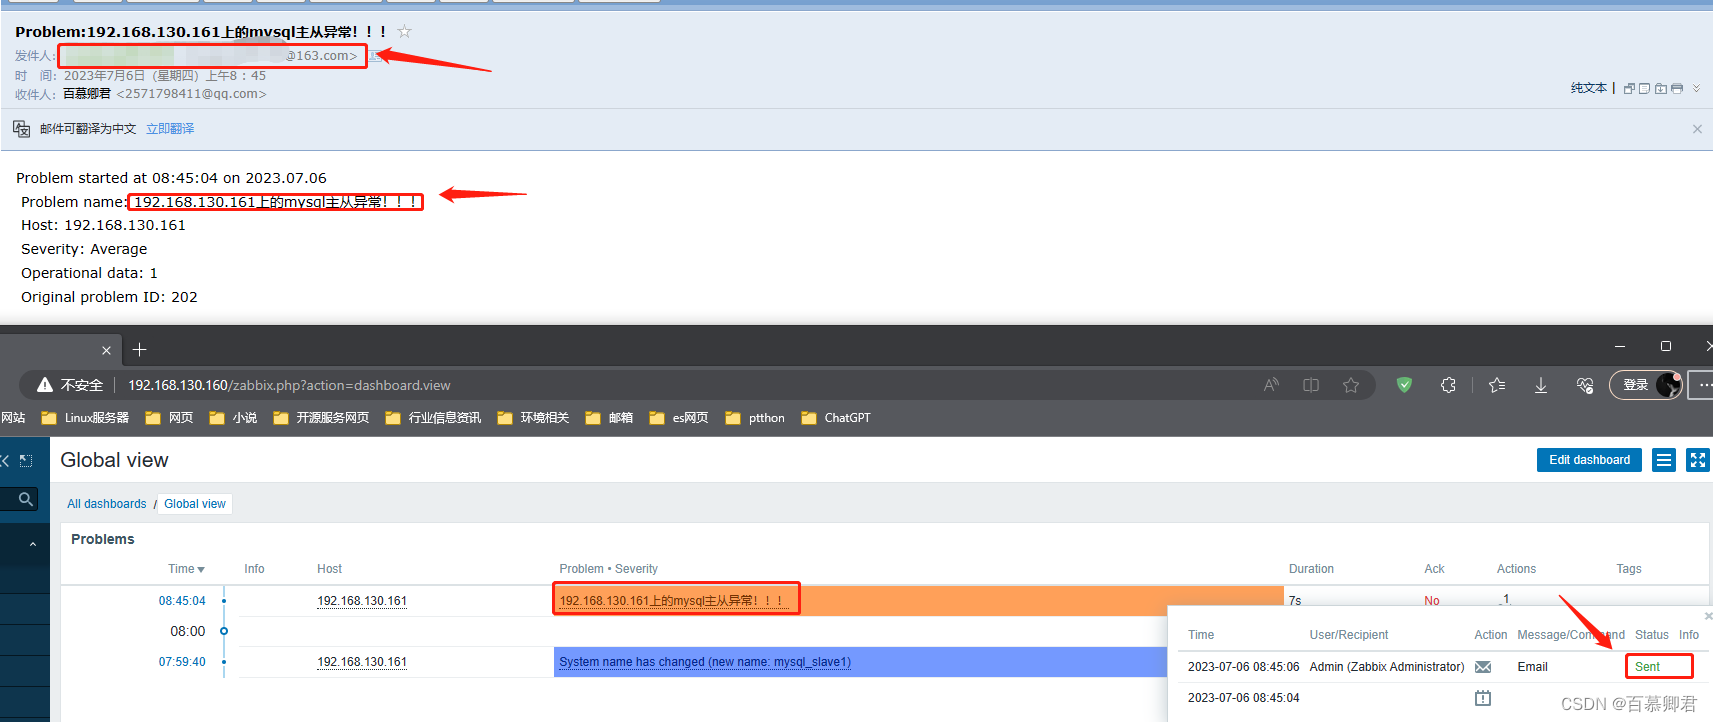
8.验证结果。