React DOM结构代码:
import fillImg from 'xx/fillImg.png'; // 填充纹理图片

......
{/* 趋势图填充纹理图片 */}
<img id="fillImg" src={fillImg} style={{ width: 0 }} />
<div id="line" style={{ width: '100%', height: 300 }}></div>
......
echarts option:
option = {
  tooltip: {
    trigger: 'axis'
  },
  xAxis: {
    type: 'category',
    data: ['Mon', 'Tue', 'Wed', 'Thu', 'Fri', 'Sat', 'Sun']
  },
  yAxis: {
    type: 'value'
  },
  series: [
    {
      type: 'line',
      smooth: true,
      areaStyle: {
        color: { image: document.getElementById('fillimg'), repeat: 'repeat' }
      },
      data: [150, 230, 224, 218, 135, 147, 260]
    }
  ]
};
fillimg图片:

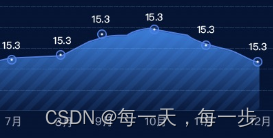
折线图效果:








![[SSM]MyBatis基础](https://img-blog.csdnimg.cn/56b0e3df2ca7447b980f4d866c37a384.png)