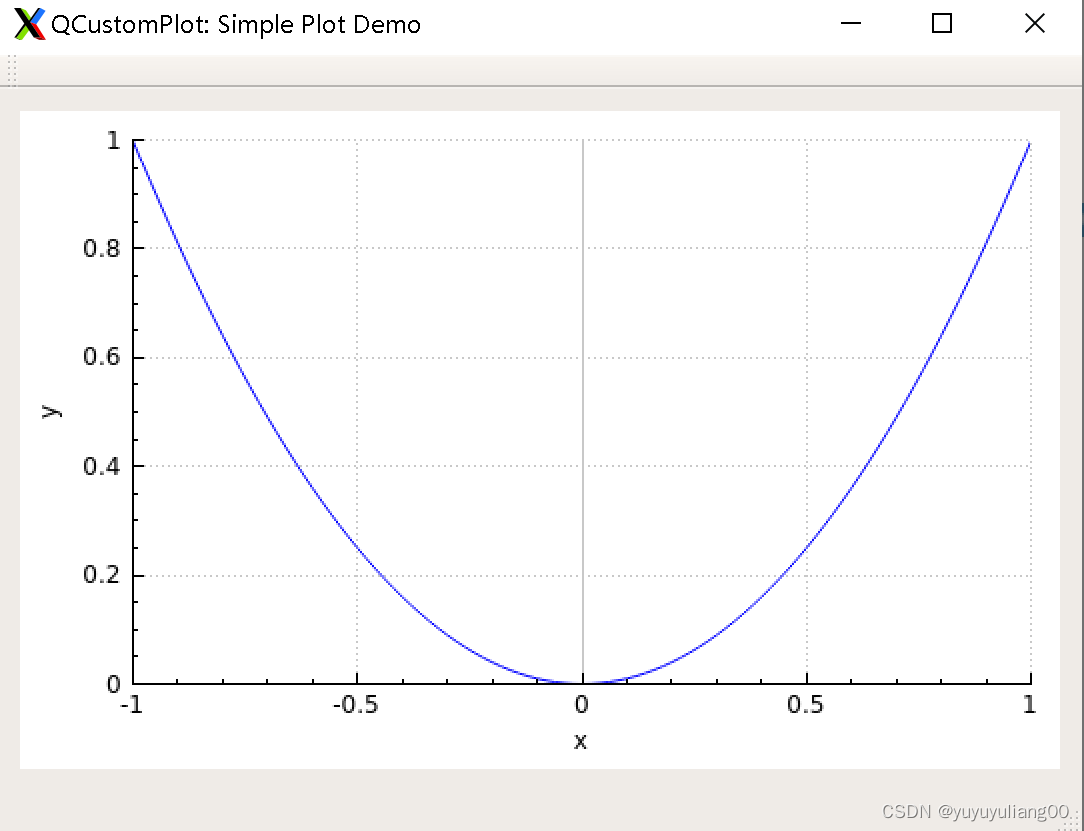
本文记录了在Linux上使用QCustomPlot进行一个基本绘制所需的完整过程,包括如何使用qtcreator,编辑ui以及编写相应的C++代码。以下是详细步骤:
1、使用qtcreator启动开发环境:
[blctrl@main-machine qt]$ qtcreator启动后,显示以下一个操作界面:

2、通过菜单栏File->New File or Project启动项目新建向导:

3、选择Application->Qt Widgets Application后点击Choose,进入以下一个窗口:

填入自己的项目名称并且选择项目存储路径,勾选复选项,点击Next按钮。
4、在接下来出现的对话框中,都点击next按钮,直到遇到带有finish按钮的对话框,点击finish后,完成项目创建。

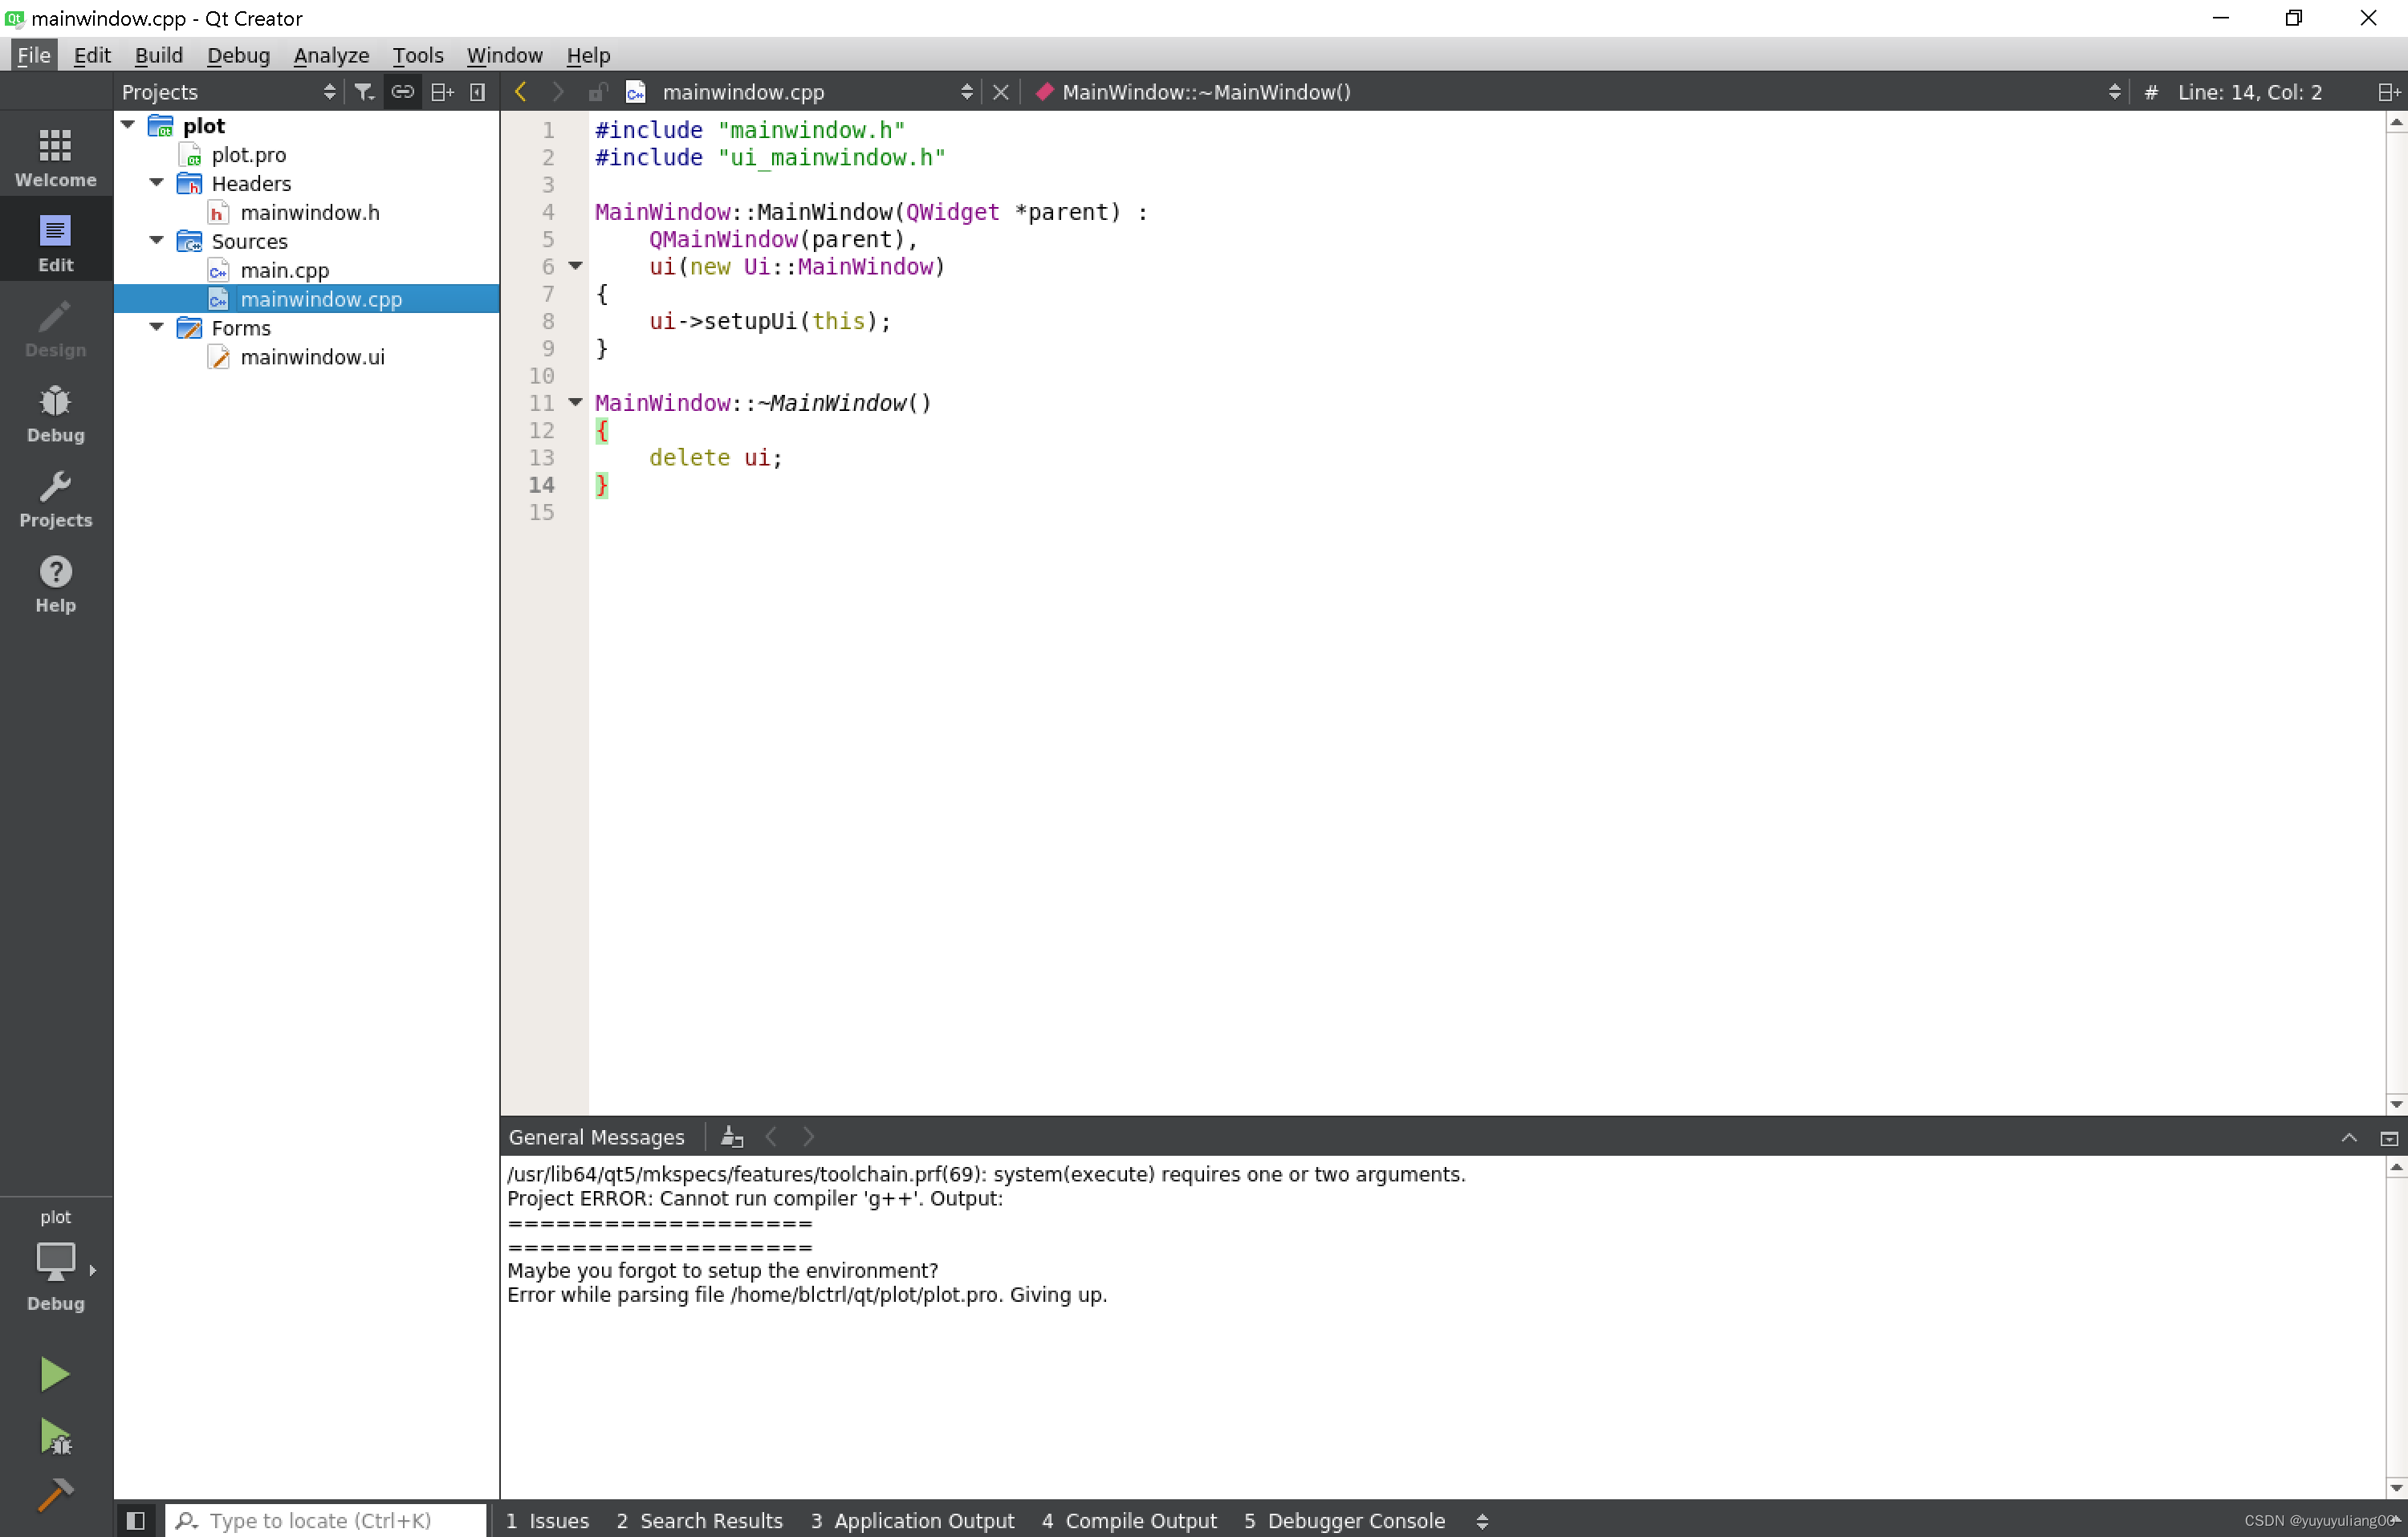
在点击最后一个对话框中finish按钮后,出现以下一个界面:
 5、复制下载的QCustomPlot头文件和源文件到这个项目路径下:
[blctrl@main-machine qt]$ cd plot
[blctrl@main-machine plot]$ ls
main.cpp  mainwindow.cpp  mainwindow.h  mainwindow.ui  plot.pro  plot.pro.user
[blctrl@main-machine plot]$ cp ../qcustomplot/qcustomplot.* ./
[blctrl@main-machine plot]$ ls
main.cpp  mainwindow.cpp  mainwindow.h  mainwindow.ui  plot.pro  plot.pro.user  qcustomplot.cpp  qcustomplot.h
6、修改plot.pro文件,内容如下:
QT       += core gui

greaterThan(QT_MAJOR_VERSION, 4): QT += widgets printsupport

greaterThan(QT_MAJOR_VERSION, 4): CONFIG += c++11
lessThan(QT_MAJOR_VERSION, 5): QMAKE_CXXFLAGS += -std=c++11

TARGET = plot
TEMPLATE = app


SOURCES += main.cpp\
        mainwindow.cpp \
	qcustomplot.cpp

HEADERS  += mainwindow.h \
	qcustomplot.h

FORMS    += mainwindow.ui
7、保存以上文件后,项目窗口中,Sources和Headers分别增加了一个qcustomplot.cpp源文件和qcustomplot.h头文件。
8、双击项目下Forms中mainwindow.ui文件,弹出一个图形编辑窗口:

9、点击控件,将Containers下Widget控件拖动到所编辑窗口上。将鼠标放置在空白窗口区,点击水平布局。此时,被拖入的widget将占据整个窗口的客户区。
10、点击被拖入的widget,然后右键单击鼠标,在弹出环境菜单中,选择Promoto to...选项,在弹出的对话框中Promoted Class栏输入QCustomPlot,点击Promote按钮。

11、将属性窗口中,objectName从widget改成customPlot。

12、编辑头文件mainwindow.h
#ifndef MAINWINDOW_H
#define MAINWINDOW_H

#include <QMainWindow>
#include "qcustomplot.h"  // 添加QCustomPlot类的头文件

namespace Ui {
class MainWindow;
}

class MainWindow : public QMainWindow
{
    Q_OBJECT

public:
    explicit MainWindow(QWidget *parent = 0);
    ~MainWindow();
    void setupDemo(QCustomPlot * customPlot);  //编辑一个进行绘制的成员函数

private:
    Ui::MainWindow *ui;
    QString demoName;    // 添加一个成员变量
};

#endif // MAINWINDOW_H
13、编辑头文件mainwindow.cpp源文件:
#include "mainwindow.h"
#include "ui_mainwindow.h"

MainWindow::MainWindow(QWidget *parent) :
    QMainWindow(parent),
    ui(new Ui::MainWindow)
{
    ui->setupUi(this);

    setGeometry(400, 250, 542, 390);

     setupDemo(ui->customPlot);

}

MainWindow::~MainWindow()
{
    delete ui;
}


// 绘图成员函数的实现
void MainWindow::setupDemo(QCustomPlot * customPlot)
{
    demoName = "Simple Plot Demo";
    // 产生数据:
    // 进行初始化
    QVector<double> x(101), y(101);
    for (int i=0; i<101; ++i)
    {
      x[i] = i/50.0 - 1; // x从-1到1
      y[i] = x[i]*x[i];  // 绘制2次函数
    }
    // 创建图形并且将数据赋给它:
    customPlot->addGraph();
    customPlot->graph(0)->setData(x, y);
    // 设置轴的标签:
    customPlot->xAxis->setLabel("x");
    customPlot->yAxis->setLabel("y");
    // 设置轴的范围,因而可以看到全部数据:
    customPlot->xAxis->setRange(-1, 1);
    customPlot->yAxis->setRange(0, 1);

  // 设置窗口标题栏名称
  setWindowTitle("QCustomPlot: " + demoName);
  statusBar()->clearMessage();
  ui->customPlot->replot();
}
14、点击编译,编辑成功后,点击运行按钮:

15、显示运行如下的程序:
