一、echarts中国地图使用案例
1.准备地图数据china.json ; 需要的添加微信:tianma104,我发你
2.引入jquery,引入eachars 库
<script src="http://xx/ajax/libs/jquery/3.5.1/jquery.min.js"></script>
<script src="https://xxx/ajax/libs/echarts/5.0.0-rc.1/echarts.min.js"></script>
3.编写js代码
    <div id="mapchart" style="width:800px;height:800px;"></div>

    <script>
        $.ajax({
            url: "china.json",
            type: "get",
            dataType: "json",
            success: function (chinaJson) {
                echarts.registerMap("china", chinaJson);
                mapchar = echarts.init(document.getElementById("mapchart"));
                var option = {
                    title: {
                        text: "会员分布图",
                        textStyle: {
                            fontSize: 15
                        },
                        left: "center"
                    },
                    tooltip: {
                        trigger: "item"
                    },
                    legend: {
                        orient: "vertical",
                        left: "left",
                        data: ["会员"]
                    },
                    visualMap: {
                        min: 0,
                        max: 1000,
                        itemWidth: 10,
                        itemHeight: 50,

                        left: "left",
                        top: "bottom",
                        text: ["高", "低"],           // 文本,默认为数值文本
                        calculable: true,
                        // color: ['#5475f5', '#9feaa5'],
                        inRange: {
                            color: ['green', 'red'],
                        },
                        outOfRange: {
                            color: ['green']
                        },
                        backgroundColor: 'rgba(0,0,0,0.2)',
                    },
                    toolbox: {
                        show: true,
                        orient: "vertical",
                        left: "right",
                        top: "center",
                        feature: {
                            dataView: { readOnly: false },
                            restore: {},
                            saveAsImage: {}
                        }
                    },
                    pieces: [
                        {
                            gt: 0,
                            color: '#ffd768'
                        }
                    ],
                    series: [
                        {
                            name: "会员人数",
                            type: "map",
                            mapType: "china",
                            roam: false,
                            label: {
                                normal: {
                                    show: true
                                },
                                emphasis: {
                                    show: true
                                }
                            },

                            data: []
                        }
                    ]
                };
                mapchar.showLoading({
                    text: "数据加载中,请您耐心等待..."
                });


                // mapchar.setOption(option);
                $.ajax({
                    url: 'province.json',// 跳转到 action
                    type: "get",
                    cache: false,
                    dataType: "json",
                    success: function (data) {
                        if (data != null) {
                            option.series[0]["data"] = data;
                            mapchar.setOption(option);

                        } else {
                            mapchar.setOption(option);
                        }
                    },
                    error: function (e) {

                    }, complete: function () {
                        //不管数据接口成功或异常,都终于载入提示
                        //停止动画载入提示
                        mapchar.hideLoading();
                    }
                });
            },
            error: function (e) {

            }, complete: function () {
                //不管数据接口成功或异常,都终于载入提示
                //停止动画载入提示
                mapchar.hideLoading();
            }
        });
    </script>
二、echarts中国地图使用案例2,更改地图颜色
<div id="mapchart" style="width:1200px;height:800px;"></div>
<script>
//echarts 社区
//https://www.makeapie.cn/echarts_component/geo
var geoCoordMap = {
'台湾': [121.5135, 25.0308],
'黑龙江': [127.9688, 45.368],
'内蒙古': [110.3467, 41.4899],
"吉林": [125.8154, 44.2584],
'北京市': [116.4551, 40.2539],
"辽宁": [123.1238, 42.1216],
"河北": [114.4995, 38.1006],
"天津": [117.4219, 39.4189],
"山西": [112.3352, 37.9413],
"陕西": [109.1162, 34.2004],
"甘肃": [103.5901, 36.3043],
"宁夏": [106.3586, 38.1775],
"青海": [101.4038, 36.8207],
"新疆": [87.9236, 43.5883],
"西藏": [91.11, 29.97],
"四川": [103.9526, 30.7617],
"重庆": [108.384366, 30.439702],
"山东": [117.1582, 36.8701],
"河南": [113.4668, 34.6234],
"江苏": [118.8062, 31.9208],
"安徽": [117.29, 32.0581],
"湖北": [114.3896, 30.6628],
"浙江": [119.5313, 29.8773],
"福建": [119.4543, 25.9222],
"江西": [116.0046, 28.6633],
"湖南": [113.0823, 28.2568],
"贵州": [106.6992, 26.7682],
"云南": [102.9199, 25.4663],
"广东": [113.12244, 23.009505],
"广西": [108.479, 23.1152],
"海南": [110.3893, 19.8516],
'上海': [121.4648, 31.2891],
};
var data = [
{ name: "北京", value: 199 },
{ name: "天津", value: 42 },
{ name: "河北", value: 102 },
{ name: "山西", value: 81 },
{ name: "内蒙古", value: 47 },
{ name: "辽宁", value: 67 },
{ name: "吉林", value: 82 },
{ name: "黑龙江", value: 123 },
{ name: "上海", value: 24 },
{ name: "江苏", value: 92 },
{ name: "浙江", value: 114 },
{ name: "安徽", value: 109 },
{ name: "福建", value: 116 },
{ name: "江西", value: 91 },
{ name: "山东", value: 119 },
{ name: "河南", value: 137 },
{ name: "湖北", value: 116 },
{ name: "湖南", value: 114 },
{ name: "重庆", value: 91 },
{ name: "四川", value: 125 },
{ name: "贵州", value: 62 },
{ name: "云南", value: 83 },
{ name: "西藏", value: 9 },
{ name: "陕西", value: 80 },
{ name: "甘肃", value: 56 },
{ name: "青海", value: 10 },
{ name: "宁夏", value: 18 },
{ name: "新疆", value: 180 },
{ name: "广东", value: 123 },
{ name: "广西", value: 59 },
{ name: "海南", value: 14 },
];
var convertData = function (data) {
var res = [];
for (var i = 0; i < data.length; i++) {
var geoCoord = geoCoordMap[data[i].name];
if (geoCoord) {
res.push({
name: data[i].name,
value: geoCoord.concat(data[i].value)
});
}
}
return res;
};
$.ajax({
url: "china3.json",
type: "get",
dataType: "json",
success: function (chinaJson) {
echarts.registerMap("china", chinaJson);
mapchar = echarts.init(document.getElementById("mapchart"));
var option = {
backgroundColor: {
type: 'linear',
x: 0,
y: 0,
x2: 1,
y2: 1,
colorStops: [{
offset: 0, color: '#0f378f' // 0% 处的颜色
}, {
offset: 1, color: '#00091a' // 100% 处的颜色
}],
globalCoord: false // 缺省为 false
},
title: {
top: 20,
text: '“会员活跃度” - 山东省',
subtext: '',
x: 'center',
textStyle: {
color: '#ccc'
}
},
tooltip: {
trigger: 'item',
formatter: function (params) {
if (typeof (params.value)[2] == "undefined") {
return params.name + ' : ' + params.value;
} else {
return params.name + ' : ' + params.value[2];
}
}
},
legend: {
orient: 'vertical',
y: 'bottom',
x: 'right',
data: ['pm2.5'],
textStyle: {
color: '#fff'
}
},
visualMap: {
show: false,
min: 0,
max: 500,
left: 'left',
top: 'bottom',
text: ['高', '低'], // 文本,默认为数值文本
calculable: true,
seriesIndex: [1],
inRange: {
}
},
geo: {
map: 'china',
show: true,
roam: true,
label: {
normal: {
show: false
},
emphasis: {
show: false,
}
},
itemStyle: {
normal: {
areaColor: '#3a7fd5',
borderColor: '#0a53e9',//线
shadowColor: '#092f8f',//外发光
shadowBlur: 20
},
emphasis: {
areaColor: '#0a2dae',//悬浮区背景
}
}
},
series: [
{
symbolSize: 5,
label: {
normal: {
formatter: '{b}',
position: 'right',
show: true,
color: 'red'
},
emphasis: {
show: true
}
},
itemStyle: {
normal: {
color: '#fff'
}
},
name: 'light',
type: 'scatter',
coordinateSystem: 'geo',
data: convertData(data),
},
{
type: 'map',
map: 'china',
geoIndex: 0,
aspectScale: 0.75, //长宽比
showLegendSymbol: false, // 存在legend时显示
label: {
normal: {
show: false
},
emphasis: {
show: false,
textStyle: {
color: '#fff'
}
}
},
roam: true,
itemStyle: {
normal: {
areaColor: '#031525',
borderColor: '#FFFFFF',
},
emphasis: {
areaColor: '#2B91B7'
}
},
animation: false,
data: data
},
{
name: 'Top 5',
type: 'scatter',
coordinateSystem: 'geo',
symbol: 'pin',
symbolSize: [50, 50],
label: {
normal: {
show: true,
textStyle: {
color: '#fff',
fontSize: 9,
},
formatter(value) {
return value.data.value[2]
}
}
},
itemStyle: {
normal: {
color: '#D8BC37', //标志颜色
}
},
data: convertData(data),
showEffectOn: 'render',
rippleEffect: {
brushType: 'stroke'
},
hoverAnimation: true,
zlevel: 1
},
]
};
// mapchar.showLoading({
// text: "数据加载中,请您耐心等待..."
// });
mapchar.setOption(option);
// mapchar.setOption(option);
// $.ajax({
// url: 'province.json',// 跳转到 action
// type: "get",
// cache: false,
// dataType: "json",
// success: function (data) {
// if (data != null) {
// option.series[0]["data"] = data;
// mapchar.setOption(option);
// } else {
// mapchar.setOption(option);
// }
// },
// error: function (e) {
// }, complete: function () {
// //不管数据接口成功或异常,都终于载入提示
// //停止动画载入提示
// mapchar.hideLoading();
// }
// });
},
error: function (e) {
}, complete: function () {
//不管数据接口成功或异常,都终于载入提示
//停止动画载入提示
// mapchar.hideLoading();
}
});
</script>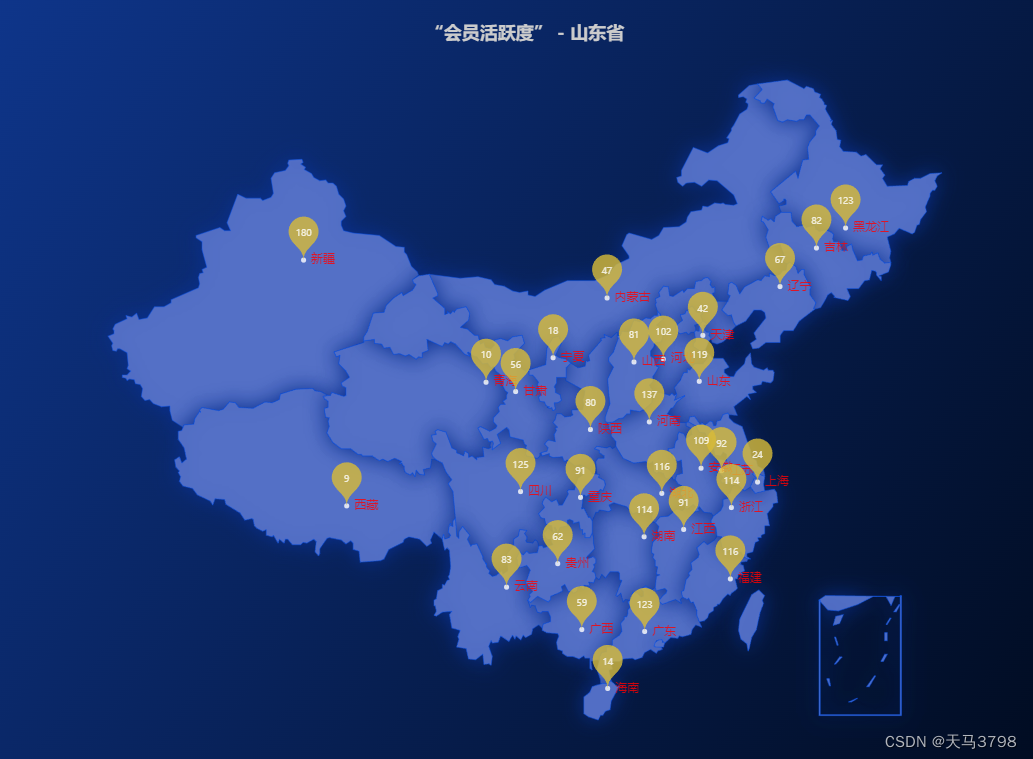
eacharts社区:geo地理坐标 - makeapie echarts社区图表可视化案例
“会员活跃度” - 山东省 - category-work,geo地理坐标,legend,series-map地图,series-scatter散点图,title标题,tooltip提示框,visualMap视觉映射 - makeapie echarts社区图表可视化案例
Examples - Apache ECharts
更多: