目录
- 一、介绍
- 二、准备
- 三、目标
- 四、代码
- 五、完成
一、介绍
日常生活中,气象数据对于人们的生活具有非常重要的意义,数据的表现形式多种多样,使用图表进行展示使数据在呈现上更加直观。
本题请实现一个 Y 城 2022 年的天气趋势图。
二、准备
开始答题前,需要先打开本题的项目代码文件夹,目录结构如下:
├── css
│   └── style.css
├── effect-1.gif
├── effect-2.gif
├── index.html
└── js
    ├── axios.js
    ├── echarts.min.js
    ├── vue.min.js
    └── weather.json
其中:
- css/style.css 是样式文件。
- index.html 是主页面。
- js/axios.js 是 axios 文件。
- js/vue.min.js 是 vue2.x 文件。
- js/echarts.min.js 是 echarts 文件。
- js/weather.json 是请求需要用到的天气数据。
- effect-1.gif 是当月和未来七天切换的效果图。
- effect-2.gif 是最终完成的效果图。
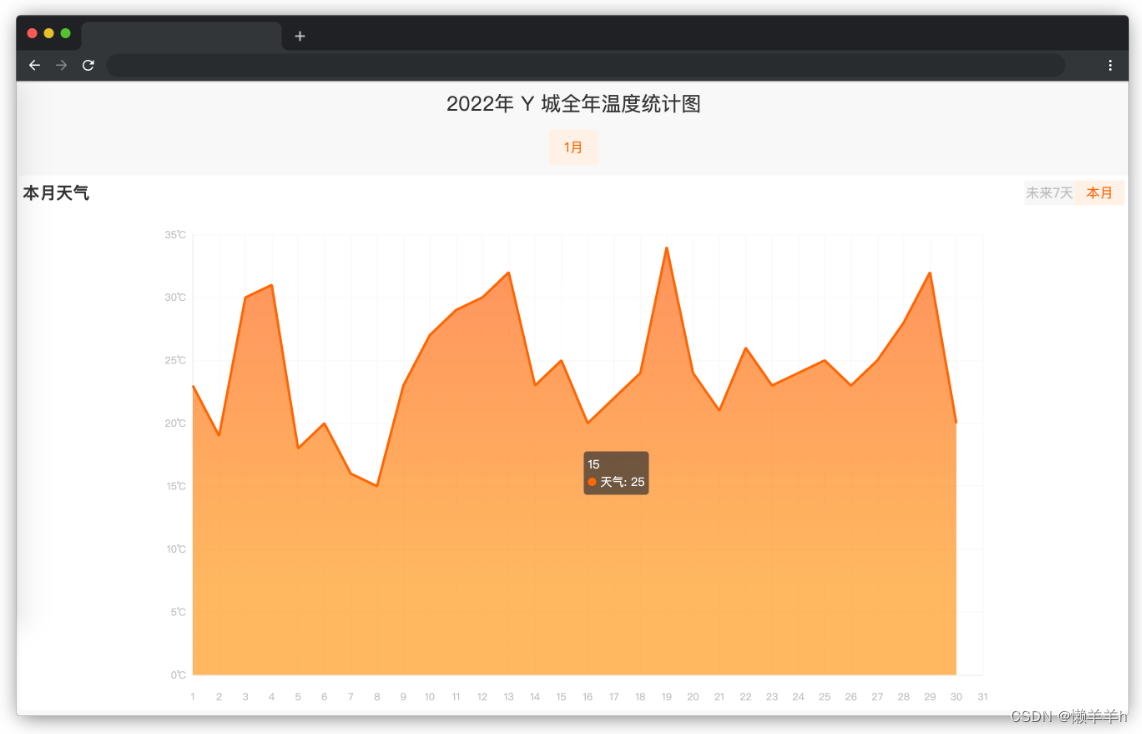
在浏览器中预览 index.html 页面效果如下:
三、目标
- 完成数据请求(数据来源 ./js/weather.json),weather.json 中存放的数据为 12 个月对应的温度数据。在项目目录下已经提供了 axios,考生可自行选择是否使用。注意:调试完成后请将请求地址写死为 ./js/weather.json。
- 把 data 中的月份数据 monthList, 在 class=month 标签下面的 li 上完成渲染,点击月份则切换对应月份的温度数据同时被点击的月份会变成激活状态( .active 类),x 轴为日期,y 轴为温度,默认显示 1 月份数据。
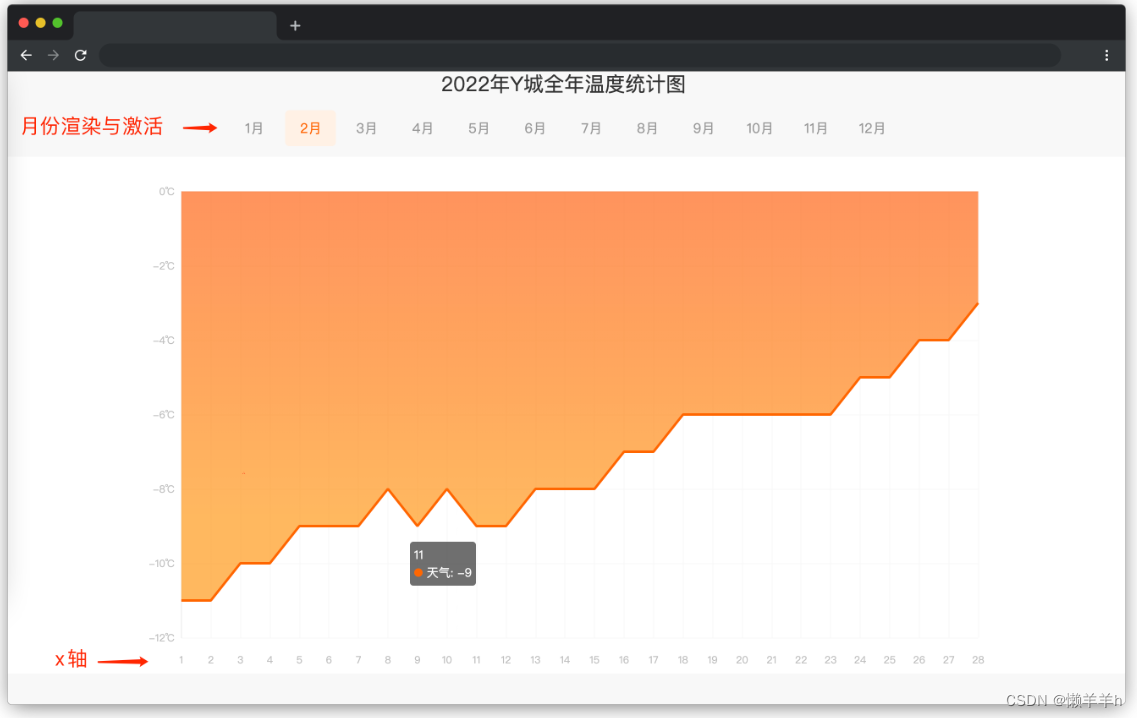
- 如果点击的月份是当天(通过时间函数动态获取的时间)所在月份,本月和未来七天切换的 tab (即 id=currentMonth 元素)显示,其他月份 currentMonth 元素不显示。
- 默认显示本月数据。
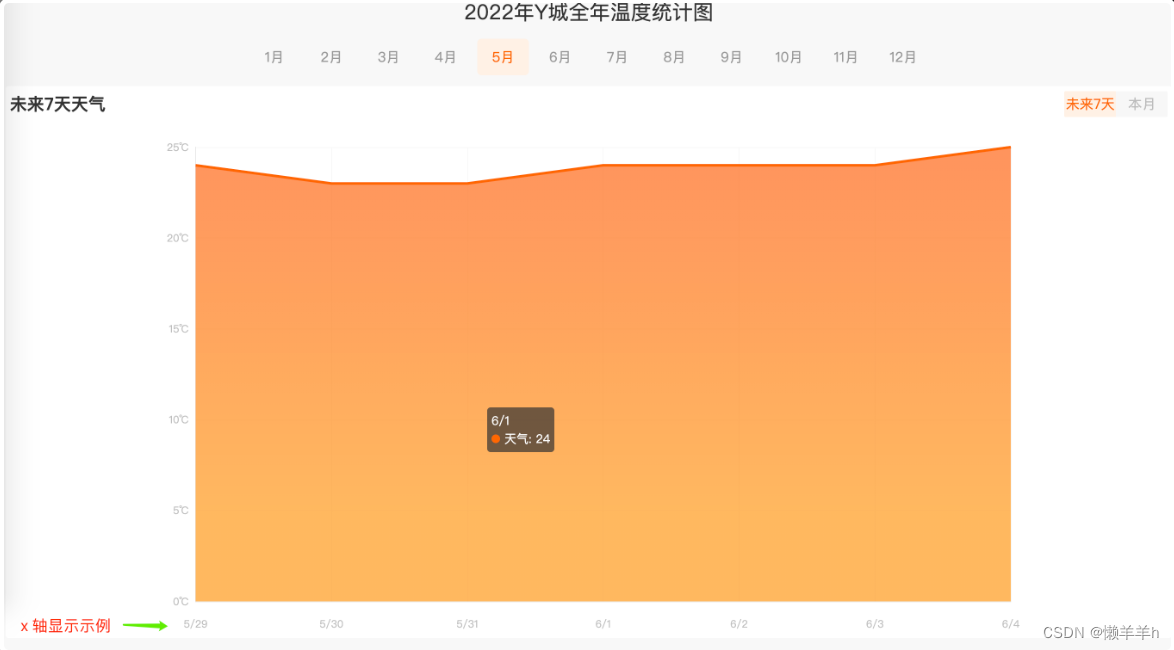
- 点击本月显示当月数据,点击未来七天显示从当天(包含当天)开始未来七天的数据,当显示未来七天数据时 x 轴需要显示为月/日格式。
点击 tab 上本月和未来七天会切换激活状态(.active)。
以当天为 5 月 29 号为例,未来七天 x 轴显示示例(即 x 轴显示成:5/29,5/30,5/31,6/1,6/2,6/3,6/4):
本月和未来七天 切换效果见文件夹下 effect-1.gif。

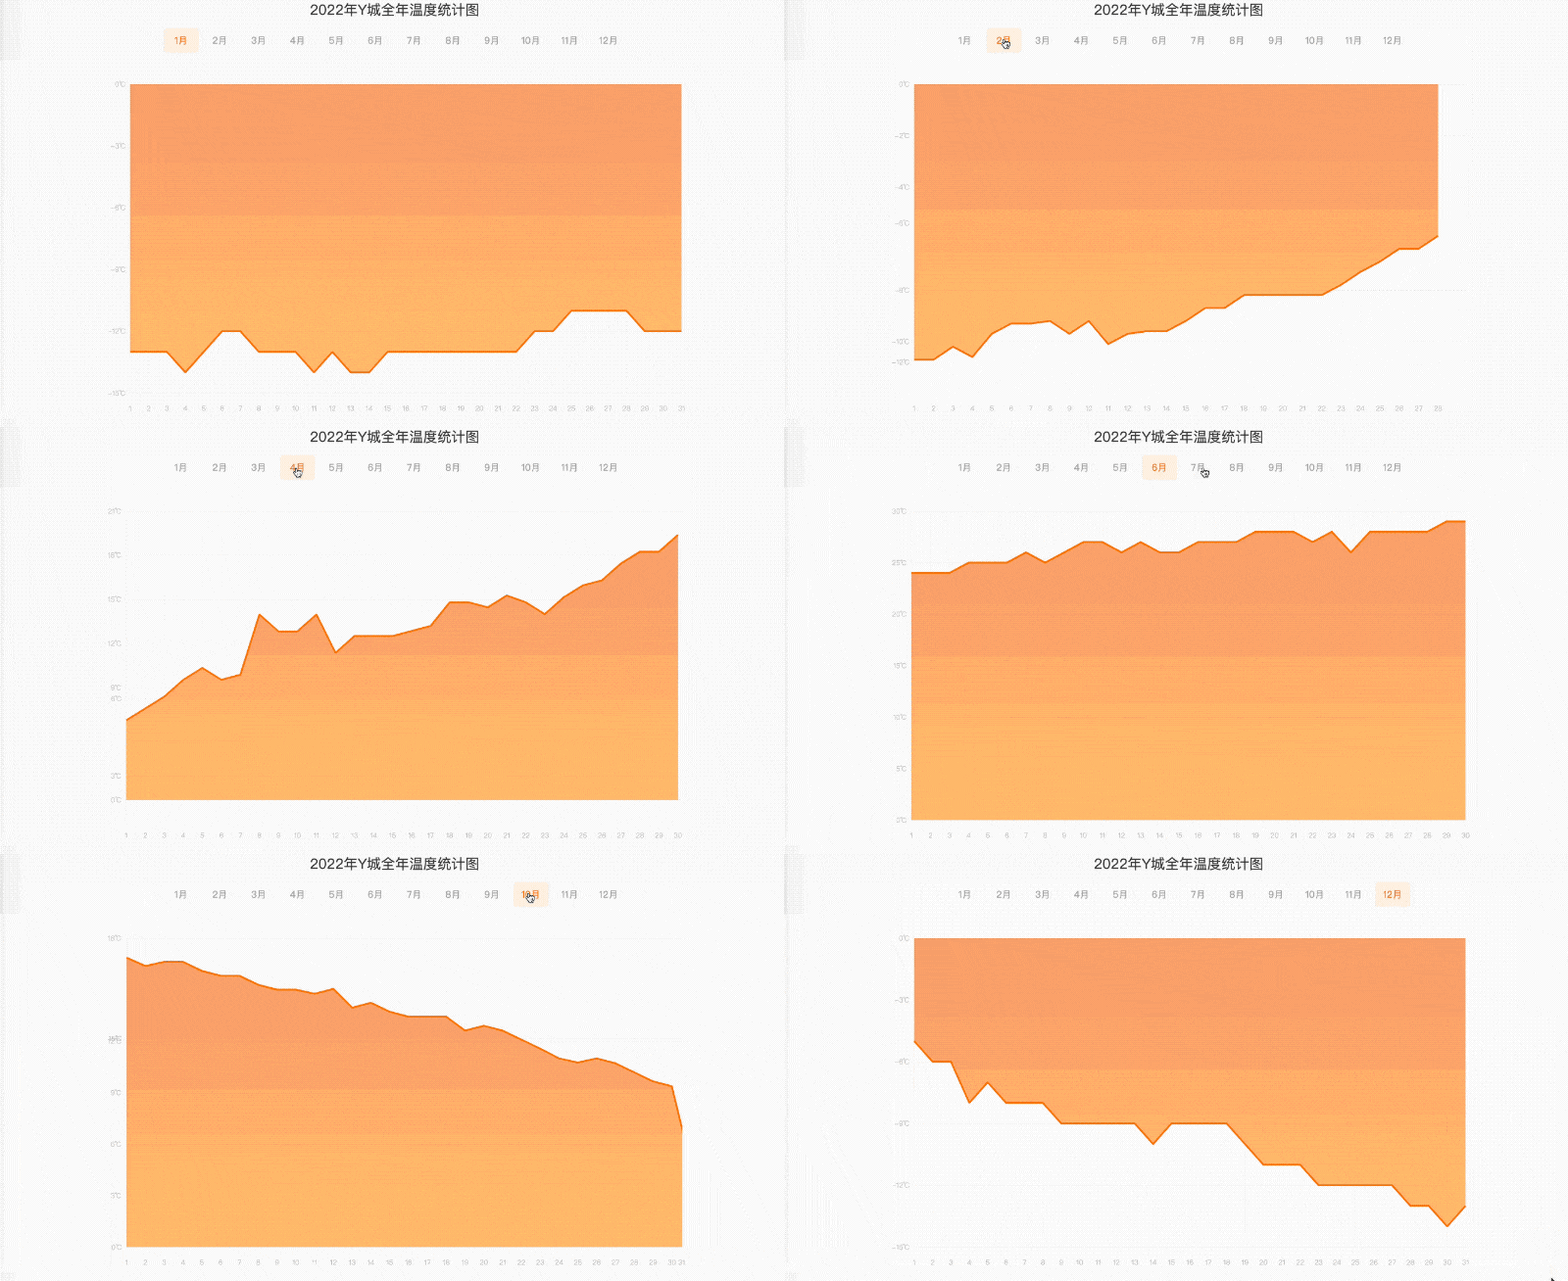
最终效果见文件夹下面的 gif 图,图片名称为 effect-2.gif(提示:可以通过 VS Code 或者浏览器预览 gif 图片)
四、代码
index.html
<!DOCTYPE html>
<html>
  <head>
    <meta charset="UTF-8" />
    <title>天气趋势</title>
    <meta
      name="viewport"
      content="width=device-width,initial-scale=1,minimum-scale=1,maximum-scale=1,user-scalable=no"
    />
    <link rel="stylesheet" type="text/css" href="css/style.css" />
    <script src="./js/axios.js"></script>
    <script src="js/vue.min.js" type="text/javascript" charset="utf-8"></script>
    <script
      src="js/echarts.min.js"
      type="text/javascript"
      charset="utf-8"
    ></script>
  </head>

  <body>
    <div id="app">
      <div class="top-bar">2022年 Y 城全年温度统计图</div>
      <!-- 主体 -->
      <div class="container">
        <!-- 月份 -->
        <div class="month">
          <ul>
            <!-- TODO:待补充代码 在下面的 li 标签中完成 12个月份 (即 monthList) 的渲染  -->
            <li class="active">1月</li>
          </ul>
        </div>
        <div class="chart">
          <!-- TODO:待补充代码  -->
          <!-- currentMonth  未来七天和本月 tab 切换,只有当前月才显示 -->
          <div id="currentMonth">
            <div class="title">
              <h3>{{typeTitle}}</h3>
              <div class="type">
                <span id="seven">未来7天</span>
                <span id="current">本月</span>
              </div>
            </div>
          </div>
          <div id="chart"></div>
        </div>
      </div>
    </div>
  </body>
</html>
<script>
  // TODO:待补充代码
  var vm = new Vue({
    el: "#app",
    data: {
      chart: null, // 图表
      chartOptions: null, // 图表配置项
      typeTitle: "本月天气",
      monthList: {
        January: "1月",
        February: "2月",
        March: "3月",
        April: "4月",
        May: "5月",
        June: "6月",
        July: "7月",
        August: "8月",
        September: "9月",
        October: "10月",
        November: "11月",
        December: "12月",
      },
    },
    mounted: function () {
      // 初始化 echarts
      this.$nextTick(() => {
        this.initChart();
      });
    },
    methods: {
      initChart() {
        // 初始化图表
        this.chart = echarts.init(document.getElementById("chart"));
        // 配置项
        this.chartOptions = {
          grid: {
            top: 35,
            bottom: 5,
            left: 10,
            right: 10,
            containLabel: true,
          },
          tooltip: {
            trigger: "axis",
            axisPointer: {
              lineStyle: {
                color: {
                  type: "linear",
                  x: 0,
                  y: 0,
                  x2: 0,
                  y2: 1,
                  colorStops: [
                    {
                      offset: 0,
                      color: "rgba(255,255,255,0)",
                    },
                    {
                      offset: 0.5,
                      color: "rgba(255,255,255,1)",
                    },
                    {
                      offset: 1,
                      color: "rgba(255,255,255,0)",
                    },
                  ],
                  global: false,
                },
              },
            },
          },
          xAxis: [
            {
              type: "category",
              boundaryGap: false,
              axisLabel: {
                formatter: "{value}",
                fontSize: 12,
                margin: 20,
                textStyle: {
                  color: "#bfbfbf",
                },
              },
              axisLine: {
                lineStyle: {
                  color: "#e9e9e9",
                },
              },
              splitLine: {
                show: true,
                lineStyle: {
                  color: "#f7f7f7",
                },
              },
              axisTick: {
                show: false,
              },
              // x 轴显示的数据,日期
              data: [
                1, 2, 3, 4, 5, 6, 7, 8, 9, 10, 11, 12, 13, 14, 15, 16, 17, 18,
                19, 20, 21, 22, 23, 24, 25, 26, 27, 28, 29, 30, 31,
              ],
            },
          ],
          yAxis: [
            {
              boundaryGap: false,
              type: "value",
              axisLabel: {
                textStyle: {
                  color: "#bfbfbf",
                },
                formatter: `{value}\u2103`,
              },
              nameTextStyle: {
                color: "#fff",
                fontSize: 12,
                lineHeight: 40,
              },
              splitLine: {
                lineStyle: {
                  color: "#f7f7f7",
                },
              },
              axisLine: {
                show: true,
                lineStyle: {
                  color: "#e9e9e9",
                },
              },
              axisTick: {
                show: false,
              },
            },
          ],
          series: [
            {
              name: "天气",
              type: "line",
              smooth: false,
              showSymbol: false,
              symbolSize: 0,
              zlevel: 3,
              itemStyle: {
                color: "#ff6600",
                borderColor: "#a3c8d8",
              },
              lineStyle: {
                normal: {
                  width: 3,
                  color: "#ff6600",
                },
              },
              areaStyle: {
                normal: {
                  color: new echarts.graphic.LinearGradient(
                    0,
                    0,
                    0,
                    1,
                    [
                      {
                        offset: 0,
                        color: "#ff6600",
                      },
                      {
                        offset: 0.8,
                        color: "#ff9900",
                      },
                    ],
                    false
                  ),
                },
              },
              //  Y 轴显示的数据,即温度数据
              data: [
                23, 19, 30, 31, 18, 20, 16, 15, 23, 27, 29, 30, 32, 23, 25, 20,
                22, 24, 34, 24, 21, 26, 23, 24, 25, 23, 25, 28, 32, 20,
              ],
            },
          ],
        };

        // 调用此方法设置 echarts 数据
        this.chart.setOption(this.chartOptions);
      },
    },
  });
</script>
weather.json
[
  {
    "January": [
      -13, -13, -13, -14, -13, -12, -12, -13, -13, -13, -14, -13, -14, -14, -13,
      -13, -13, -13, -13, -13, -13, -13, -12, -12, -11, -11, -11, -11, -12, -12,
      -12
    ]
  },
  {
    "February": [
      -11, -11, -10, -10, -9, -9, -9, -8, -9, -8, -9, -9, -8, -8, -8, -7, -7,
      -6, -6, -6, -6, -6, -6, -5, -5, -4, -4, -3
    ]
  },
  {
    "March": [
      -3, -3, -3, -2, -2, -2, -1, 0, 0, 0, 0, 1, 2, 2, 2, 3, 4, 4, 4, 3, 3, 4,
      4, 5, 5, 6, 7, 7, 7, 8, 7
    ]
  },
  {
    "April": [
      8, 9, 10, 11, 12, 11, 11, 11, 10, 10, 11, 12, 13, 13, 13, 13, 13, 15, 15,
      15, 16, 15, 14, 15, 16, 16, 17, 18, 18, 19
    ]
  },
  {
    "May": [
      18, 18, 18, 18, 19, 19, 19, 19, 20, 20, 21, 21, 22, 22, 21, 22, 22, 22,
      22, 22, 23, 23, 22, 23, 23, 23, 24, 24, 24, 23, 23
    ]
  },
  {
    "June": [
      24, 24, 24, 25, 25, 25, 26, 25, 26, 27, 27, 26, 27, 26, 26, 27, 27, 27,
      28, 28, 28, 27, 28, 26, 28, 28, 28, 28, 29, 29
    ]
  },
  {
    "July": [
      28, 28, 27, 28, 28, 28, 26, 28, 28, 27, 29, 30, 29, 28, 28, 28, 28, 28,
      28, 29, 28, 30, 28, 28, 28, 28, 28, 28, 30, 28, 28
    ]
  },
  {
    "August": [
      28, 28, 27, 28, 28, 28, 26, 28, 28, 27, 29, 28, 29, 28, 28, 28, 28, 28,
      28, 29, 28, 30, 28, 28, 28, 28, 28, 28, 27, 26, 25
    ]
  },
  {
    "September": [
      26, 28, 27, 27, 27, 26, 26, 26, 25, 25, 26, 27, 25, 26, 26, 25, 25, 25,
      24, 25, 24, 24, 24, 22, 23, 22, 21, 21, 21, 20
    ]
  },
  {
    "October": [
      18, 16, 17, 17, 16, 16, 16, 15, 15, 15, 14, 14, 13, 13, 12, 12, 12, 12,
      11, 11, 11, 10, 9, 9, 8, 9, 9, 8, 7, 7, 6
    ]
  },
  {
    "November": [
      6, 7, 7, 6, 6, 5, 3, 2, 2, 1, 0, 1, 0, 0, -1, 0, -1, -1, -2, -2, -2, -3,
      -3, -4, -4, -4, -4, -5, -6, -6
    ]
  },
  {
    "December": [
      -5, -6, -6, -8, -7, -8, -8, -8, -9, -9, -9, -9, -9, -10, -9, -9, -9, -9,
      -10, -11, -11, -11, -12, -12, -12, -12, -12, -13, -13, -14, -13
    ]
  }
]
css/style.css
* {
  margin: 0;
  padding: 0;
  border: 0;
  list-style: none;
  text-decoration: none;
  color: inherit;
  font-weight: normal;
  font-family: "微软雅黑";
  box-sizing: border-box;
  font-style: normal;
  outline: none;
  -webkit-tap-highlight-color: transparent;
}

body {
  width: 100%;
  overflow-x: hidden;
  background: #f8f8f8;
}
.top-bar {
  width: 100%;
  text-align: center;
  position: relative;
  font-size: 24px;
  color: #333333;
  padding: 8px 0;
}
.container {
  width: 100%;
  padding: 0 0.25rem 1rem 0.25rem;
}

/* 月份 */

.month {
  width: 100%;
  height: auto;
  overflow: hidden;
  padding: 0.4rem 0;
}

.month ul {
  width: 100%;
  display: flex;
  justify-content: center;
  align-items: center;
}

.month ul li {
  font-size: 16px;
  color: #999999;
  text-align: center;
  width: 60px;
  margin: 0 0.2rem;
  cursor: pointer;
}

.month ul li.active {
  color: #ff6600;
  padding: 10px;
  background: #fff1e5;
  border-radius: 5px;
}

.chart {
  width: 100%;
  height: auto;
  overflow: hidden;
  background: #ffffff;
  padding: 0.35rem 0.3rem;
  margin-top: 0.4rem;
  border-radius: 0.2rem;
}

.chart .title {
  width: 100%;
  height: auto;
  overflow: hidden;
  display: flex;
  justify-content: space-between;
  align-items: center;
}

.chart .title h3 {
  font-size: 20px;
  color: #333333;
  font-weight: bold;
}

.chart .title .type {
  display: flex;
  align-items: center;
}

.chart .title .type span {
  width: 60px;
  height: 30px;
  line-height: 30px;
  text-align: center;
  font-size: 16px;
  color: #bcbcbc;
  background: #f7f7f7;
  cursor: pointer;
}

.chart .title .type span.active {
  color: #ff6600;
  background: #fff1e5;
  border-radius: 5px;
}

.chart .title .type span:first-child {
  border-radius: 0.1rem 0 0 0.1rem;
}

.chart .title .type span:last-child {
  border-radius: 0 0.1rem 0.1rem 0;
}

.chart #chart {
  width: 1000px;
  height: 600px;
  margin: 0 auto;
}
五、完成
index.html
<!DOCTYPE html>
<html>
  <head>
    <meta charset="UTF-8" />
    <title>天气趋势</title>
    <meta
      name="viewport"
      content="width=device-width,initial-scale=1,minimum-scale=1,maximum-scale=1,user-scalable=no"
    />
    <link rel="stylesheet" type="text/css" href="css/style.css" />
    <script src="./js/axios.js"></script>
    <script src="js/vue.min.js" type="text/javascript" charset="utf-8"></script>
    <script
      src="js/echarts.min.js"
      type="text/javascript"
      charset="utf-8"
    ></script>
  </head>

  <body>
    <div id="app">
      <div class="top-bar">2022年 Y 城全年温度统计图</div>
      <!-- 主体 -->
      <div class="container">
        <!-- 月份 -->
        <div class="month">
          <ul>
            <!-- TODO:待补充代码 在下面的 li 标签中完成 12个月份 (即 monthList) 的渲染  -->
            <li
              v-for="(value,key,index) in monthList"
              @click="changeActive(index)"
              :class="{'active':index==indexMonth}"
            >
              {{value}}
            </li>
          </ul>
        </div>
        <div class="chart">
          <!-- TODO:待补充代码  -->
          <!-- currentMonth  未来七天和本月 tab 切换,只有当前月才显示 -->
          <div v-if="nowMonth==indexMonth" id="currentMonth">
            <div class="title">
              <h3>{{getTypeTitle}}</h3>
              <div class="type">
                <span
                  @click="changeTag"
                  :class="{'active':!isActive}"
                  id="seven"
                  >未来7天</span
                >
                <span
                  @click="changeTag"
                  :class="{'active':isActive}"
                  id="current"
                  >本月</span
                >
              </div>
            </div>
          </div>
          <div id="chart"></div>
        </div>
      </div>
    </div>
  </body>
</html>
<script>
  // TODO:待补充代码
  var vm = new Vue({
    el: "#app",
    data: {
      chart: null, // 图表
      chartOptions: null, // 图表配置项
      typeTitle: "本月天气",
      nowMonth: new Date().getMonth(),
      isActive: true,
      monthList: {
        January: "1月",
        February: "2月",
        March: "3月",
        April: "4月",
        May: "5月",
        June: "6月",
        July: "7月",
        August: "8月",
        September: "9月",
        October: "10月",
        November: "11月",
        December: "12月",
      },
      list: [],
      indexMonth: 0,
    },
    mounted: function () {
      // 初始化 echarts
      this.$nextTick(async () => {
        this.initChart();
        await this.getData();
        this.updateMonthData();
      });
    },
    computed: {
      getTypeTitle() {
        return this.isActive ? "本月天气" : "未来7天天气";
      },
    },
    methods: {
      initChart() {
        // 初始化图表
        this.chart = echarts.init(document.getElementById("chart"));
        // 配置项
        this.chartOptions = {
          grid: {
            top: 35,
            bottom: 5,
            left: 10,
            right: 10,
            containLabel: true,
          },
          tooltip: {
            trigger: "axis",
            axisPointer: {
              lineStyle: {
                color: {
                  type: "linear",
                  x: 0,
                  y: 0,
                  x2: 0,
                  y2: 1,
                  colorStops: [
                    {
                      offset: 0,
                      color: "rgba(255,255,255,0)",
                    },
                    {
                      offset: 0.5,
                      color: "rgba(255,255,255,1)",
                    },
                    {
                      offset: 1,
                      color: "rgba(255,255,255,0)",
                    },
                  ],
                  global: false,
                },
              },
            },
          },
          xAxis: [
            {
              type: "category",
              boundaryGap: false,
              axisLabel: {
                formatter: "{value}",
                fontSize: 12,
                margin: 20,
                textStyle: {
                  color: "#bfbfbf",
                },
              },
              axisLine: {
                lineStyle: {
                  color: "#e9e9e9",
                },
              },
              splitLine: {
                show: true,
                lineStyle: {
                  color: "#f7f7f7",
                },
              },
              axisTick: {
                show: false,
              },
              // x 轴显示的数据,日期
              data: [
                1, 2, 3, 4, 5, 6, 7, 8, 9, 10, 11, 12, 13, 14, 15, 16, 17, 18,
                19, 20, 21, 22, 23, 24, 25, 26, 27, 28, 29, 30, 31,
              ],
            },
          ],
          yAxis: [
            {
              boundaryGap: false,
              type: "value",
              axisLabel: {
                textStyle: {
                  color: "#bfbfbf",
                },
                formatter: `{value}\u2103`,
              },
              nameTextStyle: {
                color: "#fff",
                fontSize: 12,
                lineHeight: 40,
              },
              splitLine: {
                lineStyle: {
                  color: "#f7f7f7",
                },
              },
              axisLine: {
                show: true,
                lineStyle: {
                  color: "#e9e9e9",
                },
              },
              axisTick: {
                show: false,
              },
            },
          ],
          series: [
            {
              name: "天气",
              type: "line",
              smooth: false,
              showSymbol: false,
              symbolSize: 0,
              zlevel: 3,
              itemStyle: {
                color: "#ff6600",
                borderColor: "#a3c8d8",
              },
              lineStyle: {
                normal: {
                  width: 3,
                  color: "#ff6600",
                },
              },
              areaStyle: {
                normal: {
                  color: new echarts.graphic.LinearGradient(
                    0,
                    0,
                    0,
                    1,
                    [
                      {
                        offset: 0,
                        color: "#ff6600",
                      },
                      {
                        offset: 0.8,
                        color: "#ff9900",
                      },
                    ],
                    false
                  ),
                },
              },
              //  Y 轴显示的数据,即温度数据
              data: [
                23, 19, 30, 31, 18, 20, 16, 15, 23, 27, 29, 30, 32, 23, 25, 20,
                22, 24, 34, 24, 21, 26, 23, 24, 25, 23, 25, 28, 32, 20,
              ],
            },
          ],
        };

        // 调用此方法设置 echarts 数据
        this.chart.setOption(this.chartOptions);
      },
      changeActive(value) {
        this.indexMonth = value;
        //如果当前月分和本月是相同的
        if (this.indexMonth == this.nowMonth) {
          //如果本月是激活的
          if (this.isActive) {
            this.updateMonthData();
          } else {
            this.updateWeekData();
          }
        } else {
          this.updateMonthData();
        }
      },
      updateWeekData() {
        const date = new Date().getDate(); //获取当天的日期
        let index = Object.values(this.list[this.indexMonth])[0];
        const keys = [];
        const values = [];
        for (var i = date; i < date + 7; i++) {
          //如果i大于本月天数则结束
          if (i > index.length) {
            break;
          }
          keys.push(`${this.indexMonth + 1}/${i}`);
          values.push(index[i - 1]);
        }
        if (keys.length < 7) {
          //说明本月结束但是要添加7个数据
          if (this.indexMonth < 11) {
            index = Object.values(this.list[this.indexMonth + 1])[0];
          } else {
            index = Object.values(this.list[0])[0];
          }
          for (var i = 0; keys.length < 7; i++) {
            keys.push(`${this.indexMonth + 2}/${i + 1}`);
            values.push(index[i]);
          }
        }
        this.chartOptions.xAxis[0].data = keys;
        this.chartOptions.series[0].data = values;
        // 调用此方法设置 echarts 数据
        this.chart.setOption(this.chartOptions);
      },
      updateMonthData() {
        const index = Object.values(this.list[this.indexMonth])[0];
        const keys = [];
        const values = [];
        for (item in index) {
          keys.push(item + 1);
          values.push(index[item]);
        }
        this.chartOptions.xAxis[0].data = keys;
        this.chartOptions.series[0].data = values;
        // 调用此方法设置 echarts 数据
        this.chart.setOption(this.chartOptions);
      },
      async getData() {
        const res = await axios({ url: "./js/weather.json" });
        this.list = res.data;
      },
      changeTag() {
        this.isActive = !this.isActive;
        this.isActive ? this.updateMonthData() : this.updateWeekData();
      },
    },
  });
</script>









![[Java基础]面向对象-内存解析](https://img-blog.csdnimg.cn/4513dd6d266b4ec2a7e184c51762c8bb.png)
