大家好,我是Mr数据杨,今天带大家以《三国演义》为背景,探索Python数据处理的奥秘。
将眼光投向谋士们,他们就如同Python的算术运算和NumPy、SciPy函数,精准的计算和预测是他们的必备技能。比如,郭嘉分析敌我兵力、粮草等情况,判断战斗是否可行,这就像是进行算术运算。而诸葛亮的锦囊妙计,相当于应用NumPy和SciPy函数,一步步分解复杂问题,高效解决。
再看吕布这样的武将,他们像是DataFrame排序功能的体现,能够快速确定战场上敌我状况,比如谁是主将,谁是小兵,谁是友军,这就是排序的力量。而DataFrame的过滤数据功能,如同曹操在混乱的局势中迅速找出敌军主将,然后集中力量进行攻击。
再看看袁绍,他和他的 advisers,犹如DataFrame数据统计和数据遍历功能,他们用于监控和管理各地的资源和兵力情况。常用的数据处理操作,随机抽样,插入缺失值,等等,都是他们的家常便饭。
再来看看赵云,他在战场上快速反应,灵活应对,就像处理缺失值,填补数据,删除缺失值,以及插值等操作,适应数据的各种变化。
最后再回到诸葛亮,他的举世闻名的羽扇纶巾,用来指挥战局,宛如Python的分组运算-GroupBy,能够将复杂的情况,分解成各个部分,然后各个击破,达到最后的胜利。
在Python的世界里,我们就像是《三国演义》中的人物,使用智慧和勇气,战胜一切数据处理上的困难和挑战。
文章目录
- 应用算术运算
- 应用NumPy和SciPy函数
- DataFrame进行排序
- DataFrame过滤数据
- DataFrame数据统计
- DataFrame数据遍历
- 块遍历
- 常用数据处理操作
- 随机抽样
- 缺失值处理
- 插入缺失值
- 缺失值的运算
- 清理/填补缺失数据
- 删除缺失值
- 插值
- 分组运算-GroupBy
- GroupBy对象属性
应用算术运算
我们首先介绍如何应用基本的算术运算。下面是一个示例,演示了如何对DataFrame中的列进行加减乘除运算:
df['没年'] - df['生年']
这段代码将计算"没年"列和"生年"列之间的差值,并返回一个新的Series对象。
另一个示例是对"寿命"列进行除法运算:
df['寿命'] / 100
这段代码将"寿命"列中的每个元素除以100,并返回一个新的Series对象。
除了基本的算术运算,我们还可以使用线性组合公式计算汇总数据。下面的代码演示了如何使用线性组合公式计算汇总数据并将其添加到DataFrame中:
df['total'] = 0.4 * df['商業'] + 0.3 * df['農業'] + 0.3 * df['文化']
这段代码将根据给定的权重,对"商業"、"農業"和"文化"三列进行线性组合计算,并将结果添加到名为"total"的新列中。

应用NumPy和SciPy函数
接下来,我们将介绍如何使用NumPy和SciPy函数在Pandas的Series或DataFrame对象上进行操作。下面的代码演示了如何使用NumPy的numpy.average()函数计算考生的总考试成绩:
import numpy as np

data = df.iloc[:, 13:16]
np.average(data.astype(np.float), axis=1, weights=[0.4, 0.3, 0.3])
这段代码首先从DataFrame中提取出包含考试成绩的三列数据,然后使用numpy.average()函数计算加权平均值。其中,axis=1表示按行进行计算,weights=[0.4, 0.3, 0.3]指定了每个列的权重。
另外,我们还可以直接在DataFrame中添加计算结果列。下面的代码演示了如何将加权平均值添加到DataFrame中:
del df['total']
df['total'] = np.average(df.iloc[:, 13:16].astype(np.float), axis=1, weights=[0.4, 0.3, 0.3])
这段代码
先删除原有的"total"列(如果存在),然后将新的加权平均值计算结果添加到"total"列中。

DataFrame进行排序
我们可以使用.sort_values()方法对DataFrame进行排序。下面的代码演示了如何按照"寿命"列进行降序排序:
df.sort_values(by='寿命', ascending=False)
这段代码将按照"寿命"列的值进行降序排序,并返回一个排序后的DataFrame。

除了单列排序,我们还可以指定多个列和多个排序方式进行排序。下面的代码演示了如何先按照"生年"列进行降序排序,然后再按照"寿命"列进行降序排序:
df.sort_values(by=['生年', '寿命'], ascending=[False, False])
这段代码将先按照"生年"列进行降序排序,对于生年相同的数据再按照"寿命"列进行降序排序。

DataFrame过滤数据
Pandas的过滤功能类似于在NumPy中使用布尔数组进行索引。下面的代码演示了如何根据条件过滤DataFrame中的数据:
filter_ = df['寿命'] >= 50
df[filter_]
这段代码首先根据条件"寿命大于等于50"生成一个布尔数组,并赋值给filter_变量。然后,使用df[filter_]返回满足条件的行数据。

我们还可以使用逻辑运算符进行多条件筛选。下面的代码演示了如何筛选出"生年大于等于80"且"寿命大于等于65"的数据:
df[(df['生年'] >= 80) & (df['寿命'] >= 65)]
这段代码使用&运算符对两个条件进行逻辑与操作,并返回满足条件的行数据。

此外,我们还可以使用.where()方法替换不满足条件的位置的值。下面的代码演示了如何将"登場"列中不满足条件"登場
大于等于220"的位置替换为0.0:
df['登場'].where(cond=df['登場'] >= 220, other=0.0)
这段代码使用.where()方法将不满足条件的位置的值替换为指定的other值。
DataFrame数据统计
我们可以使用.describe()方法获取DataFrame的基本统计信息。下面的代码演示了如何获取DataFrame的基本统计信息:
df.describe()
这段代码将返回DataFrame的基本统计信息,包括计数、均值、标准差、最小值、25%分位数、50%分位数、75%分位数和最大值等。
另外,我们还可以直接调用相应的方法获取特定统计信息。例如,可以使用.mean()方法获取DataFrame的均值:
df.mean()
这段代码将返回DataFrame的每列的均值。
也可以针对特定的列进行统计,例如:
df['total'].mean()
这段代码将返回"total"列的均值。
同样地,使用.std()方法可以获取DataFrame或特定列的标准差。
df.std()
df['total'].std()
DataFrame数据遍历
在遍历DataFrame时,我们可以使用.items()和.iteritems()方法遍历DataFrame的列。每次迭代都会产生一个以列名和列数据作为Series对象的元组。
下面的代码演示了如何使用.items()方法遍历DataFrame的列:
for col_label, col in df.iteritems():
    print(col_label, col, sep='\n', end='\n\n')
这段代码将依次打印出每列的列名和列数据。
同样地,我们还可以使用.iterrows()方法遍历DataFrame的行。下面的代码演示了如何使用.iterrows()方法遍历DataFrame的行:
for row_label, row in df.iterrows():
    print(row_label, row, sep='\n', end='\n\n')
这段代码将依次打印出每行的行索引和行数据。
块遍历
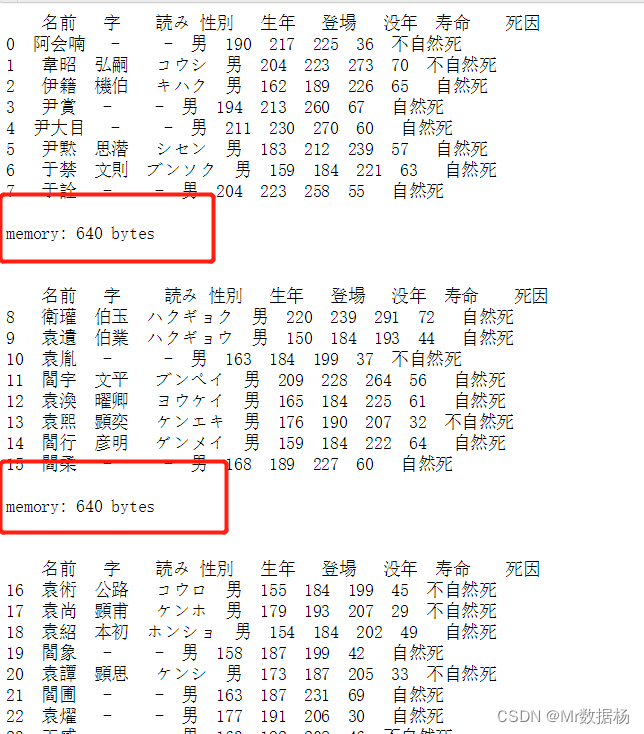
可以将数据拆分为较小的块并逐个处理。通过设置chunksize参数,可以将数据拆分为指定大小的块。
data_chunk = pd.read_csv('temp_data/data.csv', index_col=0, chunksize=8)
data_chunk
<pandas.io.parsers.TextFileReader object at 0x2587ef8a390>
结合for循环,拼接数据块以获取完整数据集。
示例代码:
for df_chunk in pd.read_csv('temp_data/data.csv', index_col=0, chunksize=8):
    print(df_chunk, end='\n\n')
    print('memory:', df_chunk.memory_usage().sum(), 'bytes', end='\n\n\n')
常用数据处理操作
随机抽样
使用sample()方法可以从Series,DataFrame随机选择行或列。该方法将默认采样行,并接受指定数量的行/列返回。
s = pd.Series([0,1,2,3,4,5])
s
0    0
1    1
2    2
3    3
4    4
5    5
dtype: int64
默认抽样为一个,也可以选择多个。
s.sample()
5    5
dtype: int64


s.sample(n=3)
5    5
3    3
2    2
dtype: int64
可以指定返回百分比,但是不能与n同时使用。
s.sample(frac=0.5)
1    1
4    4
0    0
dtype: int64
默认情况下,一行样本最多返回一次,即为无放回抽样。但也可以使用replace选项替换抽样方式。
s.sample(n=6, replace=False)
3    3
4    4
1    1
0    0
2    2
5    5
dtype: int64


s.sample(n=6, replace=True)
0    0
2    2
4    4
2    2
2    2
4    4
dtype: int64
默认情况下,每一行被选择的概率相等。但是如果希望各行具有不同的概率,则可以提供权重作为sample方法的抽样权重。权重可以是列表,数字数组或Series,但长度必须与要采样的对象长度相同。
如果权重之和不为1,那么函数会将所有权重除以权重之和来重新归一化。
example_weights = [0, 0, 0.2, 0.2, 0.2, 0.4]
s.sample(n=3, weights=example_weights)
5    5
4    4
3    3
dtype: int64


example_weights2 = [0.5, 0, 0, 0, 0, 0]
s.sample(n=1, weights=example_weights2)
0
dtype: int64
应用于DataFrame时,可以使用DataFrame的列作为采样权重(采样行而不是列的情况下),只需将列的名称作为字符串传递进去即可。
df2 = pd.DataFrame({'col1':[9,8,7,6], 'weight_column':[0.5, 0.4, 0.1, 0]})
df2
  col1	weight_column
0	9	0.5
1	8	0.4
2	7	0.1
3	6	0.0


df2.sample(n = 3, weights = 'weight_column')
   col1	weight_column
2	7	0.1
1	8	0.4
0	9	0.5
通过sample的axis参数可以对列进行采样。
df3 = pd.DataFrame({'col1':[1,2,3], 'col2':[2,3,4]})
df3
	col1	col2
0	1	2
1	2	3
2	3	4


df3.sample(n=1, axis=1)
	col2
0	2
1	3
2	4
如果需要重现随机结果,可以通过 random_state参数设置随机数种子。
df4 = pd.DataFrame({'col1':[1,2,3], 'col2':[2,3,4]})
df4
  col1	col2
0	1	2
1	2	3
2	3	4


df4.sample(n=2, random_state=2)
   col1	col2
2	3	4
1	2	3


df4.sample(n=2, random_state=2)
   col1	col2
2	3	4
1	2	3
缺失值处理
Pandas中主要使用np.nan来表示缺失的数据。默认情况下不会被包括在计算中。
df = pd.DataFrame(np.random.randn(5, 3),
                  index=['a', 'c', 'e', 'f', 'h'],
                  columns=['one', 'two', 'three'])

df['four'] = 'bar'
df['five'] = df['one'] > 0

df
          one	      two	   three	four five
a	-0.200007	-0.367818	0.731074	bar	False
c	0.385657	-1.837256	0.235959	bar	True
e	-0.096963	-0.608573	-0.321498	bar	False
f	-0.630936	0.498058	0.715187	bar	False
h	1.360360	-0.873389	1.138654	bar	True


df2 = df.reindex(['a', 'b', 'c', 'd', 'e', 'f', 'g', 'h'])
df2
         one	  two	    three	   four	five
a	-0.200007	-0.367818	0.731074	bar	False
b	NaN	NaN	NaN	NaN	NaN
c	0.385657	-1.837256	0.235959	bar	True
d	NaN	NaN	NaN	NaN	NaN
e	-0.096963	-0.608573	-0.321498	bar	False
f	-0.630936	0.498058	0.715187	bar	False
g	NaN	NaN	NaN	NaN	NaN
h	1.360360	-0.873389	1.138654	bar	True
为了使检测到的缺失值更容易(并且跨不同列和数据类型)。Pandas提供了isnull()和notnull()`函数,它们也是Series和DataFrame对象的方法。
pd.isnull(df2['one'])
a    False
b     True
c    False
d     True
e    False
f    False
g     True
h    False
Name: one, dtype: bool


df2.isnull()
      one	 two	three	four	five
a	False	False	False	False	False
b	True	True	True	True	True
c	False	False	False	False	False
d	True	True	True	True	True
e	False	False	False	False	False
f	False	False	False	False	False
g	True	True	True	True	True
h	False	False	False	False	False
需要注意的是在 NumPy 中 np.nan 之间是不同的。
None == None
True

np.nan == np.nan
False

type(np.nan)
float
这样的条件判断是无效的。
df2['one'] == np.nan
a    False
b    False
c    False
d    False
e    False
f    False
g    False
h    False
Name: one, dtype: bool
插入缺失值
根据实际的需要对缺失的数据部分进行插入填充。
df3 = df[['one', 'two', 'three']].copy()
df3.iloc[[0,1,-1],0] = np.nan
df3
     one	two	    three
a	NaN	-0.367818	0.731074
c	NaN	-1.837256	0.235959
e	-0.096963	-0.608573	-0.321498
f	-0.630936	0.498058	0.715187
h	NaN	-0.873389	1.138654


df2 = df.copy()
df2['timestamp'] = pd.Timestamp('20120101')
df2
          one	      two	   three	four five	timestamp
a	-0.200007	-0.367818	0.731074	bar	False	2012-01-01
c	0.385657	-1.837256	0.235959	bar	True	2012-01-01
e	-0.096963	-0.608573	-0.321498	bar	False	2012-01-01
f	-0.630936	0.498058	0.715187	bar	False	2012-01-01
h	1.360360	-0.873389	1.138654	bar	True	2012-01-01


df2.loc[['a','c','h'],['one','timestamp']] = np.nan
df2
       one	two	three	four	five	timestamp
a	NaN	-0.367818	0.731074	bar	False	NaT
c	NaN	-1.837256	0.235959	bar	True	NaT
e	-0.096963	-0.608573	-0.321498	bar	False	2012-01-01
f	-0.630936	0.498058	0.715187	bar	False	2012-01-01
h	NaN	-0.873389	1.138654	bar	True	NaT


df2.get_dtype_counts()
float64           3
object            1
bool              1
datetime64[ns]    1
dtype: int64
缺失值的运算
当进行求和运算时,缺失的数据将会被当作零来计算。如果数据全部为NA,那么结果也会返回NA。像 cumsum 和 cumprod 等方法回忽略NA值,但是会在返回的结果数组中回显示缺失的值。
df3
     one	  two	three
a	NaN	-0.367818	0.731074
c	NaN	-1.837256	0.235959
e	-0.096963	-0.608573	-0.321498
f	-0.630936	0.498058	0.715187
h	NaN	-0.873389	1.138654


df3['one'].sum()
-0.7278992566416747


df3.mean(1)
a    0.181628
c   -0.800649
e   -0.342345
f    0.194103
h    0.132633
dtype: float64


df3.cumsum()
     one	two	    three
a	NaN	-0.367818	0.731074
c	NaN	-2.205073	0.967032
e	-0.096963	-2.813647	0.645535
f	-0.727899	-2.315588	1.360722
h	NaN	-3.188978	2.499376
groupBy中的NA值,在groupBy中NA值会被直接忽略,这点同R相同。
df3.groupby('one').mean()
				two		three
one
-0.630936	0.498058	0.715187
-0.096963	-0.608573	-0.321498
清理/填补缺失数据
Pandas对象具有多种数据处理方法来处理缺失的数据。fillna方法可以通过几种方式将非空数据填补到NA值的位置。
使用标量填补。
df2
		one	two	three	four	five	timestamp
a	NaN	-0.367818	0.731074	bar	False	NaT
c	NaN	-1.837256	0.235959	bar	True	NaT
e	-0.096963	-0.608573	-0.321498	bar	False	2012-01-01
f	-0.630936	0.498058	0.715187	bar	False	2012-01-01
h	NaN	-0.873389	1.138654	bar	True	NaT


df2.fillna(0)
		one			two			three	four five	timestamp
a	0.000000	-0.367818	0.731074	bar	False	0
c	0.000000	-1.837256	0.235959	bar	True	0
e	-0.096963	-0.608573	-0.321498	bar	False	2012-01-01 00:00:00
f	-0.630936	0.498058	0.715187	bar	False	2012-01-01 00:00:00
h	0.000000	-0.873389	1.138654	bar	True	0


df2['four'].fillna('missing')
a    bar
c    bar
e    bar
f    bar
h    bar
Name: four, dtype: object
向前填充或向后填充。
df2
	one	two	three	four	five	timestamp
a	NaN	-0.367818	0.731074	bar	False	NaT
c	NaN	-1.837256	0.235959	bar	True	NaT
e	-0.096963	-0.608573	-0.321498	bar	False	2012-01-01
f	-0.630936	0.498058	0.715187	bar	False	2012-01-01
h	NaN	-0.873389	1.138654	bar	True	NaT


df2.fillna(method='bfill')
		one			two			three	four five	timestamp
a	-0.096963	-0.367818	0.731074	bar	False	2012-01-01
c	-0.096963	-1.837256	0.235959	bar	True	2012-01-01
e	-0.096963	-0.608573	-0.321498	bar	False	2012-01-01
f	-0.630936	0.498058	0.715187	bar	False	2012-01-01
h	NaN	-0.873389	1.138654	bar	True	NaT


df2.fillna(method='bfill', limit=1)
		one	two	three	four	five	timestamp
a	NaN	-0.367818	0.731074	bar	False	NaT
c	-0.096963	-1.837256	0.235959	bar	True	2012-01-01
e	-0.096963	-0.608573	-0.321498	bar	False	2012-01-01
f	-0.630936	0.498058	0.715187	bar	False	2012-01-01
h	NaN	-0.873389	1.138654	bar	True	NaT
其中填补。使用Pandas对象填充也可以使用可对齐的dict或Series进行填充。Series的index或dict的标签必须与要填充的框架的列匹配。
dff = pd.DataFrame(np.random.randn(10,3), columns=list('ABC'))
dff.iloc[3:5,0] = np.nan
dff.iloc[4:6,1] = np.nan
dff.iloc[5:8,2] = np.nan
dff
			A		B		C
0	0.404943	-0.602736	0.113672
1	-0.085921	-0.392214	1.522769
2	-0.921177	0.195829	0.609559
3	NaN	0.399573	1.271235
4	NaN	NaN	0.006467
5	0.491558	NaN	NaN
6	-0.531279	0.780372	NaN
7	0.080427	-1.372407	NaN
8	1.190015	-0.215549	0.877159
9	1.688949	1.995778	-0.157901


dff.fillna(dff.mean())
			A			B			C
0	0.404943	-0.602736	0.113672
1	-0.085921	-0.392214	1.522769
2	-0.921177	0.195829	0.609559
3	0.289689	0.399573	1.271235
4	0.289689	0.098581	0.006467
5	0.491558	0.098581	0.606137
6	-0.531279	0.780372	0.606137
7	0.080427	-1.372407	0.606137
8	1.190015	-0.215549	0.877159
9	1.688949	1.995778	-0.157901


dff.fillna(dff.mean()['B':'C'])
			A			B			C
0	0.404943	-0.602736	0.113672
1	-0.085921	-0.392214	1.522769
2	-0.921177	0.195829	0.609559
3	NaN	0.399573	1.271235
4	NaN	0.098581	0.006467
5	0.491558	0.098581	0.606137
6	-0.531279	0.780372	0.606137
7	0.080427	-1.372407	0.606137
8	1.190015	-0.215549	0.877159
9	1.688949	1.995778	-0.157901


dff.where(pd.notnull(dff), dff.mean(), axis='columns')
		A			B			C
0	0.404943	-0.602736	0.113672
1	-0.085921	-0.392214	1.522769
2	-0.921177	0.195829	0.609559
3	0.289689	0.399573	1.271235
4	0.289689	0.098581	0.006467
5	0.491558	0.098581	0.606137
6	-0.531279	0.780372	0.606137
7	0.080427	-1.372407	0.606137
8	1.190015	-0.215549	0.877159
9	1.688949	1.995778	-0.157901
删除缺失值
可以直接通过列操作删除缺失值所在的列数据。
df3["one"] = np.nan
df3
	one		two		three
a	NaN	-0.367818	0.731074
c	NaN	-1.837256	0.235959
e	NaN	-0.608573	-0.321498
f	NaN	0.498058	0.715187
h	NaN	-0.873389	1.138654


df3.dropna(axis=0)


df3.dropna(axis=1)
		two		three
a	-0.367818	0.731074
c	-1.837256	0.235959
e	-0.608573	-0.321498
f	0.498058	0.715187
h	-0.873389	1.138654
在删除缺失值时需要注意的是,DataFrame有两条轴,而Series只有一条,所以需要指定在哪条轴上操作。
df3['one'].dropna()
Series([], Name: one, dtype: float64)
插值
Series和Dataframe对象都具有插值方法,默认情况下,在缺少的数据点处执行线性插值。
ser = pd.Series([0.469112, np.nan, 5.689738, np.nan, 8.916232])
ser
0    0.469112
1         NaN
2    5.689738
3         NaN
4    8.916232
dtype: float64


ser.interpolate()
0    0.469112
1    3.079425
2    5.689738
3    7.302985
4    8.916232
dtype: float64


df = pd.DataFrame({'A': [1, 2.1, np.nan, 4.7, 5.6, 6.8],
                   'B': [.25, np.nan, np.nan, 4, 12.2, 14.4]})
df
	A	B
0	1.0	0.25
1	2.1	NaN
2	NaN	NaN
3	4.7	4.00
4	5.6	12.20
5	6.8	14.40


df.interpolate()
	A	B
0	1.0	0.25
1	2.1	1.50
2	3.4	2.75
3	4.7	4.00
4	5.6	12.20
5	6.8	14.40
其中可以通过参数来控制插值的方式,不同的参数对应不同的差值方式和插值算法。比如说:
- liner: 忽略索引对缺失部分进行等距的线性插值
- time: 在时间索引下,按日期或者更高的时间频率按等距进行插值。
- index, values: 使用索引的实际数值。
- 其他参数: 参见scipy内容。
df.interpolate(method='index')
	A	B
0	1.0	0.25
1	2.1	1.50
2	3.4	2.75
3	4.7	4.00
4	5.6	12.20
5	6.8	14.40


df.interpolate(method='akima')
		A			B
0	1.000000	0.250000
1	2.100000	-0.873316
2	3.406667	0.320034
3	4.700000	4.000000
4	5.600000	12.200000
5	6.800000	14.400000
当通过多项式或样条近似进行插值时,还需要传入order参数。
df.interpolate(method='polynomial', order=2)
		A			B
0	1.000000	0.250000
1	2.100000	-2.703846
2	3.451351	-1.453846
3	4.700000	4.000000
4	5.600000	12.200000
5	6.800000	14.400000
同样可以通过limit参数来限制插值的个数。
ser = pd.Series([np.nan, np.nan, 5, np.nan, np.nan, np.nan, 13])
ser
0     NaN
1     NaN
2     5.0
3     NaN
4     NaN
5     NaN
6    13.0
dtype: float64

ser.interpolate(limit=2)
0     NaN
1     NaN
2     5.0
3     7.0
4     9.0
5     NaN
6    13.0
dtype: float64


ser.interpolate(limit=1, limit_direction='backward')
0     NaN
1     5.0
2     5.0
3     NaN
4     NaN
5    11.0
6    13.0
dtype: float64


ser.interpolate(limit=1, limit_direction='both')
0     NaN
1     5.0
2     5.0
3     7.0
4     NaN
5    11.0
6    13.0
dtype: float64
对于Series,可以通过另一个值替换单个值或多个值,也可以使用列表对应替换,或者使用字典指定替换多个值,也可以使用填补的方式来进行替换。
ser = pd.Series([0., 1., 2., 3., 4.])

ser.replace(0, 5)
0    5.0
1    1.0
2    2.0
3    3.0
4    4.0
dtype: float64


ser.replace([0, 1, 2, 3, 4], [4, 3, 2, 1, 0])
0    4.0
1    3.0
2    2.0
3    1.0
4    0.0
dtype: float64


ser.replace({0: 10, 1: 100})
0     10.0
1    100.0
2      2.0
3      3.0
4      4.0
dtype: float64


ser.replace([1, 2, 3], method='pad')
0    0.0
1    0.0
2    0.0
3    0.0
4    4.0
dtype: float64
对于数据框可以通过列来替换单个值。
df = pd.DataFrame({'a': [0, 1, 2, 3, 4], 'b': [5, 6, 7, 8, 9]})
df
	a	b
0	0	5
1	1	6
2	2	7
3	3	8
4	4	9

df.replace({'a': 0, 'b': 5}, 100)
	a	b
0	100	100
1	1	6
2	2	7
3	3	8
4	4	9
字符串/正则表达式替换。
d = {'a': list(range(4)), 'b': list('ab..'), 'c': ['a', 'b', np.nan, 'd']}

df = pd.DataFrame(d)
df
a	b	c
0	0	a	a
1	1	b	b
2	2	.	NaN
3	3	.	d


df.replace('.', np.nan)
	a	b	c
0	0	a	a
1	1	b	b
2	2	NaN	NaN
3	3	NaN	d


df.replace(r'\s*\.\s*', np.nan, regex=True)
	a	b	c
0	0	a	a
1	1	b	b
2	2	NaN	NaN
3	3	NaN	d


df.replace(['a', '.'], ['b', np.nan])
	a	b	c
0	0	b	b
1	1	b	b
2	2	NaN	NaN
3	3	NaN	d


df.replace([r'\.', r'(a)'], ['dot', '\1stuff'], regex=True)
	a	b	c
0	0	stuff	stuff
1	1	b	b
2	2	dot	NaN
3	3	dot	d
分组运算-GroupBy
将对象拆分成组进行计算。
df = pd.DataFrame({'A' : ['foo', 'bar', 'foo', 'bar','foo', 'bar', 'foo', 'foo'],
                   'B' : ['one', 'one', 'two', 'three','two', 'two', 'one', 'three'],
                   'C' : np.random.randn(8),
                   'D' : np.random.randn(8)})
df
	A	B		C			D
0	foo	one	-0.295411	-0.023954
1	bar	one	-0.038355	-1.487147
2	foo	two	-1.330168	0.944055
3	bar	three	0.631081	-1.838887
4	foo	two	1.709427	2.071895
5	bar	two	0.789416	-0.166552
6	foo	one	2.000229	-0.267409
7	foo	three	0.036120	0.485465
可以使用一个或多个键执行GroupBy,键可以使用列或者行。
grouped = df.groupby('A')
grouped = df.groupby(['A', 'B'])

def get_letter_type(letter):
    if letter.lower() in 'aeiou':
        return 'vowel'
    else:
        return 'consonant'

grouped = df.groupby(get_letter_type, axis=1)
grouped.groups
{'consonant': Index(['B', 'C', 'D'], dtype='object'),
 'vowel': Index(['A'], dtype='object')}
默认情况下,在groupby操作期间会进行排序。可以通过sort = False来进行潜在的加速。
df3 = pd.DataFrame({'X' : ['A', 'B', 'A', 'B'], 'Y' : [1, 4, 3, 2]})
df3
	X	Y
0	A	1
1	B	4
2	A	3
3	B	2


df3.groupby(['X']).get_group('A')
	X	Y
0	A	1
2	A	3


df3.groupby(['X']).get_group('B')
	X	Y
1	B	4
3	B	2
GroupBy对象属性
df.groupby('A').groups
{'bar': Int64Index([1, 3, 5], dtype='int64'),
 'foo': Int64Index([0, 2, 4, 6, 7], dtype='int64')}


grouped = df.groupby(['A', 'B'])
grouped.groups
{('bar', 'one'): Int64Index([1], dtype='int64'),
 ('bar', 'three'): Int64Index([3], dtype='int64'),
 ('bar', 'two'): Int64Index([5], dtype='int64'),
 ('foo', 'one'): Int64Index([0, 6], dtype='int64'),
 ('foo', 'three'): Int64Index([7], dtype='int64'),
 ('foo', 'two'): Int64Index([2, 4], dtype='int64')}
查看分组个数。
len(grouped)
6
一旦创建了GroupBy对象,有几种方法可用于对分组数据执行计算。
grouped = df.groupby('A')
grouped.aggregate(np.sum)
		C			D
A
bar	1.382141	-3.492587
foo	2.120196	3.210052
默认键值会被作为新的多层的索引,可以使用as_index=False来控制作为列输出,或者在生成的对象上使用reset_index() 。
grouped.size()
		A    B
bar  one      1
     three    1
     two      1
foo  one      2
     three    1
     two      2
dtype: int64


grouped = df.groupby('A')
grouped['C'].agg([np.sum, np.mean, np.std])
		sum			mean	std
A
bar	1.382141	0.460714	0.439397
foo	2.120196	0.424039	1.403739
在DataFrame的分组上,传递一个应用于每个列的函数列表,该列产生具有分层索引的聚合结果。
grouped.agg([np.sum, np.mean, np.std])
							C									D
		sum			mean	std				sum			mean	std
A
bar	1.382141	0.460714	0.439397	-3.492587	-1.164196	0.881703
foo	2.120196	0.424039	1.403739	3.210052	0.642010	0.926129
如果需要对生成的列重新命名。
grouped['C'].agg([np.sum, np.mean, np.std]).rename(columns={'sum': 'foo',
                                                            'mean': 'bar',
                                                            'std': 'baz'})
		foo			bar			baz
A
bar	1.382141	0.460714	0.439397
foo	2.120196	0.424039	1.403739


grouped.agg([np.sum, np.mean, np.std]).rename(columns={'sum': 'foo','mean': 'bar','std': 'baz'})
								C									D
		foo			bar			baz			foo			bar			baz
A
bar	1.382141	0.460714	0.439397	-3.492587	-1.164196	0.881703
foo	2.120196	0.424039	1.403739	3.210052	0.642010	0.926129
对不同的列使用不同的函数。
grouped.agg({'C' : np.sum,
             'D' : lambda x: np.std(x, ddof=1)})
			C			D
A
bar	1.382141	0.881703
foo	2.120196	0.926129



![[NOIP2003 提高组] 加分二叉树](https://img-blog.csdnimg.cn/a2ecbc64b8394652a5963604458c3ac5.png)
