马上就要到六一儿童节了,小朋友很喜欢画画,这里就用Pyhton来画一些简单形状。
首先是圆形,圆形的寓意是圆满、完美、团圆、优胜和团结。圆形在形状上是一个平面中点到定点距离相等的图形,象征着圆满和完美,寓意着无所不容、和谐圆满。圆形在古代文化中象征着宇宙万物的状态,是宇宙意识的表现,代表着无极、圆满、饱满、和谐和神圣等意义。圆形也是中华民族传统上的吉祥图案,象征着团结、优胜、胜利和美好。此外,圆形还代表着团结和凝聚力,鼓励人们为了共同的目标而团结一致,齐心协力克服困难。圆形的寓意非常丰富和深刻,被广泛运用于建筑、文化、艺术、生活等多个领域中,代表着人们的追求和梦想。
下面我们用Python画个圆形:
用turtle画圆形
import turtle

# 设置画笔颜色和粗细
turtle.pencolor("black")
turtle.pensize(5)

# 绘制一个半径为100的圆形
turtle.circle(100)

# 隐藏画笔并保持窗口不关闭
turtle.hideturtle()
turtle.done()
Turtle库来绘制一个半径为100的圆形。

用matplotlib画圆形
import matplotlib.pyplot as plt
import numpy as np

# 创建一个空白的图形对象
fig, ax = plt.subplots()

# 定义圆形的中心和半径
center = (0, 0)
radius = 1

# 画圆形
theta = np.linspace(0, 2 * np.pi, 100)
x = center[0] + radius * np.cos(theta)
y = center[1] + radius * np.sin(theta)
ax.plot(x, y, color='r')

# 显示图形
plt.show()
首先创建一个空白图形对象,然后定义圆形的中心和半径。接着,我们使用np.linspace函数生成一组等间距的角度值,然后计算出对应的横坐标和纵坐标,最后使用ax.plot函数将圆形画出来。最后,我们调用plt.show函数来显示图形。

经常见小朋友们摆pose,用比心来做手势,用手比一个心形的动作来表达对粉丝或是朋友的友好表达方式,还可以用来表达喜欢、爱你、感谢等意思。该手势由于易懂易学,容易上手,经常出现在各大直播电视节目而被广泛应用。下面我们就用Python画个爱心。
用turtle画爱心
from turtle import *


# 定义函数为值love,目的是绘制爱心上方的曲线
def love():
    for i in range(200):  # 重复200次下面的代码
        right(1)
        forward(1)  # 画笔向前1像素


# 为爱心设置样式
pensize(2)  # 调整画笔粗细为2像素
speed(10)  # 调节画笔速度10
color('black', 'red')  # 画笔颜色及填充颜色
begin_fill()  # 开始填充
left(140)
forward(111.65)
love()  # 调用函数
left(120)
love()
forward(111.65)  # 调用函数
end_fill()  # 结束填充
hideturtle()  # 隐藏画笔
done()  # 结束运行,常用于python编辑器,idea等中

另一种方式:
import turtle
turtle.color('red', 'pink')
turtle.pensize(2)
turtle.pendown()
turtle.setheading(150)
turtle.begin_fill()
turtle.fd(50)
turtle.circle(50 * -3.745, 45)
turtle.circle(50 * -1.431, 165)
turtle.left(120)
turtle.circle(50 * -1.431, 165)
turtle.circle(50 * -3.745, 45)
turtle.fd(50)
turtle.end_fill()

matplotlib画心
import numpy as np
from matplotlib import pyplot as plt

# Creating equally spaced 100 data in range 0 to 2*pi
theta = np.linspace(0, 2 * np.pi, 100)

# Generating x and y data
x = 16 * ( np.sin(theta) ** 3 )
y = 13 * np.cos(theta) - 5* np.cos(2*theta) - 2 * np.cos(3*theta) - np.cos(4*theta)

# Plotting
plt.plot(x, y, color='red')

plt.title("Heart Shape")
plt.show()

这个心形用了两个公式。
import numpy as np
from matplotlib import pyplot as plt

plt.rcParams["figure.figsize"] = [7.50, 3.50]
plt.rcParams["figure.autolayout"] = True

x = np.linspace(-2, 2, 1000)
y1 = np.sqrt(1 - (abs(x) - 1) ** 2)
y2 = -3 * np.sqrt(1 - (abs(x) / 2) ** 0.5)

plt.fill_between(x, y1, color='red')
plt.fill_between(x, y2, color='red')

# plt.text(0, -1.0, 'Heart', fontsize=24, color='black',
# horizontalalignment='center')

plt.show()

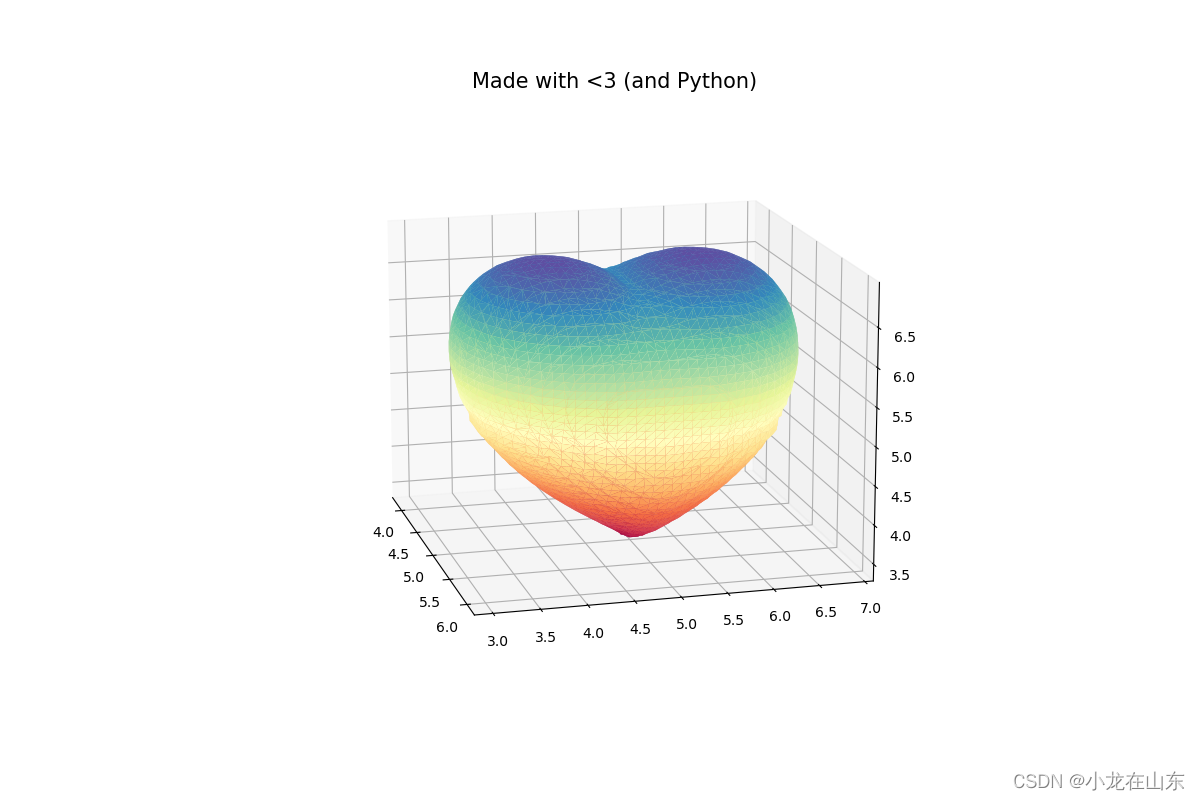
3D爱心
'''
=================================
3D heart shape in matplotlib
=================================
Demonstrates how to plot a 3D function in cartesian coordinates.
Uses the marching cubes algorithm in scikit-image to obtain a isosurface.
Example contributed by CAChemE.org
Adapted from: http://www.walkingrandomly.com/?p=2326
'''

from mpl_toolkits.mplot3d import Axes3D
from matplotlib import pyplot as plt
import numpy as np
from skimage import measure


# Set up mesh
n = 100

x = np.linspace(-3,3,n)
y = np.linspace(-3,3,n)
z = np.linspace(-3,3,n)
X, Y, Z =  np.meshgrid(x, y, z)

# Create cardioid function
def f_heart(x,y,z):
    F = 320 * ((-x**2 * z**3 -9*y**2 * z**3/80) +
               (x**2 + 9*y**2/4 + z**2-1)**3)
    return F

# Obtain value to at every point in mesh
vol = f_heart(X,Y,Z)

# Extract a 2D surface mesh from a 3D volume (F=0)
verts, faces, normals, values = measure.marching_cubes_lewiner(vol, 0,  spacing=(0.1, 0.1, 0.1))


# Create a 3D figure
fig = plt.figure(figsize=(12,8))
ax = fig.add_subplot(111, projection='3d')

# Plot the surface
ax.plot_trisurf(verts[:, 0], verts[:,1], faces, verts[:, 2],
                cmap='Spectral', lw=1)

# Change the angle of view and title
ax.view_init(15, -15)

# ax.set_title(u"Made with ❤ (and Python)", fontsize=15) # if you have Python 3
ax.set_title("Made with <3 (and Python)", fontsize=15)

# Show me some love ^^
plt.show()
让我们一起追寻童年的记忆,感悟童心的纯真,拥抱童年的无邪。祝福孩子们健康成长,快乐相伴,画出更加美好的未来!
