一、ANR介绍
ANR-application not response,应用无响应,应用开发者一般是关注自己的APP进程有没有出现,系统开发者会关注当前系统运行起来后整体上所有的APP进程有没有出现ANR,从这句话可以知道,只有应用进程的主线程(UI线程)超时可能导致ANR,我们从系统整体角度来阐述问题,顺便也能包含应用出现的ANR bug。
从现象来看,ANR出现时,会弹出一个应用无响应的弹框,当然也可能不弹,一是因为现在的设备厂商觉得这弹框难看,给去掉了,二是有些ANR本身就只有log记录,不会出现弹框。一直听到的就是不能在主线程做耗时操作,否则可能造成ANR,这里首先要明确:主线程做了大量耗时操作后,还得有事件产生,按键也好、点击触摸的touch事件也好,这样才会出现,整体上可以归成几类:
- 1、应用进程主线程导致,这里主要表现的就是activity-5s超时(会弹框),broadcast-10s超过,service-20s超时,三类超时后,再产生事件,这个事件无法传递给焦点窗口就会上报ANR
- 2、CPU耗尽
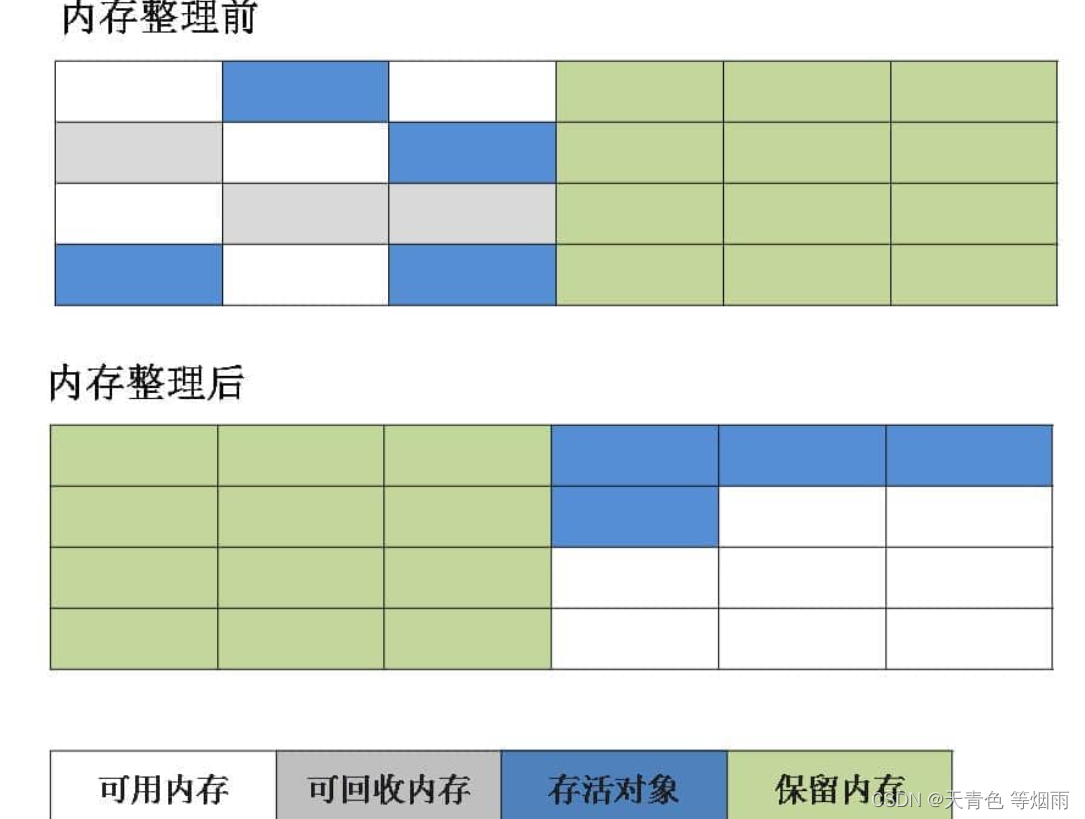
- 3、内存耗尽
简单来说,ANR就是产生的事件长时间没机会执行,Google就设计了这样一种提示用户的交互流程,防止用户以为设备手机坏成板砖了,如果没有这样的提醒,用户可能会说,这什么破手机、破系统,进而扣电池砸手机,有个弹框就能把问题聚焦到具体的某个APP上。因此CPU或者内存耗尽,它显然也会导致ANR的出现,恰好此时的APP上某个控件点击事件他就是无法执行(CPU功耗高,UI线程一直抢不到执行的时间片)而超时。内存耗尽也是同样的逻辑。可以看到,出现ANR的进程中,有时候是自身进程里导致的,也有是受了池鱼之灾,其他进程占用CPU太多,导致自己完全无法执行而出现。
二、ANR怎么入手分析
上面说了ANR是怎么一回事,以及ANR为什么会产生,接着我们来分析,出现ANR应该怎么查看,怎么追踪问题是哪里产生。出现ANR时(怎么让设备出现ANR日志,最简单的办法是shell命令:adb shell kill 3 pid)," data/anr/ “目录下会产生类似"anr_2022-03-29-15-45-53-142"这样命名的文件(老版本时ANR产生的日志叫” data/anr/ traces.txt",老版本只会记录最近一次ANR发生时的系统堆栈,高版本改了,默认可以存储64个文件,每发生一次ANR,就会生成一个文件),因此在产生ANR时取出日志,我们可以人为的制造一次ANR,很容易-activity的oncreate()周期里来个死循环,然后跳转这个activity后,点击屏幕,OK-anr_2022-03-29-15-45-53-142文件产生,下面来看如何分析ANR日志:
2.1、Traces文件详细分析
----- pid 30675 at 2022-03-29 15:45:53 ----- Cmd line: com.android.test
开头就是发生ANR的进程pid、时间、以及进程名,从开头的信息,系统开发人员就能把这个bug分给具体某个应用负责人了,当然有些时候发生ANR的进程可能没问题,是被别人给耽误了,所以接着往下看
Build fingerprint: ‘//*:10/QKQ1.210910.001/75:userdebug/release-keys’
ABI: ‘arm64’
Build type: optimized
Zygote loaded classes=9126 post zygote classes=318
Dumping registered class loaders
#0 dalvik.system.PathClassLoader: [], parent #1
#1 java.lang.BootClassLoader: [], no parent
#2 dalvik.system.PathClassLoader: [/system/framework/tcmclient.jar], parent #0
#3 dalvik.system.PathClassLoader: [], parent #0
#4 dalvik.system.PathClassLoader: [/data/app/com.android.test-o0YNE5m6e2qP5cEIcS4y8A==/base.apk:/data/app/com.android.test-o0YNE5m6e2qP5cEIcS4y8A==/base.apk!classes2.dex], parent #1
Done dumping class loaders
Intern table: 33006 strong; 438 weak
JNI: CheckJNI is on; globals=618 (plus 36 weak)
Libraries: /data/app/com.android.test-o0YNE5m6e2qP5cEIcS4y8A==/lib/arm64/libSRS.so libandroid.so libcompiler_rt.so libjavacore.so libjavacrypto.so libjnigraphics.so libmedia_jni.so libopenjdk.so libqti_performance.so libsoundpool.so libwebviewchromium_loader.so (11)
Heap: 24% free, 1468KB/1948KB; 40045 objects
这是发生ANR的应用进程一些信息,如果是自己的应用看着会觉得很熟悉,接着来
Dumping cumulative Gc timings
Start Dumping histograms for 1 iterations for concurrent copying
ProcessMarkStack: Sum: 12.241ms 99% C.I. 12.241ms-12.241ms Avg: 12.241ms Max: 12.241ms
ScanImmuneSpaces: Sum: 2.466ms 99% C.I. 2.466ms-2.466ms Avg: 2.466ms Max: 2.466ms
VisitConcurrentRoots: Sum: 1.220ms 99% C.I. 1.220ms-1.220ms Avg: 1.220ms Max: 1.220ms
ClearFromSpace: Sum: 850us 99% C.I. 850us-850us Avg: 850us Max: 850us
ThreadListFlip: Sum: 700us 99% C.I. 700us-700us Avg: 700us Max: 700us
FlipThreadRoots: Sum: 389us 99% C.I. 389us-389us Avg: 389us Max: 389us
ScanCardsForSpace: Sum: 358us 99% C.I. 358us-358us Avg: 358us Max: 358us
InitializePhase: Sum: 293us 99% C.I. 293us-293us Avg: 293us Max: 293us
GrayAllDirtyImmuneObjects: Sum: 174us 99% C.I. 174us-174us Avg: 174us Max: 174us
FlipOtherThreads: Sum: 142us 99% C.I. 142us-142us Avg: 142us Max: 142us
SweepSystemWeaks: Sum: 131us 99% C.I. 131us-131us Avg: 131us Max: 131us
EnqueueFinalizerReferences: Sum: 75us 99% C.I. 75us-75us Avg: 75us Max: 75us
VisitNonThreadRoots: Sum: 65us 99% C.I. 65us-65us Avg: 65us Max: 65us
ResumeRunnableThreads: Sum: 46us 99% C.I. 46us-46us Avg: 46us Max: 46us
(Paused)GrayAllNewlyDirtyImmuneObjects: Sum: 41us 99% C.I. 41us-41us Avg: 41us Max: 41us
MarkZygoteLargeObjects: Sum: 28us 99% C.I. 28us-28us Avg: 28us Max: 28us
CopyingPhase: Sum: 24us 99% C.I. 24us-24us Avg: 24us Max: 24us
RecordFree: Sum: 19us 99% C.I. 19us-19us Avg: 19us Max: 19us
ForwardSoftReferences: Sum: 17us 99% C.I. 17us-17us Avg: 17us Max: 17us
ProcessReferences: Sum: 16us 99% C.I. 3us-13us Avg: 8us Max: 13us
ReclaimPhase: Sum: 13us 99% C.I. 13us-13us Avg: 13us Max: 13us
EmptyRBMarkBitStack: Sum: 10us 99% C.I. 10us-10us Avg: 10us Max: 10us
(Paused)FlipCallback: Sum: 7us 99% C.I. 7us-7us Avg: 7us Max: 7us
(Paused)SetFromSpace: Sum: 6us 99% C.I. 6us-6us Avg: 6us Max: 6us
ResumeOtherThreads: Sum: 4us 99% C.I. 4us-4us Avg: 4us Max: 4us
(Paused)ClearCards: Sum: 2us 99% C.I. 250ns-2000ns Avg: 95ns Max: 2000ns
UnBindBitmaps: Sum: 1us 99% C.I. 1us-1us Avg: 1us Max: 1us
Done Dumping histograms
concurrent copying paused: Sum: 764us 99% C.I. 764us-764us Avg: 764us Max: 764us
concurrent copying freed-bytes: Avg: 49KB Max: 49KB Min: 49KB
Freed-bytes histogram: 0:1
concurrent copying total time: 19.399ms mean time: 19.399ms
concurrent copying freed: 262 objects with total size 49KB
concurrent copying throughput: 13789.5/s / 2586KB/s per cpu-time: 5032000/s / 4914KB/s
Average major GC reclaim bytes ratio 0.679411 over 1 GC cycles
Average major GC copied live bytes ratio 0.765451 over 4 major GCs
Cumulative bytes moved 5264536
Cumulative objects moved 117659
Peak regions allocated 226 (56MB) / 384 (96MB)
Start Dumping histograms for 1 iterations for young concurrent copying
ScanImmuneSpaces: Sum: 7.517ms 99% C.I. 7.517ms-7.517ms Avg: 7.517ms Max: 7.517ms
ProcessMarkStack: Sum: 7.348ms 99% C.I. 7.348ms-7.348ms Avg: 7.348ms Max: 7.348ms
VisitConcurrentRoots: Sum: 3.267ms 99% C.I. 3.267ms-3.267ms Avg: 3.267ms Max: 3.267ms
ClearFromSpace: Sum: 3.048ms 99% C.I. 3.048ms-3.048ms Avg: 3.048ms Max: 3.048ms
InitializePhase: Sum: 2.244ms 99% C.I. 2.244ms-2.244ms Avg: 2.244ms Max: 2.244ms
ScanCardsForSpace: Sum: 1.260ms 99% C.I. 1.260ms-1.260ms Avg: 1.260ms Max: 1.260ms
SweepSystemWeaks: Sum: 925us 99% C.I. 925us-925us Avg: 925us Max: 925us
GrayAllDirtyImmuneObjects: Sum: 713us 99% C.I. 713us-713us Avg: 713us Max: 713us
FlipOtherThreads: Sum: 324us 99% C.I. 324us-324us Avg: 324us Max: 324us
VisitNonThreadRoots: Sum: 254us 99% C.I. 254us-254us Avg: 254us Max: 254us
EnqueueFinalizerReferences: Sum: 204us 99% C.I. 204us-204us Avg: 204us Max: 204us
RecordFree: Sum: 126us 99% C.I. 1us-125us Avg: 63us Max: 125us
SweepArray: Sum: 110us 99% C.I. 110us-110us Avg: 110us Max: 110us
ThreadListFlip: Sum: 108us 99% C.I. 108us-108us Avg: 108us Max: 108us
(Paused)SetFromSpace: Sum: 77us 99% C.I. 77us-77us Avg: 77us Max: 77us
(Paused)ClearCards: Sum: 73us 99% C.I. 1us-26us Avg: 3.476us Max: 26us
CopyingPhase: Sum: 69us 99% C.I. 69us-69us Avg: 69us Max: 69us
(Paused)GrayAllNewlyDirtyImmuneObjects: Sum: 62us 99% C.I. 62us-62us Avg: 62us Max: 62us
ResumeRunnableThreads: Sum: 40us 99% C.I. 40us-40us Avg: 40us Max: 40us
ReclaimPhase: Sum: 33us 99% C.I. 33us-33us Avg: 33us Max: 33us
MarkZygoteLargeObjects: Sum: 31us 99% C.I. 31us-31us Avg: 31us Max: 31us
ProcessReferences: Sum: 28us 99% C.I. 5us-23us Avg: 14us Max: 23us
EmptyRBMarkBitStack: Sum: 26us 99% C.I. 26us-26us Avg: 26us Max: 26us
FreeList: Sum: 21us 99% C.I. 21us-21us Avg: 21us Max: 21us
ForwardSoftReferences: Sum: 20us 99% C.I. 20us-20us Avg: 20us Max: 20us
(Paused)FlipCallback: Sum: 8us 99% C.I. 8us-8us Avg: 8us Max: 8us
SwapBitmaps: Sum: 6us 99% C.I. 6us-6us Avg: 6us Max: 6us
FlipThreadRoots: Sum: 5us 99% C.I. 5us-5us Avg: 5us Max: 5us
ResumeOtherThreads: Sum: 3us 99% C.I. 3us-3us Avg: 3us Max: 3us
Done Dumping histograms
young concurrent copying paused: Sum: 314us 99% C.I. 314us-314us Avg: 314us Max: 314us
young concurrent copying freed-bytes: Avg: 3068KB Max: 3068KB Min: 3068KB
Freed-bytes histogram: 2880:1
young concurrent copying total time: 27.979ms mean time: 27.979ms
young concurrent copying freed: 6163 objects with total size 3068KB
young concurrent copying throughput: 228259/s / 110MB/s per cpu-time: 116376888/s / 110MB/s
Average minor GC reclaim bytes ratio 1.45298 over 1 GC cycles
Average minor GC copied live bytes ratio 0.0708724 over 2 minor GCs
Cumulative bytes moved 498176
Cumulative objects moved 4041
Peak regions allocated 226 (56MB) / 384 (96MB)
Total time spent in GC: 47.378ms
Mean GC size throughput: 63MB/s
Mean GC object throughput: 135590 objects/s
Total number of allocations 46469
Total bytes allocated 4565KB
Total bytes freed 3097KB
Free memory 480KB
Free memory until GC 480KB
Free memory until OOME 94MB
Total memory 1948KB
Max memory 96MB
Zygote space size 1508KB
Total mutator paused time: 1.078ms
Total time waiting for GC to complete: 16.563us
Total GC count: 2
Total GC time: 47.378ms
Total blocking GC count: 0
Total blocking GC time: 0
Native bytes total: 6988048 registered: 86288
Total native bytes at last GC: 6758872
/system/framework/oat/arm64/android.hidl.base-V1.0-java.odex: quicken
/system/framework/oat/arm64/android.hidl.manager-V1.0-java.odex: quicken
Current JIT code cache size: 3320B
Current JIT data cache size: 2264B
Current JIT mini-debug-info size: 8024B
Current JIT capacity: 64KB
Current number of JIT JNI stub entries: 0
Current number of JIT code cache entries: 9
Total number of JIT compilations: 5
Total number of JIT compilations for on stack replacement: 1
Total number of JIT code cache collections: 0
Memory used for stack maps: Avg: 243B Max: 480B Min: 40B
Memory used for compiled code: Avg: 953B Max: 2332B Min: 92B
Memory used for profiling info: Avg: 751B Max: 7776B Min: 24B
Start Dumping histograms for 18 iterations for JIT timings
Compiling: Sum: 25.341ms 99% C.I. 0.870ms-10.530ms Avg: 2.815ms Max: 10.701ms
TrimMaps: Sum: 2.896ms 99% C.I. 66us-887us Avg: 321.777us Max: 887us
Generate JIT debug info: Sum: 960us 99% C.I. 52us-247.750us Avg: 106.666us Max: 248us
Done Dumping histograms
Memory used for compilation: Avg: 110KB Max: 319KB Min: 17KB
ProfileSaver total_bytes_written=0
ProfileSaver total_number_of_writes=0
ProfileSaver total_number_of_code_cache_queries=0
ProfileSaver total_number_of_skipped_writes=0
ProfileSaver total_number_of_failed_writes=0
ProfileSaver total_ms_of_sleep=5000
ProfileSaver total_ms_of_work=0
ProfileSaver max_number_profile_entries_cached=0
ProfileSaver total_number_of_hot_spikes=0
ProfileSaver total_number_of_wake_ups=0
大家应该了解过Android虚拟机的逻辑内存以及GC回收机制,能看懂GC young、old等,接下来就是重点,关键字 “main”
DALVIK THREADS (13):
“main” prio=5 tid=1 Runnable
| group=“main” sCount=0 dsCount=0 flags=0 obj=0x72b31ec8 self=0x7dacf71c00
| sysTid=30675 nice=0 cgrp=default sched=0/0 handle=0x7dae4d9ed0
| state=R schedstat=( 63858980563 752954346 3029 ) utm=6370 stm=15 core=2 HZ=100
| stack=0x7ff146a000-0x7ff146c000 stackSize=8192KB
| held mutexes= “mutator lock”(shared held)
TraceBegin:
at com.android.test.MainActivity.onCreate(MainActivity.java:97)
at android.app.Activity.performCreate(Activity.java:7845)
at android.app.Activity.performCreate(Activity.java:7834)
at android.app.Instrumentation.callActivityOnCreate(Instrumentation.java:1307)
at android.app.ActivityThread.performLaunchActivity(ActivityThread.java:3246)
at android.app.ActivityThread.handleLaunchActivity(ActivityThread.java:3410)
at android.app.servertransaction.LaunchActivityItem.execute(LaunchActivityItem.java:83)
at android.app.servertransaction.TransactionExecutor.executeCallbacks(TransactionExecutor.java:135)
at android.app.servertransaction.TransactionExecutor.execute(TransactionExecutor.java:95)
at android.app.ActivityThreadH . h a n d l e M e s s a g e ( A c t i v i t y T h r e a d . j a v a : 2017 ) a t a n d r o i d . o s . H a n d l e r . d i s p a t c h M e s s a g e ( H a n d l e r . j a v a : 107 ) a t a n d r o i d . o s . L o o p e r . l o o p ( L o o p e r . j a v a : 214 ) a t a n d r o i d . a p p . A c t i v i t y T h r e a d . m a i n ( A c t i v i t y T h r e a d . j a v a : 7478 ) a t j a v a . l a n g . r e f l e c t . M e t h o d . i n v o k e ( N a t i v e m e t h o d ) a t c o m . a n d r o i d . i n t e r n a l . o s . R u n t i m e I n i t H.handleMessage(ActivityThread.java:2017) at android.os.Handler.dispatchMessage(Handler.java:107) at android.os.Looper.loop(Looper.java:214) at android.app.ActivityThread.main(ActivityThread.java:7478) at java.lang.reflect.Method.invoke(Native method) at com.android.internal.os.RuntimeInitH.handleMessage(ActivityThread.java:2017)atandroid.os.Handler.dispatchMessage(Handler.java:107)atandroid.os.Looper.loop(Looper.java:214)atandroid.app.ActivityThread.main(ActivityThread.java:7478)atjava.lang.reflect.Method.invoke(Nativemethod)atcom.android.internal.os.RuntimeInitMethodAndArgsCaller.run(RuntimeInit.java:492)
at com.android.internal.os.ZygoteInit.main(ZygoteInit.java:935)
TraceEnd:
用一个表格来解释这些参数含义
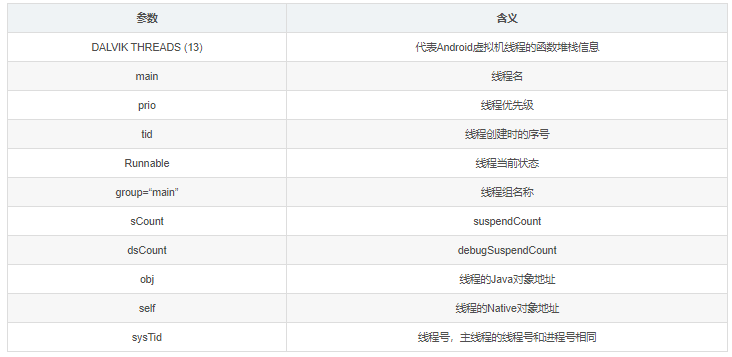
至于TraceBegin-end这里的运行时异常,就没必要说了,开头为了触发ANR写的死循环就在异常这里,很容易就能看出来。接下来看Binder线程
“Binder:30675_1” prio=5 tid=13 Native
| group=“main” sCount=1 dsCount=0 flags=1 obj=0x12c802d8 self=0x7d1bf43800
| sysTid=30694 nice=0 cgrp=default sched=0/0 handle=0x7cc3972d50
| state=S schedstat=( 2909010 9923125 18 ) utm=0 stm=0 core=4 HZ=100
| stack=0x7cc387c000-0x7cc387e000 stackSize=991KB
| held mutexes=
kernel: (couldn’t read /proc/self/task/30694/stack)
native: #00 pc 00000000000d10b4 /apex/com.android.runtime/lib64/bionic/libc.so (__ioctl+4)
native: #01 pc 000000000008b6b0 /apex/com.android.runtime/lib64/bionic/libc.so (ioctl+132)
native: #02 pc 0000000000058d24 /system/lib64/libbinder.so (android::IPCThreadState::talkWithDriver(bool)+244)
native: #03 pc 0000000000058f00 /system/lib64/libbinder.so (android::IPCThreadState::getAndExecuteCommand()+24)
native: #04 pc 00000000000596d8 /system/lib64/libbinder.so (android::IPCThreadState::joinThreadPool(bool)+64)
native: #05 pc 000000000007f978 /system/lib64/libbinder.so (android::PoolThread::threadLoop()+24)
native: #06 pc 00000000000135f0 /system/lib64/libutils.so (android::Thread::_threadLoop(void*)+328)
native: #07 pc 00000000000c5bd8 /system/lib64/libandroid_runtime.so (android::AndroidRuntime::javaThreadShell(void*)+140)
native: #08 pc 00000000000e68c0 /apex/com.android.runtime/lib64/bionic/libc.so (__pthread_start(void*)+36)
native: #09 pc 0000000000084b6c /apex/com.android.runtime/lib64/bionic/libc.so (__start_thread+64)
TraceBegin:
(no managed stack frames)
TraceEnd:
Binder线程是进程中线程池用来处理binder请求的线程,后面还有很多,看日志输出的格式没有差异,我们先把他们列举出来:
- Signal Catcher --signal信号,负责接收处理kernel发送的各种信号,Signal_quit(3)、6是非法地址越界、11是空指针好像,记不太清了可以百度signal信号能查到,traces文件就是由这个线程输出的,能看到线程状态是runnable
- Jit thread pool worker thread 0 --这是Java虚拟机的代码即时编译器?
- ADB-JDWP Connection Control Thread --支持虚拟机调试的线程
- HeapTaskDaemon --堆栈
- ReferenceQueueDaemon --引用队列
- FinalizerDaemon --释放对象前调用finalize
- FinalizerWatchdogDaemon --电子狗?
- Binder线程 --默认的话有三个binder线程
- Profile Saver --AS里的Profile
- RenderThread --开启硬件加速后,就会出现操作GPU的渲染线程 然后就完了,最后的目录我猜测它的意思是:打印traces日志是在哪个目录下代码执行的(明显它指的就是AMS在源码的路径),暂时先这么理解,哪天发现有错误,回头来改正
----- end 30675 ----- frameworks/base/services/core/java/com/android/server
作为一个资深的程序猿,应该要对线程的各种状态都了解,因为Android的代码分为Java端和native端(也就是c++),因此,线程也有这两端的差异,本质含义差不多,但是名称叫法有点出入(也就是线程状态的标志),记一遍就好,常量状态一般是用大写来命名,大写我就不认识单词了,全换成小写,理解意思就好:
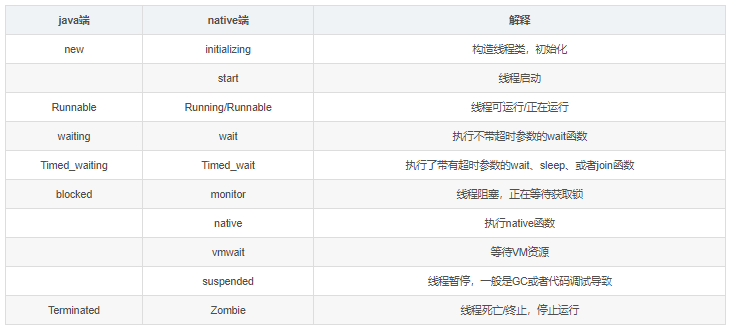
能看到c++侧,线程状态更多更细化一些,Traces日志中的线程状态是以c++端来赋值的,通过这个文件很容易看出ANR出问题的地方在:com.android.test.MainActivity.onCreate(MainActivity.java:97),翻代码就能找到97行来修改,当然实际开发中可能会遇到非常复杂,难以分辨出来的ANR。
2.2、cpu、内存使用率分析
上面我们说,ANR也可能是由于CPU占比太高,主线程一直抢不到时间片导致的,其实平时在做单元测试或者功能测试的时候,随时关注进程的CPU占比也是一个开发的好习惯,有三个shell命令要记住:
1、adb shell top --查看当前系统中排名前20的进程信息,以CPU占比排序(后边加 -p 进程号可以查看某个进程的详细信息),top命令可以查看系统中所有正在运行进程的CPU信息和meminfo,-p 进程号能够看到这一个进程宏观上的详细信息,可以把这些信息抓下来(adb shell top -b >D:***.txt) 2、adb shell dumpsys cpuinfo,dumpsys命令可以提供非常多的服务,总共好像有200+, 3、adb shell dumpsys meminfo
top命令可以从整体上来看系统当前的CPU和内存信息,也可以看某个进程的CPU与内存,能够看出来这个进程是否正常,但是具体哪一行代码导致的是无法定位的,解释下使用率,CPU使用率粗略的认为:一段时间T减去CPU空闲时间t后与这段时间的比例值,CPU使用率= (T - t)/T,在使用adb shell top 后 能看到有这样一行信息:
User 13%, System 5%, IOW 0%, IRQ 0% User 85 + Nice 0 + Sys 37 + Idle 509 + IOW 0 + IRQ 0 + SIRQ 0 = 631
User 处于用户态的运行时间,不包含优先值为负进程 Nice 优先值为负的进程所占用的CPU时间 Sys 处于核心态的运行时间 Idle 除IO等待时间以外的其它等待时间 IOW IO等待时间 IRQ 硬中断时间 SIRQ 软中断时间
PID PR CPU% S #THR VSS RSS PCY UID Name
0 13% S 56 423416K 88160K fg u0_a92 com.tmall.wireless
1 2% R 1 1232K 536K root top
0 1% S 46 341712K 40872K fg u0_a90 com.wandoujia.phoenix2.usbproxy
1 1% S 31 319976K 33284K fg u0_a74 com.android.Chinpower
0 1% S 32 67320K 20552K fg system /system/bin/surfaceflinger
0 1% S 112 445876K 80304K fg system system_server
…
0 0% S 1 0K 0K root watchdog/0
1 0% S 1 0K 0K root khelper
1 0% S 1 0K 0K root suspend_sys_syn
1 0% S 1 0K 0K root suspend
PID 进程id PR 优先级 CPU% 当前瞬时CPU占用率 S 进程状态:D=不可中断的睡眠状态, R=运行, S=睡眠, T=跟踪/停止, Z=僵尸进程 #THR 程序当前所用的线程数 VSS Virtual Set Size 虚拟耗用内存(包含共享库占用的内存) RSS Resident Set Size 实际使用物理内存(包含共享库占用的内存) PCY 调度策略优先级,SP_BACKGROUND/SP_FOREGROUND UID 进程所有者的用户id Name 进程的名称
CPU使用率的计算是在ProcessStats类中实现的。如果在某两个时刻T1和T2(T1 < T2)进行采样记录,CPU使用率的整个算法可以归纳为以下几个公式:
userTime = (user2 + nice2) – (user1 + nice1)
systemTime = system2 - system1
idleTime = idle2 - idle1
iowaitTime = iowait2 - iowait1
irqTime = irq2 - irq1
softirqTime = softirq2 - softirq1
TotalTime = userTime + systemTime + idleTime + iowaitTime + irqTime + softirqTime
有了以上数据就可以计算具体的使用率了,例如用户态CPU使用率为: userCpuUsage = userTime / TotalTime 依此类推可以计算其他类型的使用率。而整个时间段内CPU使用率为: CpuUsage = (TotalTime – idleTime) / TotalTime 以上计算的是整个系统的CPU使用率,对于指定进程的使用率是通过读取该进程的“/proc/进程号/stat”文件计算的,而对于指定进程的指定线程的使用率是通过读取该线程的“/proc/进程号/task/线程号/stat”文件计算的。进程和线程的CPU使用率只包含该进程或线程的总使用率、用户态使用率和内核态使用率。 AMS在执行appNotResponding函数过程中,共输出了两个时间段的CPU使用率,通常情况下在ANR发生时间点之前和之后各有一段。两段使用率都是两次调用ProcessStats对象的update函数,每次调用update函数时会保留上一时间点的采样数据,并记录当前时间点的采样数据。然后再调用ProcessStats对象的printCurrentState函数,按照上述公式归纳的算法计算CPU使用率,并输出最终的结果。 而对于内存相较于ANR的影响,由top命令观察到的进程内存变化已然够用。
三、Traces文件是怎么产生的
当我们拿到一个ANR的Traces文件后,已经知道如何来分析ANR,不过假使能够知道ANR文件的来龙去脉如何产生如何保存,必然更好:例如我现在就知道高版本上Traces文件被改名了、如果作为系统开发者,可以优化日志系统、当然最大的好处就是能够对ANR理解深刻等等。 不得不再次提起这句话:ANR的本质是在当前焦点窗口主线程在做耗时操作,此时又产生了一个事件(按键或者Touch事件),此时发现上一次事件执行超时,开始走ANR逻辑。很显然,要从事件这里入手,Android系统的事件由硬件产生,驱动节点"dev/input",处理事件的系统服务是InputManagerService,IMS服务运行在SystemServer进程,由startOtherServices函数负责启动,IMS的start函数中会调用jni函数nativeStart,在native层里主要逻辑都是由InputManager类完成,这个类中会启动两个线程:
- InputReaderThread–负责打开input事件驱动节点,接收硬件事件;
- InputDispatchThread–负责将InputReaderThread线程接收到的事件分发给具体的窗口
IMS会和WMS通信以确定哪个window是当前焦点窗口便于传递事件,是用LocalSocket通信 ,InputDispatchThread分发事件的过程中,会记录事件的分发时间,如果发现超时,就开起ANR的流程,因此说IMS中是ANR的起点,InputDispatcher调用notifyANR(InputMonitor是IMS和WMS通信的中间件),当InputReader从EventHub拿到事件后,从dispatchMotionLocked开始分发
/*frameworks\native\services\inputflinger\InputDispatcher.cpp*/
int32_t InputDispatcher::findTouchedWindowTargetsLocked(nsecs_t currentTime,
const MotionEntry* entry, std::vector<InputTarget>& inputTargets, nsecs_t* nextWakeupTime,
bool* outConflictingPointerActions) {
...
// Step1、判断触摸过的窗口是否都可以接收新的事件,这里就是判断这些窗口环境是否搭建好
for (const TouchedWindow& touchedWindow : mTempTouchState.windows) {
if (touchedWindow.targetFlags & InputTarget::FLAG_FOREGROUND) {
// Check whether the window is ready for more input.
std::string reason = checkWindowReadyForMoreInputLocked(currentTime,
touchedWindow.windowHandle, entry, "touched");
if (!reason.empty()) {
//Step2、出现模块的环境未配置好,
injectionResult = handleTargetsNotReadyLocked(currentTime, entry,
nullptr, touchedWindow.windowHandle, nextWakeupTime, reason.c_str());
goto Unresponsive;
}
}
}
for (const TouchedWindow& touchedWindow : mTempTouchState.windows) {
//Step3、成功为当前的事件找到符合的窗口,将其添加到inputTarget中
addWindowTargetLocked(touchedWindow.windowHandle, touchedWindow.targetFlags,
touchedWindow.pointerIds, inputTargets);
}
for (const TouchedMonitor& touchedMonitor : mTempTouchState.gestureMonitors) {
addMonitoringTargetLocked(touchedMonitor.monitor, touchedMonitor.xOffset,
touchedMonitor.yOffset, inputTargets);
}
...
}
/* 进这个函数的原因有很多,
1、system还未准备好,waiting
2、application未准备好,waiting
3、当前时间戳已经大于规定的target窗口超时时间--出现ANR*/
int32_t InputDispatcher::handleTargetsNotReadyLocked(nsecs_t currentTime,
const EventEntry* entry,
const sp<InputApplicationHandle>& applicationHandle,
const sp<InputWindowHandle>& windowHandle,
nsecs_t* nextWakeupTime, const char* reason) {
...
if (currentTime >= mInputTargetWaitTimeoutTime) {
onANRLocked(currentTime, applicationHandle, windowHandle,
entry->eventTime, mInputTargetWaitStartTime, reason);//很明显,ANR
// Force poll loop to wake up immediately on next iteration once we get the
// ANR response back from the policy.
*nextWakeupTime = LONG_LONG_MIN;
return INPUT_EVENT_INJECTION_PENDING;
}
...
}
void InputDispatcher::onANRLocked(
nsecs_t currentTime, const sp<InputApplicationHandle>& applicationHandle,
const sp<InputWindowHandle>& windowHandle,
nsecs_t eventTime, nsecs_t waitStartTime, const char* reason) {
float dispatchLatency = (currentTime - eventTime) * 0.000001f;
float waitDuration = (currentTime - waitStartTime) * 0.000001f;
ALOGI("Application is not responding: %s. "
"It has been %0.1fms since event, %0.1fms since wait started. Reason: %s",
getApplicationWindowLabel(applicationHandle, windowHandle).c_str(),
dispatchLatency, waitDuration, reason);
// Capture a record of the InputDispatcher state at the time of the ANR.
time_t t = time(nullptr);
struct tm tm;
localtime_r(&t, &tm);
char timestr[64];
strftime(timestr, sizeof(timestr), "%F %T", &tm);
mLastANRState.clear();
mLastANRState += INDENT "ANR:\n";
mLastANRState += StringPrintf(INDENT2 "Time: %s\n", timestr);
mLastANRState += StringPrintf(INDENT2 "Window: %s\n",
getApplicationWindowLabel(applicationHandle, windowHandle).c_str());
mLastANRState += StringPrintf(INDENT2 "DispatchLatency: %0.1fms\n", dispatchLatency);
mLastANRState += StringPrintf(INDENT2 "WaitDuration: %0.1fms\n", waitDuration);
mLastANRState += StringPrintf(INDENT2 "Reason: %s\n", reason);
dumpDispatchStateLocked(mLastANRState);
CommandEntry* commandEntry = postCommandLocked(
& InputDispatcher::doNotifyANRLockedInterruptible/*通知其他地方发生了ANR*/);
commandEntry->inputApplicationHandle = applicationHandle;
commandEntry->inputChannel = windowHandle != nullptr ?
getInputChannelLocked(windowHandle->getToken()) : nullptr;
commandEntry->reason = reason;
}
void InputDispatcher::doNotifyANRLockedInterruptible(
CommandEntry* commandEntry) {
mLock.unlock();
/*mPolicy是什么?
它是jni一路传递下来的PhoneWindoManager对象,在WMS创建时设置,接口是IMS的
WindowManagerCallbacks提供,因此最终回调的是PhoneWindowManager的notifyANR
PhoneWindowManager是windowManagerPolicy接口的实现类
*/
nsecs_t newTimeout = mPolicy->notifyANR(
commandEntry->inputApplicationHandle,
commandEntry->inputChannel ? commandEntry->inputChannel->getToken() : nullptr,
commandEntry->reason);
mLock.lock();
resumeAfterTargetsNotReadyTimeoutLocked(newTimeout,
commandEntry->inputChannel);
}
注意: mPolicy->notifyANR后(jni机制调用),流程走到IMS的notifyANR,
//com_android_server_input_InputManagerService.cpp
nsecs_t NativeInputManager::notifyANR(const sp<InputApplicationHandle>& inputApplicationHandle,
const sp<IBinder>& token, const std::string& reason) {
jlong newTimeout = env->CallLongMethod(mServiceObj,
gServiceClassInfo.notifyANR, tokenObj,
reasonObj);
if (checkAndClearExceptionFromCallback(env, "notifyANR")) {
newTimeout = 0; // abort dispatch
} else {
assert(newTimeout >= 0);
}
return newTimeout;
}
//InputManagerService.java
private long notifyANR(IBinder token, String reason) {
return mWindowManagerCallbacks.notifyANR(
token, reason);
}
//InputManagerCallback.java
@Override
public long notifyANR(IBinder token, String reason) {
//输入事件log打印,不同情况打印不一样。关键字Input event dispatching timed out
synchronized (mService.mGlobalLock) {
Slog.i(TAG_WM, "Input event dispatching timed out "
+ ...);
}
...
} else if (windowState != null) {
// Notify the activity manager about the timeout and let it decide whether
// to abort dispatching or keep waiting.
long timeout = mService.mAmInternal.inputDispatchingTimedOut(
windowState.mSession.mPid, aboveSystem, reason);
if (timeout >= 0) {
// The activity manager declined to abort dispatching.
// Wait a bit longer and timeout again later.
return timeout * 1000000L; // nanoseconds
}
}
return 0; // abort dispatching
}
//ActivityManagerService.java
@VisibleForTesting
public final class LocalService extends ActivityManagerInternal {
@Override
public long inputDispatchingTimedOut(int pid, boolean aboveSystem, String reason) {
synchronized (ActivityManagerService.this) {
return ActivityManagerService.this.inputDispatchingTimedOut(
pid, aboveSystem, reason);
}
}
}
long inputDispatchingTimedOut(int pid, final boolean aboveSystem, String reason) {
synchronized (this) {
timeout = proc != null ? proc.getInputDispatchingTimeout() : KEY_DISPATCHING_TIMEOUT_MS;
}
if (inputDispatchingTimedOut(proc, null, null, null, null, aboveSystem, reason)) {
return -1;
}
return timeout;
}
boolean inputDispatchingTimedOut(ProcessRecord proc, String activityShortComponentName,
ApplicationInfo aInfo, String parentShortComponentName,
WindowProcessController parentProcess, boolean aboveSystem, String reason) {
if (proc != null) {
proc.appNotResponding(activityShortComponentName, aInfo,
parentShortComponentName, parentProcess, aboveSystem, annotation);
}
return true;
}
流程很明确,最后调用到appNotResponding函数(frameworks/base/services/core/java/com/android/server/am/ProcessRecord.java),
void appNotResponding(String activityShortComponentName, ApplicationInfo aInfo,
String parentShortComponentName, WindowProcessController parentProcess,
boolean aboveSystem, String annotation) {
mWindowProcessController.appEarlyNotResponding(annotation, () -> kill("anr", true));
long anrTime = SystemClock.uptimeMillis();
if (isMonitorCpuUsage()) {
mService.updateCpuStatsNow();
}
synchronized (mService) {
// PowerManager.reboot() can block for a long time, so ignore ANRs while shutting down.
if (mService.mAtmInternal.isShuttingDown()) {
Slog.i(TAG, "During shutdown skipping ANR: " + this + " " + annotation);
return;
} else if (isNotResponding()) {
Slog.i(TAG, "Skipping duplicate ANR: " + this + " " + annotation);
return;
} else if (isCrashing()) {
Slog.i(TAG, "Crashing app skipping ANR: " + this + " " + annotation);
return;
} else if (killedByAm) {
Slog.i(TAG, "App already killed by AM skipping ANR: " + this + " " + annotation);
return;
} else if (killed) {
Slog.i(TAG, "Skipping died app ANR: " + this + " " + annotation);
return;
}
// In case we come through here for the same app before completing
// this one, mark as anring now so we will bail out.
setNotResponding(true);
// Log the ANR to the event log.
EventLog.writeEvent(EventLogTags.AM_ANR, userId, pid, processName, info.flags,
annotation);
// Dump thread traces as quickly as we can, starting with "interesting" processes.
firstPids.add(pid);
// Don't dump other PIDs if it's a background ANR
if (!isSilentAnr()) {
int parentPid = pid;
if (parentProcess != null && parentProcess.getPid() > 0) {
parentPid = parentProcess.getPid();
}
if (parentPid != pid) firstPids.add(parentPid);
if (MY_PID != pid && MY_PID != parentPid) firstPids.add(MY_PID);
for (int i = getLruProcessList().size() - 1; i >= 0; i--) {
ProcessRecord r = getLruProcessList().get(i);
if (r != null && r.thread != null) {
int myPid = r.pid;
if (myPid > 0 && myPid != pid && myPid != parentPid && myPid != MY_PID) {
if (r.isPersistent()) {
firstPids.add(myPid);
if (DEBUG_ANR) Slog.i(TAG, "Adding persistent proc: " + r);
} else if (r.treatLikeActivity) {
firstPids.add(myPid);
if (DEBUG_ANR) Slog.i(TAG, "Adding likely IME: " + r);
} else {
lastPids.put(myPid, Boolean.TRUE);
if (DEBUG_ANR) Slog.i(TAG, "Adding ANR proc: " + r);
}
}
}
}
}
}
// Log the ANR to the main log.
StringBuilder info = new StringBuilder();
info.setLength(0);
info.append("ANR in ").append(processName);
if (activityShortComponentName != null) {
info.append(" (").append(activityShortComponentName).append(")");
}
info.append("\n");
info.append("PID: ").append(pid).append("\n");
if (annotation != null) {
info.append("Reason: ").append(annotation).append("\n");
}
if (parentShortComponentName != null
&& parentShortComponentName.equals(activityShortComponentName)) {
info.append("Parent: ").append(parentShortComponentName).append("\n");
}
ProcessCpuTracker processCpuTracker = new ProcessCpuTracker(true);
ArrayList<Integer> nativePids = null;
// don't dump native PIDs for background ANRs unless it is the process of interest
String[] nativeProc = null;
if (isSilentAnr()) {
for (int i = 0; i < NATIVE_STACKS_OF_INTEREST.length; i++) {
if (NATIVE_STACKS_OF_INTEREST[i].equals(processName)) {
nativeProc = new String[] { processName };
break;
}
}
int[] pid = nativeProc == null ? null : Process.getPidsForCommands(nativeProc);
if(pid != null){
nativePids = new ArrayList<>(pid.length);
for (int i : pid) {
nativePids.add(i);
}
}
} else {
nativePids = Watchdog.getInstance().getInterestingNativePids();
}
//Step1、生成Traces文件
File tracesFile = ActivityManagerService.dumpStackTraces(firstPids,
(isSilentAnr()) ? null : processCpuTracker, (isSilentAnr()) ? null : lastPids,
nativePids);
String cpuInfo = null;
if (isMonitorCpuUsage()) {
mService.updateCpuStatsNow();
synchronized (mService.mProcessCpuTracker) {
cpuInfo = mService.mProcessCpuTracker.printCurrentState(anrTime);
}
info.append(processCpuTracker.printCurrentLoad());
info.append(cpuInfo);
}
info.append(processCpuTracker.printCurrentState(anrTime));
Slog.e(TAG, info.toString());
if (tracesFile == null) {
// There is no trace file, so dump (only) the alleged culprit's threads to the log
Process.sendSignal(pid, Process.SIGNAL_QUIT);
}
StatsLog.write(StatsLog.ANR_OCCURRED, uid, processName,
activityShortComponentName == null ? "unknown": activityShortComponentName,
annotation,
(this.info != null) ? (this.info.isInstantApp()
? StatsLog.ANROCCURRED__IS_INSTANT_APP__TRUE
: StatsLog.ANROCCURRED__IS_INSTANT_APP__FALSE)
: StatsLog.ANROCCURRED__IS_INSTANT_APP__UNAVAILABLE,
isInterestingToUserLocked()
? StatsLog.ANROCCURRED__FOREGROUND_STATE__FOREGROUND
: StatsLog.ANROCCURRED__FOREGROUND_STATE__BACKGROUND,
getProcessClassEnum(),
(this.info != null) ? this.info.packageName : "");
final ProcessRecord parentPr = parentProcess != null
? (ProcessRecord) parentProcess.mOwner : null;
mService.addErrorToDropBox("anr", this, processName, activityShortComponentName,
parentShortComponentName, parentPr, annotation, cpuInfo, tracesFile, null);
if (mWindowProcessController.appNotResponding(info.toString(), () -> kill("anr", true),
() -> {
synchronized (mService) {
mService.mServices.scheduleServiceTimeoutLocked(this);
}
})) {
return;
}
synchronized (mService) {
// mBatteryStatsService can be null if the AMS is constructed with injector only. This
// will only happen in tests.
if (mService.mBatteryStatsService != null) {
mService.mBatteryStatsService.noteProcessAnr(processName, uid);
}
if (isSilentAnr() && !isDebugging()) {
kill("bg anr", true);
return;
}
// Set the app's notResponding state, and look up the errorReportReceiver
makeAppNotRespondingLocked(activityShortComponentName,
annotation != null ? "ANR " + annotation : "ANR", info.toString());
// mUiHandler can be null if the AMS is constructed with injector only. This will only
// happen in tests.
if (mService.mUiHandler != null) {
// Bring up the infamous App Not Responding dialog
Message msg = Message.obtain();
msg.what = ActivityManagerService.SHOW_NOT_RESPONDING_UI_MSG;
msg.obj = new AppNotRespondingDialog.Data(this, aInfo, aboveSystem);
mService.mUiHandler.sendMessage(msg);
}
}
}
ActivityManagerService.dumpStackTraces,再调回到AMS里,由dumpStackTraces函数来创建并往文件中写入内容(data/anr/traces_**.txt),至此ANR分析完成。
以上就是Android开发中常会遇到的ANR介绍以及分析;Android开发中需要疑难核心知识点。需要深入的掌握;更多Android技术参考《Android核心技术分享手册》带你解决Android开发中的疑难问题。
文末
ANR 的全称是 Application No Responding,即应用程序无响应,具体是一些特定的 Message (Key Dispatch、Broadcast、Service) 在应用的UI线程(主线程)没有在规定的时间内处理完,进而触发 ANR 异常。
ANR 由消息处理机制保证,Android 在系统层实现了一套精密的机制来发现 ANR,核心原理是消息调度和超时处理。ANR 机制主体实现在系统层,所有与 ANR 相关的消息,都会经过系统进程 system_server调度,具体是 ActivityManagerService服务,然后派发到应用进程完成对消息的实际处理,同时,系统进程设计了不同的超时限制来跟踪消息的处理。 一旦应用程序处理消息不当,超时限制就起作用了,它收集一些系统状态,譬如 CPU/IO 使用情况、进程函数调用栈 CallStack,(有些平台比如 MTK,还会打印相应的 Message 出来供调试分析),最后报告用户有进程无响应了( ANR 对话框)。
ANR问题,相信是每位开发日常都会遇到的问题。如何更多问题可评论区或私信。


![[附源码]计算机毕业设计springboot学生综合数据分析系统](https://img-blog.csdnimg.cn/db61731a14cc45bbb0ac762be72cfa6e.png)

![[附源码]JAVA毕业设计简易在线教学系统(系统+LW)](https://img-blog.csdnimg.cn/7d60562ec015400eaddfd30f5b1d6ea9.png)