目录
💥1 概述
📚2 运行结果
🎉3 参考文献
👨💻4 Matlab代码
💥1 概述
CH(Contraction Hierarchies)算法是 Robert Geisberger、Peter Sanders、Dominik Schultes及Daniel Delling于2008年发布的,它是一种用于查找图形中最短路径的加速技术。最直观的应用是汽车导航系统:用户希望使用最快的路线从A行驶到B。此处优化的指标是行驶时间。交叉路口由顶点表示,街道路段由边连接。边的权重代表沿着这条街道行驶所需的时间。从A到B的路径是一系列边(街道);最短的路径是所有可能路径中边的权重总和最小的路径。
graph中的最短路径可以使用Dijkstra算法来计算,但考虑到道路网络包含数千万个顶点,这是不切实际的。CH算法是一种优化的加速方法,可以利用代表道路网络的图的特性。通过在预处理阶段创建“shortcuts”来实现提速,然后在最短路径查询中使用这些“shortcuts”来跳过“不重要的”顶点。这是基于对道路网络高度分层的观察。与一些通向小区内部路的路口相比,某些路口(例如高速公路路口)在层次结构中“更重要”并且在层次上更高。“shortcuts”可用于保存两个重要路口之间预先计算的距离,从而算法无需在查询时考虑这些路口之间的完整路径。CH不知道人类认为哪条道路“很重要”,但是它能够使用启发式方法计算出顶点的重要性。
CH方法不仅应用于汽车导航系统,而且还应用于Web和移动设备的路线规划、交通模拟和物流优化。有很多开源软件实现了该算法,例如GraphHopper、OSRM及OpenTripPlanner。
CH算法包括路网预处理和查询两个阶段。由于道路网络很少更改,因此可以预先进行一些计算(几秒钟到几小时),然后再进行查询,查询时间可以达到毫秒级。CH算法依靠“shortcuts”来实现这种加速。“shortcuts”线段连接两个不相邻的顶点 u和v,它的边权重是最短u-v路径上边权重的总和。
考虑通过高速公路连接的两个大城市。我们可以预先计算出两个城市之间高速公路的连接路线,将它保存起来。之后每次查询从一个城市到另一城市的路线时,只需要查询到本城市高速出入口的路线即可。这种预先计算的优势称为“shortcuts”,在现实世界中没有实际的路线。CH算法不了解道路类型,但是能够根据输入的图形来确定创建哪些“shortcuts”。
📚2 运行结果


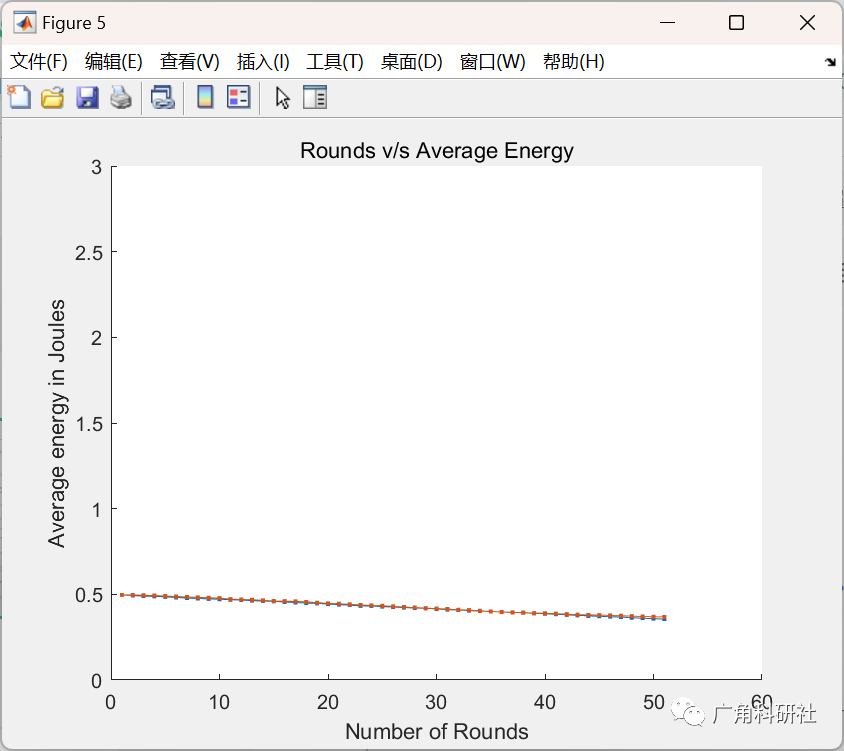
主函数部分代码:
%%
N=100; % number of nodes
area=[100,100]; % nodes deployment area in meter
Trange=7; % transmission range of sensor node in meter
nodes.pos=area(1).*rand(N,2);% nodes geographical locations
lambda=0.125; % signal wavelength in meter
nodes.major = Trange; % major axis for ellpitical range in meter
nodes.minor = lambda*Trange; % minro axis for ellipitical range in meter
% redundantNo=9; % number of healing nodes
redundantNo=round(10*N/100);
%% plot the nodes deployment
cnt=1;
for ii=1:N
for jj=1:N
if ii~=jj
nodes.distance(ii,jj)=pdist([nodes.pos(ii,:);nodes.pos(jj,:)]);
if nodes.distance(ii,jj)<Trange || nodes.distance(ii,jj)==Trange
nodes.inrange(ii,jj)=1;
else
nodes.inrange(ii,jj)=0;
end
end
end
end
figure
F5=plot(nodes.pos(:,1),nodes.pos(:,2),'.','color','r');
hold on
for ii=1:N % plot the circular transmission range
[nodes.circle.x(ii,:),nodes.circle.y(ii,:)]=circle(nodes.pos(ii,1),nodes.pos(ii,2),Trange);
F6=fill(nodes.circle.x(ii,:),nodes.circle.y(ii,:),[0.25,0.25,0.25]);
alpha 0.3
hold on
end
axis on
xlabel('x(m)')
ylabel('y(m)')
title('Initial Placement of Nodes with circular transmission range')
%% plot delauny triangle
TRI = delaunay(nodes.pos(:,1),nodes.pos(:,2));
figure(2)
F5 = plot(nodes.pos(:,1),nodes.pos(:,2),'.','color','r');
hold on
for ii=1:N % plot the circular transmission range
[nodes.circle.x(ii,:),nodes.circle.y(ii,:)]=circle(nodes.pos(ii,1),nodes.pos(ii,2),Trange);
F6=fill(nodes.circle.x(ii,:),nodes.circle.y(ii,:),[0.25,0.25,0.25]);
alpha 0.3
hold on
end
axis on
xlabel('x(m)')
ylabel('y(m)')
title('Coverage hole in initila position of Nodes')
hold on
triplot(TRI,nodes.pos(:,1),nodes.pos(:,2))
%% Hole detection
[holeDetected.circle,Circmcenter.circle,circumradius.circle]=holeDetection(TRI,nodes,F5,F6,Trange,area,2,1);
display(['--> No of detected Holes for Circular = ',num2str(numel(find(holeDetected.circle)))])
%% PSO optimize position of rest wsn nodes to cover the hole
nvars = 2*(N);
fun=@(x)objf(x,Trange,area);
lb=zeros(nvars,1);
ub=area(1).*ones(nvars,1);
options = optimoptions(@particleswarm,'Display','iter','MaxIterations',100,'PlotFcn','pswplotbestf');
[x,fval] = particleswarm(fun,nvars,lb,ub,options);
finalPos = reshape(x,[numel(x)/2,2]);
% plot the final tuned Node' pos
T = table(finalPos(:,1), finalPos(:,2));
writetable(T, '
somefile.txt
')
figure
plot(finalPos(:,1),finalPos(:,2),'
.
','
color
','
r
');
hold on
for ii=1:N % plot the circular transmission range
[finalcircle.x(ii,:),finalcircle.y(ii,:)]=circle(finalPos(ii,1),finalPos(ii,2),Trange);
fill(finalcircle.x(ii,:),finalcircle.y(ii,:),[0.25,0.25,0.25]);
alpha 0.3
hold on
end
axis on
xlabel('
x(m)
')
ylabel('
y(m)
')
title('
Optimized location of Nodes with circular transmission range
')
tp;
🎉3 参考文献
[1]包展鹏,郭龙,陈鹏.电动汽车移动充电的优化设计与仿真[J].系统仿真技术,2020,16(03):145-149.
部分理论引用网络文献,若有侵权联系博主删除。
