机器学习吴恩达笔记第一篇——基于梯度下降的线性回归(零基础)
一、线性回归——理论(单变量)
- 1、 假设函数h(x)为:
h ( x ) = θ 0 + θ 1 X h(x)=\theta_0+\theta_1 X h(x)=θ0+θ1X
- 2、要拟合数据成一条直线,需要该直线上的预测的h(x)的值减去原来数据的y值:
m i n i z e θ 0 , θ 1 ( J ( θ ) ) = ∑ i = 1 m ( h θ ( x i ) − y i ) 2 / 2 m \mathop{minize}\limits_{\theta_0,\theta_1} (J(\theta))=\sum\limits_{i=1}^m(h_\theta(x^i)-y^i)^2/2m θ0,θ1minize(J(θ))=i=1∑m(hθ(xi)−yi)2/2m
- 3、通过寻找一个合适的学习率与迭代次数来求得对应的 θ 0 , θ 1 \theta_0 , \theta_1 θ0,θ1;
repeat until end{ #迭代到结束
t
e
m
p
=
θ
j
−
α
×
(
∂
J
(
θ
)
∂
θ
j
)
temp=\theta_j-\alpha \times(\frac{\partial J(\theta)}{\partial \theta_j})
temp=θj−α×(∂θj∂J(θ))
θ
j
=
t
e
m
p
\theta_j=temp
θj=temp
}
-
注意: θ j \theta_j θj需要同时更新;
-
4、计算出来 θ \theta θ值后,我们来判断 J ( θ ) J(\theta) J(θ)是否收敛:就是绘制在迭代过程中 J ( θ ) J(\theta) J(θ)的值;

好了,理论部分就结束了,下一节就是介绍本节的基础知识;
二、基础知识(矩阵的乘法、梯度下降、学习率、迭代次数)
1.矩阵的乘法:
- 行乘列,列要与行相等;
import numpy as np
a=[1,2,3] #1*3
b=[4,5,6] #1*3
a=np.array(a)
b=np.array(b)
c=a.T*b
#a.T:3*1
#  b:1*3
print(c)
#[ 4 10 18]
2.梯度下降
**repeat until end{ ** #迭代到结束
θ j = θ j − α × ( ∂ J ( θ ) ∂ θ j ) \theta_j=\theta_j-\alpha \times(\frac{\partial J(\theta)}{\partial \theta_j}) θj=θj−α×(∂θj∂J(θ))
}
因为 J ( θ ) J(\theta) J(θ)是一个 ∑ i = 1 m ( h θ ( x i ) − y i ) 2 / 2 m \sum\limits_{i=1}^m(h_\theta(x^i)-y^i)^2/2m i=1∑m(hθ(xi)−yi)2/2m所以要求和;
- 使用迭代方法:
while i<iteration: #iteration=迭代次数;
    temp_0=sum((theta_0+theta_1*size+theta_2*num-price))        #theta_0
    temp_1=sum(size.T*(theta_0+theta_1*size+theta_2*num-price)) #theta_1
    i+=1
(theta_0+theta_1*size+theta_2*num-price)与size.T*(theta_0+theta_1*size+theta_2*num-price)都是求得偏导;
3.学习率
- 是决定收敛的重要条件:
- 收敛的时间长短:
- α \alpha α: 学习率;
repeat until end{ #迭代到结束
θ j = θ j − α × ( ∂ J ( θ ) ∂ θ j ) \theta_j=\theta_j-\alpha \times(\frac{\partial J(\theta)}{\partial \theta_j}) θj=θj−α×(∂θj∂J(θ))
}

当 α \alpha α合适的时候会快速收敛;
- 是否收敛:
当 α \alpha α太大会不收敛,反复横跳;
4.迭代次数

当迭代次数过少,就会不收敛;

次数太少,没有收敛;
三、实现的代码
- Python库
import matplotlib.pyplot as plt
import numpy as np
import math
- 读取文件
with open('ex1data1.txt','r') as f: # 文件划分;
    lines=f.readlines()
x=[]
y=[]
data=[]
for line in lines:
    data1=line.strip().split(',')
    x.append(float(data1[0]))
    y.append(float(data1[1]))
    data.append([float(data1[0]),float(data1[1])])
print(data)
- 画散点图
plt.scatter(x,y,c='red',marker='+',s=50,label='scatter') #散点图;
plt.xlabel('population')
plt.ylabel('predict')
plt.show()
在这里插入图片描述

- 直线方程
def h(a,b,x): #函数方程;
    return a+b*x
- 拟合直线
m=len(x)#长度
rates=[0.012]#,0.003,0.01,0.03,0.1,0.3,1,3] #学习率;
iterations=[10000]#,30,100,300,1000]  #迭代次数;
s=[]
#"""
for rate in rates: #学习率;
    for iteration in iterations: # 迭代次数;
        i=0
        theta_0=0
        theta_1=0
        # 从0开始;
        J=[]
        flag=0
        while i<iteration:
            total=0
            temp_0=0
            temp_1=0
            for j,k in data:
                temp_0+=(theta_0+theta_1*j-k)  #J(theta_0)的偏导部分;
                temp_1+=(theta_0+theta_1*j-k)*j #J(theta_1)的偏导部分;
            #采集J(theta);
            #更新theta_0与theta_1;
            theta_0=theta_0-(temp_0*rate/m)
            theta_1=theta_1-(temp_1*rate/m)
            i+=1
            for j,k in data:
                total+=math.pow((theta_0+theta_1*j-k),2)
            J.append(total/(2*m))
        theta=range(len(J)) #长度;
        print('最后一的斜率*学习率是:{}'.format(temp_0)) #最后一个的值
        print('最后一的值是:{} {}'.format(theta_0,theta_1))
        x=np.linspace(4,24,200)
        y=h(theta_0,theta_1,x)
        plt.plot(x,y,label='linear regression')
        plt.xlabel('theta')
        plt.ylabel('J(theta)')
        plt.legend()
plt.show()

- 合并起来的效果是:

多元线性回归
- 多元线性回归只需要将方程改为:
y = a + b × θ 0 + c × θ 1 y=a+b \times \theta_0+c \times \theta_1 y=a+b×θ0+c×θ1
从而按上面的步骤来一步一步的做;
# -*- coding: utf-8 -*-
"""
Created on Fri May 12 14:27:25 2023

@author: windows
"""
import matplotlib.pyplot as plt
import numpy as np
def h(a,b,c,x,y):
    return a+b*x+c*y
def normoalize_feature(data): #归一化;
    data1=[]
    for data2 in data:
     data1.append((data2-data2.mean())/data2.std())
    return data1
def get_data(data):
    with open(data,'r') as f:
        lines=f.readlines()
    size,num,price=[],[],[] #房子的大小,卧室的数量,房子的价格;
    for line in lines:
        data1=(line.strip().split(','))
        size.append(float(data1[0]))     #缩小特征值;km^2
        num.append(float(data1[1]))
        price.append(float(data1[2]))
    size,num,price=np.array(size),np.array(num),np.array(price)
    h=[size,num,price]
    return h
size,num,price=normoalize_feature(get_data('ex1data2.txt'))
print(size,num,price)
theta_0,theta_1,theta_2=0,0,0
# 3D
fig = plt.figure()
ax = fig.add_subplot(projection='3d')
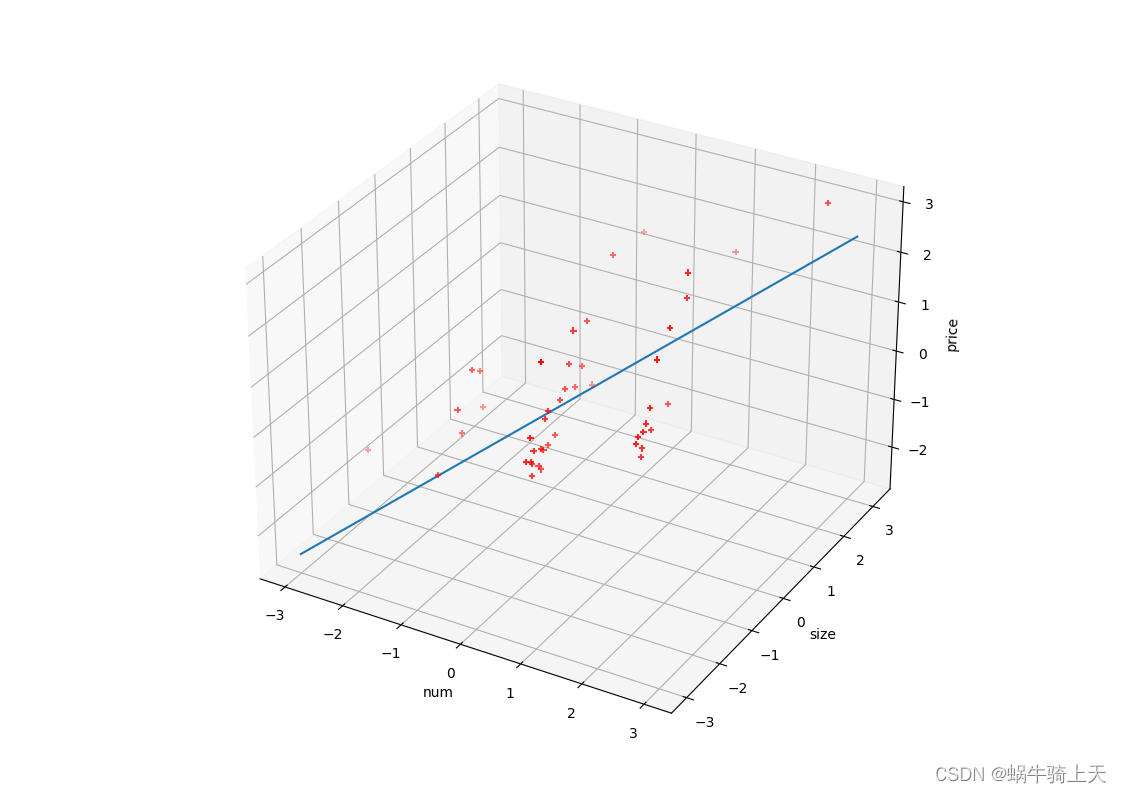
ax.scatter(num,size,price,marker='+',c='red',cmap='coolwarm')
ax.set_xlabel('num')
ax.set_ylabel('size')
ax.set_zlabel('price')

rate=0.012
iteration=100
i=0
J=[] #J(theta)的值;
total=0
m=len(size)
while i<iteration:
    #求theta;
    temp_0,temp_1,temp_2=0,0,0
    temp_0=sum((theta_0+theta_1*size+theta_2*num-price)) #theta_0
    temp_1=sum(size.T*(theta_0+theta_1*size+theta_2*num-price)) #theta_1;
    temp_2=sum(num.T*(theta_0+theta_1*size+theta_2*num-price))
    theta_0,theta_1,theta_2=theta_0-rate*temp_0,theta_1-rate*temp_1,theta_2-rate*temp_2
    total=(theta_0+theta_1*size+theta_2*num-price).T*(theta_0+theta_1*size+theta_2*num-price)
    J.append(sum(total)/2*m)
    i+=1
print(theta_0,theta_1,theta_2)
plt.subplot(projection='3d')
x=np.linspace(-3,3,200)
y=np.linspace(-3,3,200)
z=h(theta_0,theta_1,theta_2,x,y)
plt.plot(x,y,z)
plt.show()
效果就是:
