文章目录
- notebook@matplotlib🎈
- matplotlib backend
- backend
- frontend
- 后端类型
- AGG
- 配置后端
- Note@不区分大小写
- 三种配置方式
- 在matplotlibrc文件中使用rcParams["backend"]参数:
- 使用MPLBACKEND环境变量:
- 使用matplotlib.use()函数:
- 配置间的优先级
- 默认行为
- X display和Wayland display
- 后端的选择@The builtin backends
- 渲染引擎
- 什么默认使用raster渲染器?
- 非交互式后端🎈
- 将输出图保存为svg图
- 交互式后端
- eg 在jupyter notebook中使用qt渲染出图
- matplotlib.backend_bases
- matplotlib.backends
- matplotlib.backends.backend_tkagg
- 小结
- FAQ🎈
- conda notebook环境中提示后端导入错误问题😂
- 同一个环境启动多个ipython实例引发的问题🎈
- 查看可用后端列表:
- 使用matplotlib.get_backend检查当前后端
- 常见后端介绍
- matplotlib@tkagg
- 检查matplotlib后端模式🎈
- matplotlib_inline
- 更改matplotlib在notebook中出图的格式🎈
- 输出SVG格式的高清图像
- 示例图像`plot_sin_demo`
- 使用`savefig()`函数保存为SVG文件:
- 在Jupyter Notebook中内联显示SVG图形:
- 利用ipython输出svg高清图
- 将图形转换为SVG字符串:
- 小结
notebook@matplotlib🎈
Interactive figures — Matplotlib documentation
matplotlib backend
-
Backends — Matplotlib documentation
-
Matplotlib是一个Python绘图库,它包含多个GUI工具包的后端绑定,包括Qt、Tk、Wx、GTK、macOS和JavaScript等。
-
同时,第三方软件包也提供了与Kivy和Jupyter Lab的绑定。
-
为了使图形能够响应鼠标、键盘和绘图事件,GUI事件循环需要与交互式提示符集成。
-
我们建议使用IPython来实现这一点。
backend
-
A lot of documentation on the website and in the mailing lists refers to the “backend” and many new users are confused by this term. Matplotlib targets many different use cases and output formats.
- Some people use Matplotlib interactively from the Python shell and have plotting windows pop up when they type commands.
- Some people run Jupyter notebooks and draw inline plots for quick data analysis.
- Others embed Matplotlib into graphical user interfaces like PyQt or PyGObject to build rich applications.
- Some people use Matplotlib in batch scripts to generate postscript images from numerical simulations, and still others run web application servers to dynamically serve up graphs.
-
To support all of these use cases, Matplotlib can target different outputs, and each of these capabilities is called a backend;
-
网站和邮件列表中的许多文档都提到了“后端”,这个术语让许多新用户感到困惑。Matplotlib面向许多不同的用例和输出格式。有些人在Python shell中交互使用Matplotlib,并在键入命令时弹出绘图窗口。有些人运行Jupyter笔记本并绘制内联图以进行快速数据分析。其他人将Matplotlib嵌入到图形用户界面中,例如PyQt或PyGObject,以构建丰富的应用程序。有些人在批处理脚本中使用Matplotlib生成来自数值模拟的Postscript图像,还有些人运行Web应用程序服务器以动态提供图形。
为了支持所有这些用例,Matplotlib可以针对不同的输出,并且每个这样的功能被称为后端;
frontend
- the “frontend” is the user facing code, i.e., the plotting code, whereas the “backend” does all the hard work behind-the-scenes to make the figure.
- “前端”是用户面向的代码,即绘图代码,而“后端”则在幕后完成所有艰难的工作以生成图形。
后端类型
- There are two types of backends:
- user interface backends (for use in PyQt/PySide, PyGObject, Tkinter, wxPython, or macOS/Cocoa); also referred to as “interactive backends”) and
- hardcopy backends to make image files (PNG, SVG, PDF, PS; also referred to as “non-interactive backends”).
- 有两种类型的后端:用户界面后端(用于PyQt / PySide,PyGObject,Tkinter,wxPython或macOS / Cocoa;也称为“交互式后端”)
- 硬拷贝后端以生成图像文件(PNG,SVG,PDF,PS;也称为“非交互式后端”)。
AGG
- AGG是一种图形渲染库,全称为Anti-Grain Geometry。
- 它是一个高质量、平台无关的2D图形库,用于绘制矢量图形和栅格图像。
- Matplotlib可以使用AGG作为其中一种后端,以生成高质量的栅格图像,例如PNG、JPEG、PDF等。
- AGG后端支持抗锯齿和Alpha通道等高级特性,可以生成平滑、清晰的图像。
配置后端
Note@不区分大小写
The names of builtin backends case-insensitive; e.g., ‘QtAgg’ and ‘qtagg’ are equivalent.
三种配置方式
There are three ways to configure your backend:
-
The
rcParams["backend"]parameter in yourmatplotlibrcfile -
The
MPLBACKENDenvironment variable -
The function
matplotlib.use() -
Here is a detailed description of the configuration methods:
-
Setting
rcParams["backend"]in yourmatplotlibrcfile:backend : qtagg # use pyqt with antigrain (agg) renderingSee also Customizing Matplotlib with style sheets and rcParams.
-
Setting the
MPLBACKENDenvironment variable:You can set the environment variable either for your current shell or for a single script.
On Unix:
> export MPLBACKEND=qtagg
> python simple_plot.py

> MPLBACKEND=qtagg python simple_plot.py
On Windows, only the former is possible:
> set MPLBACKEND=qtagg
> python simple_plot.py
Setting this environment variable will override the
backendparameter in anymatplotlibrc, even if there is amatplotlibrcin your current working directory. Therefore, settingMPLBACKENDglobally, e.g. in your.bashrcor.profile, is discouraged as it might lead to counter-intuitive behavior. -
If your script depends on a specific backend you can use the function
matplotlib.use():import matplotlib matplotlib.use('qtagg')This should be done before any figure is created, otherwise Matplotlib may fail to switch the backend and raise an ImportError.
Using
usewill require changes in your code if users want to use a different backend. Therefore, you should avoid explicitly callinguseunless absolutely necessary.使用
use需要动到代码文件,因此通常情况下尽量不要使用,否则会增加维护负担(类似于html中使用内联样式)
-
在matplotlibrc文件中使用rcParams[“backend”]参数:
matplotlibrc文件是控制matplotlib行为的配置文件。您可以在该文件中设置各种参数,包括后端参数。要在该文件中设置后端,请找到rcParams字典并将其设置为所需的后端名称。例如,要将后端设置为Qt5Agg,请在文件中添加以下行:
backend: Qt5Agg
使用MPLBACKEND环境变量:
您可以通过设置MPLBACKEND环境变量来配置后端。在您的终端中,使用以下命令将环境变量设置为所需的后端名称:
export MPLBACKEND=Qt5Agg
这将把后端设置为Qt5Agg。请注意,这种方法只对当前终端会话有效。
使用matplotlib.use()函数:
您还可以在Python代码中使用matplotlib.use()函数来设置后端。例如,要将后端设置为Qt5Agg,请在代码中添加以下行:
import matplotlib
matplotlib.use('Qt5Agg')
请注意,您必须在导入任何其他matplotlib模块之前调用此函数。此外,如果您在Jupyter笔记本中使用此方法,则应在笔记本的第一行中包含以下行:
%matplotlib inline
这将确保Jupyter笔记本使用所选的后端来绘制图形。
配置间的优先级
- If there is more than one configuration present, the last one from the list takes precedence;
- e.g. calling
matplotlib.use()will override the setting in yourmatplotlibrc.
默认行为
- Without a backend explicitly set, Matplotlib automatically detects a usable backend based on what is available on your system and on whether a GUI event loop is already running.
- The first usable backend in the following list is selected: MacOSX, QtAgg, GTK4Agg, Gtk3Agg, TkAgg, WxAgg, Agg. The last, Agg, is a non-interactive backend that can only write to files. It is used on Linux, if Matplotlib cannot connect to either an X display or a Wayland display.
- 如果没有显式设置后端,Matplotlib会根据您的系统上可用的后端以及GUI事件循环是否已经在运行来自动检测可用的后端。
- 在下面的列表中,第一个可用的后端将被选择:MacOSX、QtAgg、GTK4Agg、Gtk3Agg、TkAgg、WxAgg、Agg。
- 最后一个后端Agg是一个非交互式的后端,只能将图形写入文件。
- 如果Matplotlib无法连接到X display或Wayland display,则在Linux上使用它。
X display和Wayland display
- X display和Wayland display是Linux系统上的两种图形显示协议。
- X display(也称为X11或X Window System)是最常见的Linux图形显示协议之一。它允许远程计算机通过网络连接到图形应用程序的运行实例,因此它非常适合用于远程计算机的图形应用程序。在基于X的系统上,Matplotlib可以使用X显示器来显示图形窗口。
- Wayland display是一种相对较新的Linux图形显示协议,旨在替代X display。与X display不同,Wayland display更加现代化和安全,具有更好的性能和更低的延迟。
- 但是,由于它的相对较新,一些应用程序可能不支持它。在基于Wayland的系统上,Matplotlib可以使用Wayland显示器来显示图形窗口。
后端的选择@The builtin backends
By default, Matplotlib should automatically select a default backend which allows both interactive work and plotting from scripts, with output to the screen and/or to a file, so at least initially, you will not need to worry about the backend. The most common exception is if your Python distribution comes without tkinter and you have no other GUI toolkit installed. This happens with certain Linux distributions, where you need to install a Linux package named python-tk (or similar).
- If, however, you want to write graphical user interfaces, or a web application server (Embedding in a web application server (Flask)), or need a better understanding of what is going on, read on. To make things easily more customizable for graphical user interfaces, Matplotlib separates the concept of the renderer (the thing that actually does the drawing) from the canvas (the place where the drawing goes).
- The canonical renderer for user interfaces is
Aggwhich uses the Anti-Grain Geometry C++ library to make a raster (pixel) image of the figure; - it is used by the
QtAgg,GTK4Agg,GTK3Agg,wxAgg,TkAgg, andmacosxbackends. An alternative renderer is based on the Cairo library, used byQtCairo, etc.
渲染引擎
For the rendering engines, users can also distinguish between vector or raster renderers. Vector graphics languages issue drawing commands like “draw a line from this point to this point” and hence are scale free. Raster backends generate a pixel representation of the line whose accuracy depends on a DPI setting.
-
对于Matplotlib的渲染引擎,用户还可以区分矢量或光栅渲染器。
-
矢量图形语言发出绘制命令,如“从这个点画一条线到这个点”,因此不受缩放的影响。
-
光栅后端生成线的像素表示,其准确性取决于DPI设置。
-
矢量渲染器使用数学公式和几何图形来描述图像,因此图像可以随意缩放而不失真。常见的矢量渲染器包括PDF、SVG和EPS等。
-
光栅渲染器使用像素网格来描述图像,并将图像分解为像素,每个像素都有其颜色和亮度值。因此,光栅图像不能无限缩放而不失真,其精度取决于所使用的DPI(每英寸点数)值。常见的光栅渲染器包括PNG、JPEG和BMP等。
-
Matplotlib的默认后端Agg是一个光栅渲染器,它会生成像素化的图像。但是,Matplotlib还提供了一些矢量后端,例如PDF和SVG,可以生成无损矢量图像。
什么默认使用raster渲染器?
-
Matplotlib的默认后端Agg使用光栅渲染器,主要是为了性能和兼容性考虑。
-
光栅渲染器可以快速生成图像,特别是对于大型或复杂的图像,它可以提供更好的渲染性能。相比之下,矢量渲染器需要更多的计算和内存来绘制图像,因此在某些情况下可能会更慢。
-
此外,光栅渲染器常常能够更好地与不同的操作系统和硬件兼容,因为它们生成的图像格式(如PNG、JPEG等)是标准的图像格式,可以在几乎任何系统上查看。相比之下,矢量图像格式如PDF、SVG等可能需要特定的软件或浏览器才能查看,这可能会限制其兼容性。
-
然而,如果您需要绘制高质量、可无限缩放的图像,则可以选择使用矢量渲染器,例如PDF或SVG后端。这些后端可以生成无损矢量图像,保留图像的所有细节和信息,并且可以随意缩放。
-
Here is a summary of the Matplotlib renderers (there is an eponymous backend for each)
非交互式后端🎈
-
Here is a summary of the Matplotlib renderers (there is an eponymous backend for each;)
-
“Eponymous” 是一个形容词,用来形容一个事物的名称和这个事物本身是相同的,即名称和事物的本体相同。
-
在Matplotlib的上下文中,每个渲染器都有一个相应的后端,这个后端的名称和渲染器本身的名称相同,因此可以使用 “eponymous” 来形容这种关系
-
these are non-interactive backends, capable of writing to a file
| Renderer | Filetypes | Description |
|---|---|---|
| AGG | png | raster graphics – high quality images using the Anti-Grain Geometry engine. |
| vector graphics – Portable Document Format output. | ||
| PS | ps, eps | vector graphics – PostScript output. |
| SVG | svg | vector graphics – Scalable Vector Graphics output. |
| PGF | pgf, pdf | vector graphics – using the pgf package. |
| Cairo | png, ps, pdf, svg | raster or vector graphics – using the Cairo library (requires pycairo or cairocffi). |
将输出图保存为svg图
- To save plots using the non-interactive backends, use the
matplotlib.pyplot.savefig('filename')method.
交互式后端
These are the user interfaces and renderer combinations supported;
these are interactive backends, capable of displaying to the screen and using appropriate renderers from the table above to write to a file:这些是matplotlib支持的用户界面和渲染器的组合;他们是交互式后端,能够显示到屏幕并使用上面表格中适当的渲染器来写入文件:
| Backend | Description |
|---|---|
| QtAgg | Agg rendering in a Qt canvas (requires PyQt or Qt for Python, a.k.a. PySide). This backend can be activated in IPython with %matplotlib qt. The Qt binding can be selected via the QT_API environment variable; see Qt Bindings for more details. |
| ipympl | Agg rendering embedded in a Jupyter widget (requires ipympl). This backend can be enabled in a Jupyter notebook with %matplotlib ipympl. |
| GTK3Agg | Agg rendering to a GTK 3.x canvas (requires PyGObject and pycairo). This backend can be activated in IPython with %matplotlib gtk3. |
| GTK4Agg | Agg rendering to a GTK 4.x canvas (requires PyGObject and pycairo). This backend can be activated in IPython with %matplotlib gtk4. |
| macosx | Agg rendering into a Cocoa canvas in OSX. This backend can be activated in IPython with %matplotlib osx. |
| TkAgg | Agg rendering to a Tk canvas (requires TkInter). This backend can be activated in IPython with %matplotlib tk. |
| nbAgg | Embed an interactive figure in a Jupyter classic notebook. This backend can be enabled in Jupyter notebooks via %matplotlib notebook. |
| WebAgg | On show() will start a tornado server with an interactive figure. |
| GTK3Cairo | Cairo rendering to a GTK 3.x canvas (requires PyGObject and pycairo). |
| GTK4Cairo | Cairo rendering to a GTK 4.x canvas (requires PyGObject and pycairo). |
| wxAgg | Agg rendering to a wxWidgets canvas (requires wxPython 4). This backend can be activated in IPython with %matplotlib wx. |
eg 在jupyter notebook中使用qt渲染出图
-
将这段代码粘贴到jupyter notebook上运行
%matplotlib qt

import matplotlib.pyplot as plt
import numpy as np

# 生成数据
x = np.linspace(0, 10, 100)
y = np.sin(x)

# 绘制图形
fig, ax = plt.subplots()
ax.plot(x, y)

# 显示图形界面
plt.show()
matplotlib.backend_bases
- Abstract base classes define the primitives that renderers and graphics contexts must implement to serve as a Matplotlib backend.(后端基类)
matplotlib.backends
-
matplotlib.backends — Matplotlib documentation
-
A subpackage with modules for various GUI libraries and output formats.
matplotlib.backends.backend_tkagg
- matplotlib.backends.backend_tkagg 是一个 Matplotlib 的后端模块,它允许将 Matplotlib 图形嵌入到 Tkinter GUI 应用程序中。
- Tkinter 是 Python 的一个标准图形用户界面库,用于创建简单的桌面应用程序。
- 通过使用 backend_tkagg,我们可以将 Matplotlib 图表集成到 Tkinter 应用程序中,从而实现交互式数据可视化。
以下是使用 matplotlib.backends.backend_tkagg 的一个简单示例:
import tkinter as tk
from matplotlib.backends.backend_tkagg import FigureCanvasTkAgg
from matplotlib.figure import Figure
import numpy as np

def plot_graph():
    # 创建一个简单的图形
    fig = Figure(figsize=(5, 4), dpi=100)
    ax = fig.add_subplot(111)
    t = np.arange(0, 3, .01)
    ax.plot(t, 2 * np.sin(2 * np.pi * t))

    # 将图形嵌入到 Tkinter 窗口中
    canvas = FigureCanvasTkAgg(fig, master=root)
    canvas.draw()
    canvas.get_tk_widget().pack(side=tk.TOP, fill=tk.BOTH, expand=1)

root = tk.Tk()
root.title("Matplotlib in Tkinter")

plot_button = tk.Button(master=root, text="Plot", command=plot_graph)
plot_button.pack(side=tk.BOTTOM)

root.mainloop()
- 在这个示例中,我们首先导入了所需的库,然后定义了一个名为 plot_graph 的函数。
- 这个函数创建了一个简单的 Matplotlib 图形,并使用 FigureCanvasTkAgg 将其嵌入到 Tkinter 窗口中。
- 最后,我们创建了一个按钮,当单击该按钮时,将调用 plot_graph 函数并显示图形。
小结
matplotlib.backends 模块是一个与特定的绘图后端(backends)相关的子模块,用于处理与绘图显示、保存等相关的底层任务。在 matplotlib 中,后端分为三类:
- 用户界面后端(User Interface backends):用于绘制交互式图形界面,例如 Tkinter、Qt、GTK 等。
- 硬拷贝后端(Hardcopy backends):用于生成图像文件(如 PNG、SVG、PDF 等)。
- 渲染器后端(Renderer backends):处理矢量和栅格图形的绘制。
通常情况下,你不需要直接与 matplotlib.backends 模块交互,因为 matplotlib 会自动选择合适的后端。但在某些情况下,你可能需要手动设置后端。这时,你可以使用 matplotlib.use() 函数。
matplotlib.use(backend) 允许你指定使用的后端。这个函数需要在导入 pyplot 之前调用,因为它会设置后端相关的全局变量。例如,如果你想在生成的图像中使用 ‘Agg’ 后端,可以这样做:
import matplotlib
matplotlib.use('Agg')
import matplotlib.pyplot as plt
为了避免混淆相关概念,请注意以下几点:
matplotlib.backends是一个与后端相关的子模块,而matplotlib.use()是一个用于设置后端的函数。- 通常情况下,你不需要手动设置后端,除非需要使用特定的后端或解决兼容性问题。
- 在导入
pyplot之前调用matplotlib.use()函数。
希望以上解释能帮助你理解 matplotlib.backends 模块以及如何使用 matplotlib.use() 函数。在大多数情况下,你只需关注 matplotlib.pyplot 模块的使用,后端会自动处理好。
FAQ🎈
conda notebook环境中提示后端导入错误问题😂
-
Error:
Failed to import any qt binding -
这可能时conda环境过于复杂或混合使用conda install 和 pip install 安装了相关包(notebook,matplotlib)
-
可以尝试创建一个一个全新的环境来后体验相关功能
-
requirements.txt-
pyside6 matplotlib pluggy #You may need to install pluggy manually for notebook dependency notebook -
上述安装列表全部使用pip安装,可以减少不必要的错误
-
-
pip install -r requirements.txt
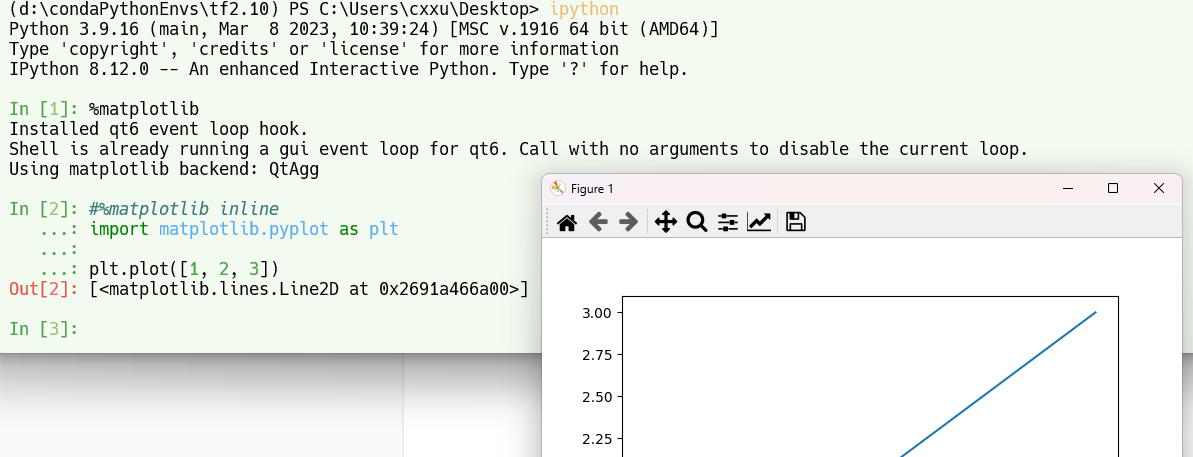
同一个环境启动多个ipython实例引发的问题🎈
-
假设我使用powershell在
tf2.0这个环境下启动了ipython -
在vscode中用notebook执行
%matplotlib可能会提示如下:Using matplotlib backend: <object object at 0x0000023A7FC56CA0>
-
这种情况下是无法进行后端切换的,需要退出终端(powershell)中的实例然后重试
-
-
此外,我还在vscode中做过试验,如果
终端(vscode集成terminal)和vscode+notebook启用的是同一个conda环境(例如tf2.10),那么会导致notebook通过%matplotlib有几率会是一个形如:Using matplotlib backend: <object object at 0x0000.....0>的对象,这时候进行绘图会弹出的窗口会卡死! -
因此建议进行交互matplotlib不要切换为qt后端,或者不要实例多开同一个conda 环境!(使用
conda deactivate关闭不需要的环境)
查看可用后端列表:
-
%matplotlib --list-
Available matplotlib backends: ['tk', 'gtk', 'gtk3', 'gtk4', 'wx', 'qt4', 'qt5', 'qt6', 'qt', 'osx', 'nbagg', 'webagg', 'notebook', 'agg', 'svg', 'pdf', 'ps', 'inline', 'ipympl', 'widget']
-
-
%matplotlib可查询当前的后端(默认为TkAgg)-
使用
%matplotlib qt可以修改为:QtAgg -
查询结果
Using matplotlib backend: QtAgg
-
-
二次指定将会触发警报
-
Warning: Cannot change to a different GUI toolkit: qt. Using tk instead. -
如果想要二次切换后端,需要重启notebook(restart kernel)
-
使用matplotlib.get_backend检查当前后端
-
import matplotlib as mpl
mpl.get_backend()
'module://matplotlib_inline.backend_inline'
-
%matplotlibUsing matplotlib backend: <object object at 0x0000027F55E1EC60>
-
两种查询方式中,如果结果是
backend_inline,第一种更加清晰 -
这种情况下,通常是有其他地方(比如终端启用了同一个环境,执行
conda deactivate后再试)
常见后端介绍
Matplotlib是一个功能强大的绘图库,支持多种不同的后端,可以将图形渲染到不同的设备上。以下是Matplotlib当前可用的后端:
- tk:使用Tkinter GUI库,Matplotlib图形将显示在一个独立的Tkinter窗口中。
- gtk,gtk3和gtk4:使用GTK图形工具包,Matplotlib图形将显示在一个独立的GTK窗口中。
- wx:使用wxWidgets GUI库,Matplotlib图形将显示在一个独立的wxWidgets窗口中。
- qt4,qt5和qt6:使用Qt GUI库,Matplotlib图形将显示在一个独立的Qt窗口中。
- osx:使用Mac OS X的本地GUI库,Matplotlib图形将显示在一个独立的窗口中。
- nbagg:使用Notebook Agg后端,Matplotlib图形将嵌入到Jupyter Notebook中,并支持交互式绘图。
- webagg:使用Web Agg后端,Matplotlib图形将在Web浏览器中显示,并支持交互式绘图。
- notebook:使用Notebook后端,Matplotlib图形将嵌入到Jupyter Notebook中。
- agg:使用Anti-Grain Geometry库,Matplotlib图形将作为位图渲染。
- svg:使用SVG(可缩放矢量图形)格式渲染Matplotlib图形。
- pdf:使用PDF格式渲染Matplotlib图形。
- ps:使用PostScript格式渲染Matplotlib图形。
- inline:使用Matplotlib Inline后端,Matplotlib图形将直接嵌入到Jupyter Notebook中。
- ipympl:使用ipywidgets和jupyter-matplotlib库,Matplotlib图形将嵌入到Jupyter Notebook中,并支持交互式绘图。
- widget:使用ipywidgets库,Matplotlib图形将嵌入到Jupyter Notebook中,并支持交互式绘图。
这些后端的选择取决于你的具体需求,例如是否需要交互式绘图或需要将图形保存为矢量图形。
matplotlib@tkagg
-
Matplotlib 是一个流行的 Python 绘图库,它提供了各种绘图功能,包括折线图、散点图、柱状图、等高线图等。
-
TkAgg 是 Matplotlib 的一个后端,它可以将 Matplotlib 绘图输出到 Tkinter 窗口中。
-
下面是一个简单的示例,展示如何使用 Matplotlib TkAgg 后端在 Tkinter 窗口中绘制一条简单的折线图:
-
import tkinter as tk
import matplotlib.pyplot as plt
from matplotlib.backends.backend_tkagg import FigureCanvasTkAgg

# Create tkinter window
root = tk.Tk()
root.geometry('500x500')

# Create matplotlib figure
fig = plt.Figure()
ax = fig.add_subplot(111)
x = [1, 2, 3, 4, 5]
y = [2, 4, 3, 1, 5]
ax.plot(x, y)

# Add matplotlib figure to tkinter window
canvas = FigureCanvasTkAgg(fig, master=root)
canvas.get_tk_widget().pack()

# Start tkinter event loop
tk.mainloop()
-
-
在这个例子中,我们首先创建了一个
Tkinter窗口,并指定了其大小为 500x500。 -
然后,我们创建了一个
Matplotlib Figure对象,并向其中添加一个Axes 子图。- 在这个子图中,我们使用
plot方法绘制了一个简单的折线图。
- 在这个子图中,我们使用
-
接下来,我们使用
FigureCanvasTkAgg类将Matplotlib Figure 对象(fig)添加到Tkinter 窗口中。- 我们首先将 Matplotlib Figure 对象传递给
FigureCanvasTkAgg类的构造函数 - 然后使用
get_tk_widget方法获取一个 Tkinter 组件,该组件包含了 Matplotlib 绘图的输出。
- 我们首先将 Matplotlib Figure 对象传递给
-
最后,我们使用
pack方法将该组件添加到 Tkinter 窗口中的某个位置。 -
我们使用
mainloop方法启动 Tkinter 事件循环,以便用户可以与窗口进行交互。 -
这只是一个简单的示例,但它展示了如何使用 Matplotlib TkAgg 后端在 Tkinter 窗口中绘制图形。
- 你可以使用 Matplotlib 绘制各种类型的图形,并将它们嵌入到 Tkinter 窗口中。
- Embedding in Tk — Matplotlib documentation
检查matplotlib后端模式🎈
-
要检查Jupyter Notebook是否自动启用了
%matplotlib inline命令,可以执行以下步骤:-
打开Jupyter Notebook
-
在Notebook中新建一个代码单元格
-
输入以下代码并执行它:
%matplotlib inline import matplotlib.pyplot as plt plt.plot([1, 2, 3]) -
观察输出结果
如果图像显示在Notebook中,且无需调用
plt.show()方法,那么Jupyter Notebook就已经自动启用了%matplotlib inline命令。否则,您需要手动使用%matplotlib inline命令来启用Magplotlib的嵌入式模式。在Notebook中,您也可以通过运行以下代码来检查当前的Matplotlib后端:
import matplotlib print(matplotlib.get_backend()) -
-
如果输出结果为
'module://ipykernel.pylab.backend_inline',则表示当前的Matplotlib后端为内嵌式(inline)模式。
matplotlib_inline
-
ipython/matplotlib-inline: Inline Matplotlib backend for Jupyter (github.com)
-
Note that in current versions of JupyterLab and Jupyter Notebook, the explicit use of the
%matplotlib inlinedirective is not needed anymore, though other third-party clients may still require it. -
def use_svg_display(): #@save """使用svg格式在Jupyter中显示绘图""" backend_inline.set_matplotlib_formats('svg') -
from matplotlib_inline import backend_inline
更改matplotlib在notebook中出图的格式🎈
- matplotlib - jupyter notebook inline plots as svg - Stack Overflow
- Built-in magic commands — IPython documentation
输出SVG格式的高清图像
- 在Matplotlib中,可以使用多种方法将图形导出为SVG格式。
- 以下是一些常见的方法:
示例图像plot_sin_demo
- 以下几种方法使用
plot_sin_demo来演示,以便突出重点 - 该函数返回带有正弦图像的plt对象
def plot_sin_demo():
    import numpy as np
    import matplotlib.pyplot as plt
    # 创建一个简单的图形
    x = np.linspace(0, 10, 100)
    y = np.sin(x)

    plt.plot(x, y)
    plt.xlabel('x')
    plt.ylabel('sin(x)')
    # 显示图像
    return plt

# plt=plot_sin_demo()
使用savefig()函数保存为SVG文件:
-
savefig函数文档
In [1]: import matplotlib.pyplot as plt In [2]: plt.savefig? Signature: plt.savefig(*args, **kwargs) Docstring: Save the current figure. ... -
plt=plot_sin_demo()

# 将图形保存为SVG文件
plt.savefig('sin_wave_demo.svg', format='svg')
#注意显示函数show()应该在savefig()执行之后调用,plt.show()默认显示的像素图,而不是svg图
#此后调用savefig指定格式可能不生效!
plt.show()
# 关闭图形
plt.close()
在Jupyter Notebook中内联显示SVG图形:
要在Jupyter Notebook中内联显示SVG图形,需要在Notebook的开头执行以下魔法命令:
%config InlineBackend.figure_format = 'svg'
然后,您可以像往常一样创建和显示图形。这将自动将图形以SVG格式显示在Notebook中。
plot_sin_demo()
利用ipython输出svg高清图
from matplotlib_inline.backend_inline import set_matplotlib_formats
set_matplotlib_formats('svg')

plt=plot_sin_demo()
plt.show()
- 此外,notebook通过
%matplotlib魔术命令设置matplotlib的一些行为.
将图形转换为SVG字符串:
如果您希望将图形转换为SVG字符串,可以使用io.StringIO和FigureCanvasSVG:
import numpy as np
import matplotlib.pyplot as plt
from matplotlib.backends.backend_svg import FigureCanvasSVG
import io

# 创建一个简单的图形
x = np.linspace(0, 10, 100)
y = np.sin(x)

fig, ax = plt.subplots()
ax.plot(x, y)
ax.set_xlabel('x')
ax.set_ylabel('sin(x)')

# 将图形转换为SVG字符串
output = io.StringIO()
canvas = FigureCanvasSVG(fig)
canvas.print_svg(output)

# 获取SVG字符串
svg_string = output.getvalue()

# 关闭图形
plt.close(fig)

# 打印SVG字符串(或将其用于其他目的)
print(svg_string)
<?xml version="1.0" encoding="utf-8" standalone="no"?>
<!DOCTYPE svg PUBLIC "-//W3C//DTD SVG 1.1//EN"
  "http://www.w3.org/Graphics/SVG/1.1/DTD/svg11.dtd">
<svg xmlns:xlink="http://www.w3.org/1999/xlink" width="460.8pt" height="345.6pt" viewBox="0 0 460.8 345.6" xmlns="http://www.w3.org/2000/svg" version="1.1">
 <metadata>
  <rdf:RDF xmlns:dc="http://purl.org/dc/elements/1.1/" xmlns:cc="http://creativecommons.org/ns#" xmlns:rdf="http://www.w3.org/1999/02/22-rdf-syntax-ns#">
   <cc:Work>
    <dc:type rdf:resource="http://purl.org/dc/dcmitype/StillImage"/>
    <dc:date>2023-05-20T13:10:13.778014</dc:date>
    <dc:format>image/svg+xml</dc:format>
    <dc:creator>
     <cc:Agent>
      <dc:title>Matplotlib v3.7.1, https://matplotlib.org/</dc:title>
     </cc:Agent>
        ........
小结
- 在Jupyter Notebook中,建议使用方法2,因为它可以直接在Notebook中显示高质量的SVG图形。