文章目录
- brief
- 数据准备
- pheatmap实例
- 最朴素的方式
- 数据缩放
- 取消聚类
- 更改每个小方格的大小
- 聚类以及聚类方式和参数
- 修改热图呈现的颜色
- 修改legend
- ggplot2实例
- ggplot2实例变式
- 添加 group bar
- 做成dotplot
- pheatmap 多图组合问题
brief
这里主要记录了pheatmap 以及 ggplot2实现热图的步骤:

数据准备
df_ <- df2[1:50,2:13]
df_ <- apply(df_,MARGIN = 2,FUN = as.numeric)
df_

pheatmap::pheatmap(df_)

pheatmap实例
最朴素的方式
pheatmap::pheatmap(df_)
数据缩放
pheatmap::pheatmap(df_,scale = "column") # scale = "column" / "raw" / "none" 按照行/列进行数据的缩放
取消聚类
pheatmap::pheatmap(df_,cluster_rows = F,cluster_cols = F)
更改每个小方格的大小
pheatmap::pheatmap(df_,cluster_rows = F,cluster_cols = F,cellwidth = 20,cellheight = 20)
聚类以及聚类方式和参数
pheatmap::pheatmap(df_,cluster_rows = T,clustering_distance_rows = "correlation",
                   cluster_cols = T,clustering_distance_cols = "manhattan"
                   ,clustering_method = "median")
# clustering method has to one form the list: 'ward', 'ward.D', 'ward.D2', 'single',
 'complete', 'average', 'mcquitty', 'median' or 'centroid'.
# 也就是层次聚类中计算距离的方法
修改热图呈现的颜色
pheatmap::pheatmap(df_,color = c('#6699CC','#FFFF99','#CC3333'))
修改legend
pheatmap::pheatmap(df_,legend = T,legend_breaks = c(-3,0,3))  # 自己指定legend在什么位置标数字
pheatmap::pheatmap(df_,legend = T,legend_labels = c("h","m","l")) # 自己指定legend标记的字符
# 当然了还有很多参数,用的时候再看吧
pheatmap::pheatmap(df_,show_colnames = T,show_rownames = T)
ggplot2实例
哪ggplot2可以实现热图嘛?
# 先把长格式数据转变为宽格式数据
df_ <- reshape2::melt(df_)
df_

p1<-ggplot(df_,aes(x=Var2,y=Var1,fill=value))+
  xlab("")+
  ylab("")
p1

p2 <- p1+geom_raster()+
  scale_fill_gradient2(low="#003366", high="#990033", mid="white")+
  theme_minimal()
p2

# geom_raster() geom_rect() and geom_tile() do the same thing ,都是画小方块的,参数不同
# Scales control the details of how data values are translated to visual properties
# scale_*_gradient creates a two colour gradient (low-high),
# scale_*_gradient2 creates a diverging colour gradient (low-mid-high),
#  scale_*_gradientn creates a n-colour gradient

ggplot2实例变式
添加 group bar
df_ <- df2[1:50,2:13]
df_ <- as.data.frame(apply(df_,MARGIN = 2,FUN = as.numeric))
df_

group <- colnames(df_) %>% as.data.frame() %>%
  mutate(group=c(rep("ST",3),rep("TZ",3),rep("TL",3),rep("TS",3))) %>%
  mutate(p="group") %>%
  ggplot(aes(.,y=p,fill=group))+
  geom_tile() +
  scale_y_discrete(position="right") +
  theme_minimal()+xlab(NULL) + ylab(NULL) +
  theme(axis.text.x = element_blank())+
  labs(fill = "Group")


#画热图并将以上信息添加进去:
# 先把长格式数据转变为宽格式数据
df_ <- df2[1:50,2:13]
df_ <- apply(df_,MARGIN = 2,FUN = as.numeric)
df_ <- reshape2::melt(df_)
df_

p1<-ggplot(df_,aes(x=Var2,y=Var1,fill=value)) #热图绘制
p2 <- p1+geom_raster()+scale_fill_gradient2(low="#003366", high="#990033", mid="white")+
  geom_tile()+theme_minimal()+
  theme(axis.text.x =element_text(angle =90,hjust =0.5,vjust = 0.5))+
  xlab(NULL) + ylab(NULL)
p2 %>%
  aplot::insert_top(group, height = .05)

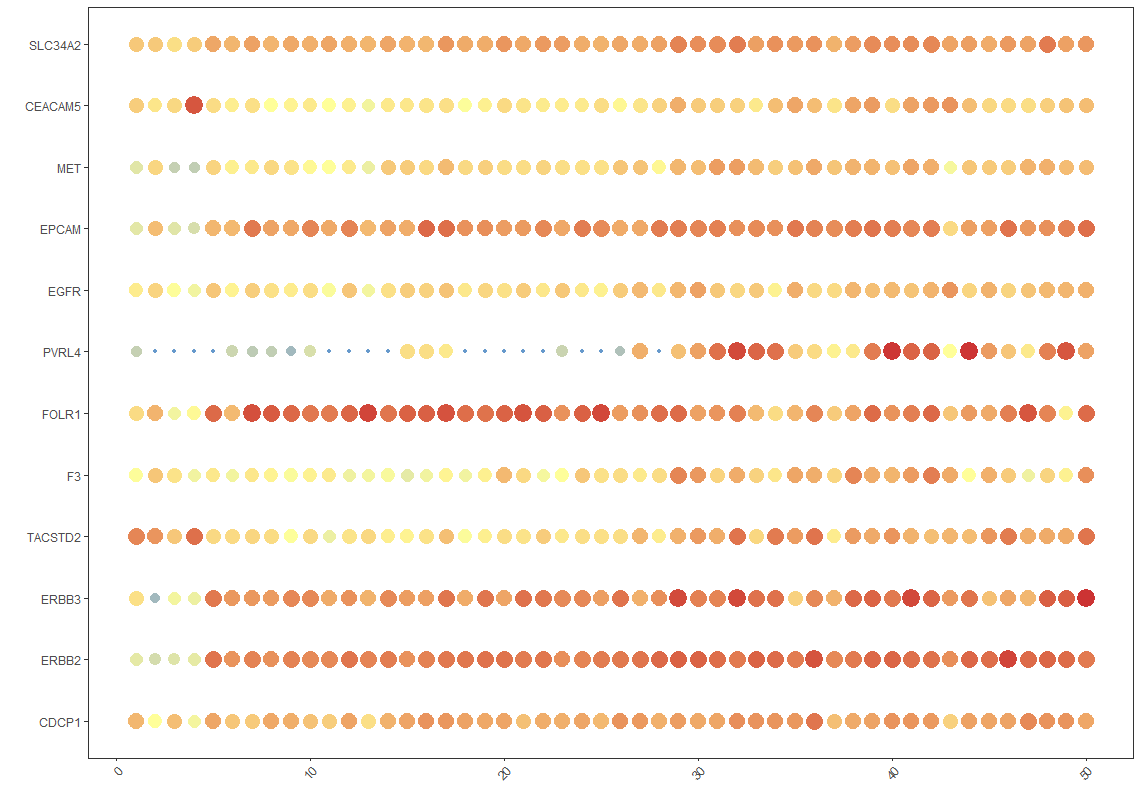
做成dotplot
p1<-ggplot(df_,aes(x=Var1,y=Var2,fill=value))+
  xlab("")+
  ylab("")

p3 <- p1+scale_color_gradientn(values = seq(0,1,0.2),colours = c('#6699CC','#FFFF99','#CC3333'))+
  theme_bw()+
  geom_point(aes(size=value,color=value))+
  guides(fill="none",color="none",size="none")+
  theme(panel.grid = element_blank(),
        axis.text.x =element_text(angle =45,hjust =1))
p3

pheatmap 多图组合问题
这部分内容来自:https://www.jianshu.com/p/8fc823c39488
在进行多图绘制的时候,用cowplot::plot_grid函数进行多图组合,结果在多图组合的时候,别的ggplot画图的对象没有任何问题,但是pheatmap的出现问题,并抛出如下警告信息:
p4<-cowplot::plot_grid(p1, p2, p3, ncol=1, labels=LETTERS[1:3])
Warning message:
In as_grob.default(plot) :
  Cannot convert object of class pheatmap into a grob.
cowplot::plot_grid多图组合的话,必须得是ggplot对象,而pheatmap不是ggplot对象,因此才会出现此问题。解决办法如下:
library(pheatmap)
test <- matrix(rnorm(200), 20, 10)
mfs <- mfs_ma <- mfs_fe <- pheatmap(test)
cowplot::plot_grid(mfs$gtable, mfs_ma$gtable, mfs_fe$gtable,
                   ncol= 3, labels=LETTERS[1:3])


