这里提供两种实现方式,一直自绘的自定义控件,一直三方SDK(qcustomplot)。
这里主要介绍自绘的,它的优点是结构简单,代码逻辑好修改,容易定制,缺点是功能相对单一。三方的qcustomplot优点是功能丰富,性能突出。缺点是代码结构复杂,难以根据实际需求快速定制。
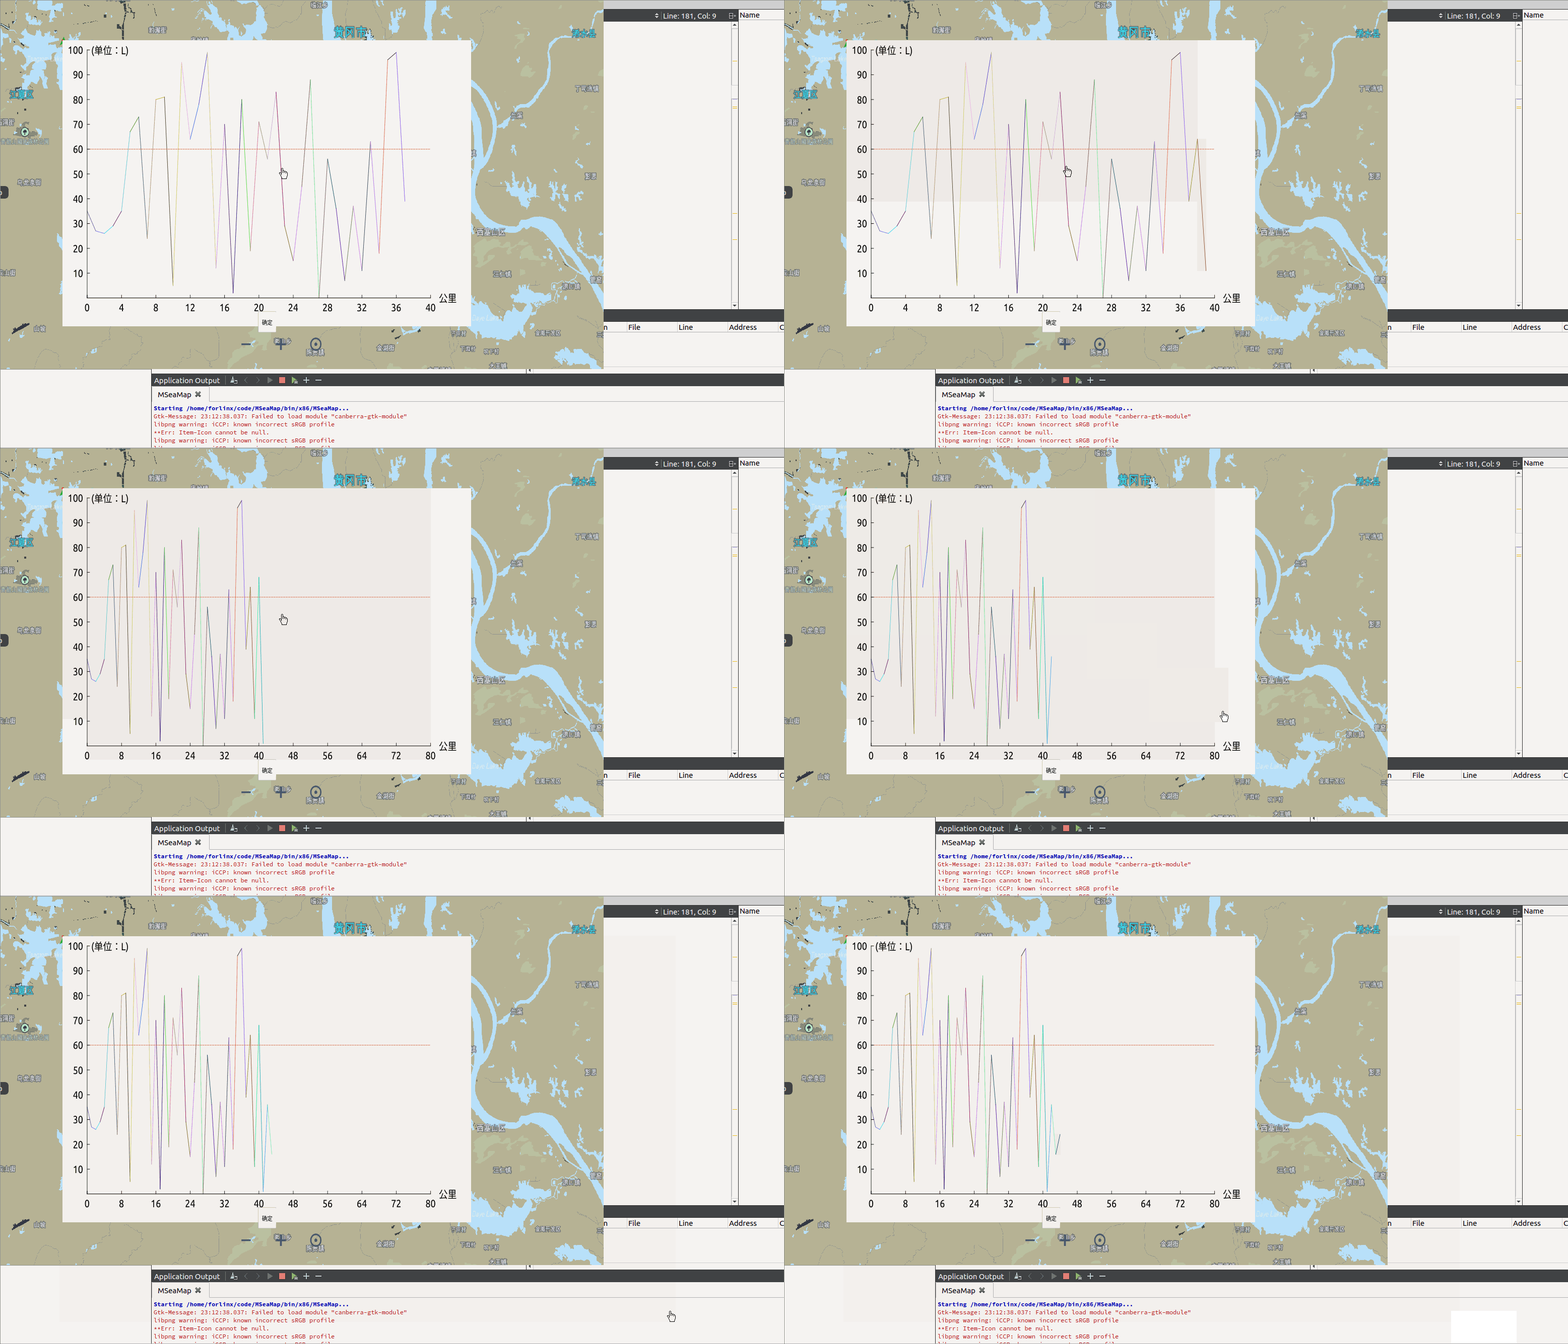
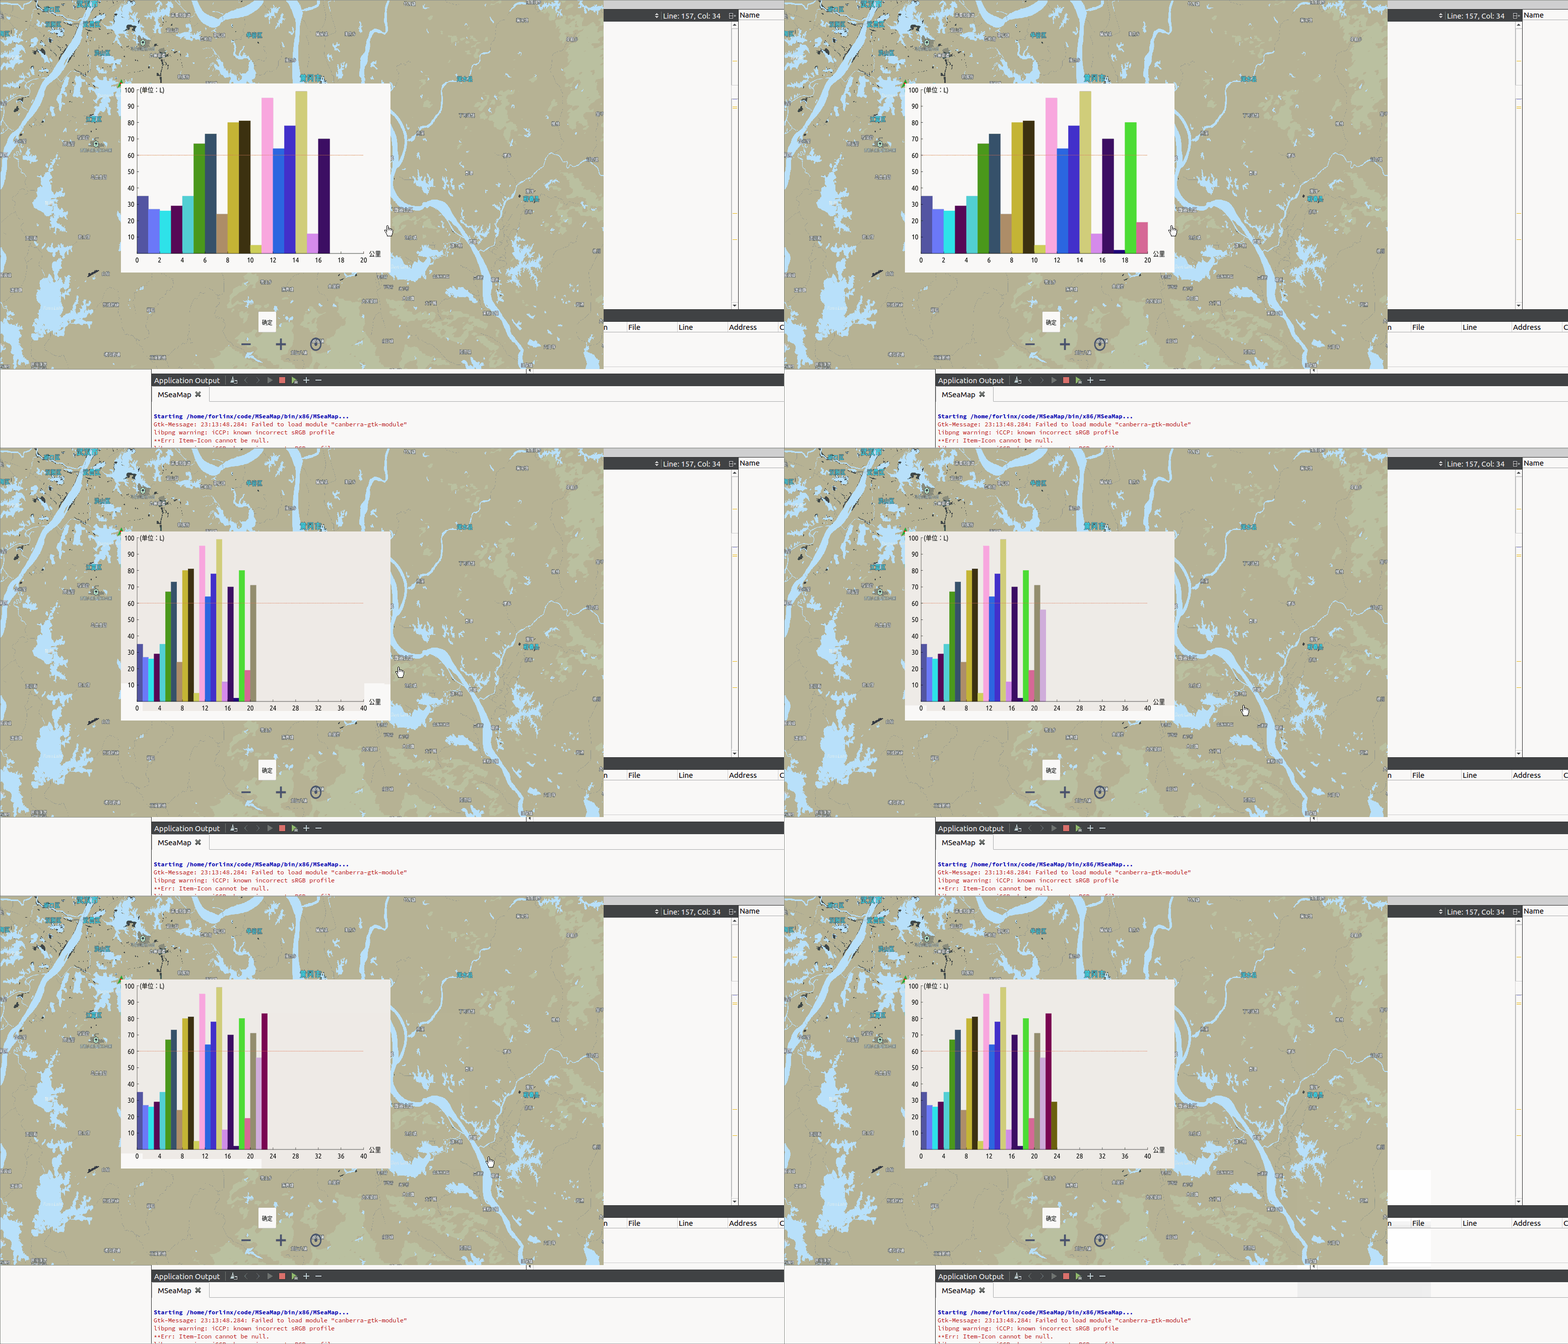
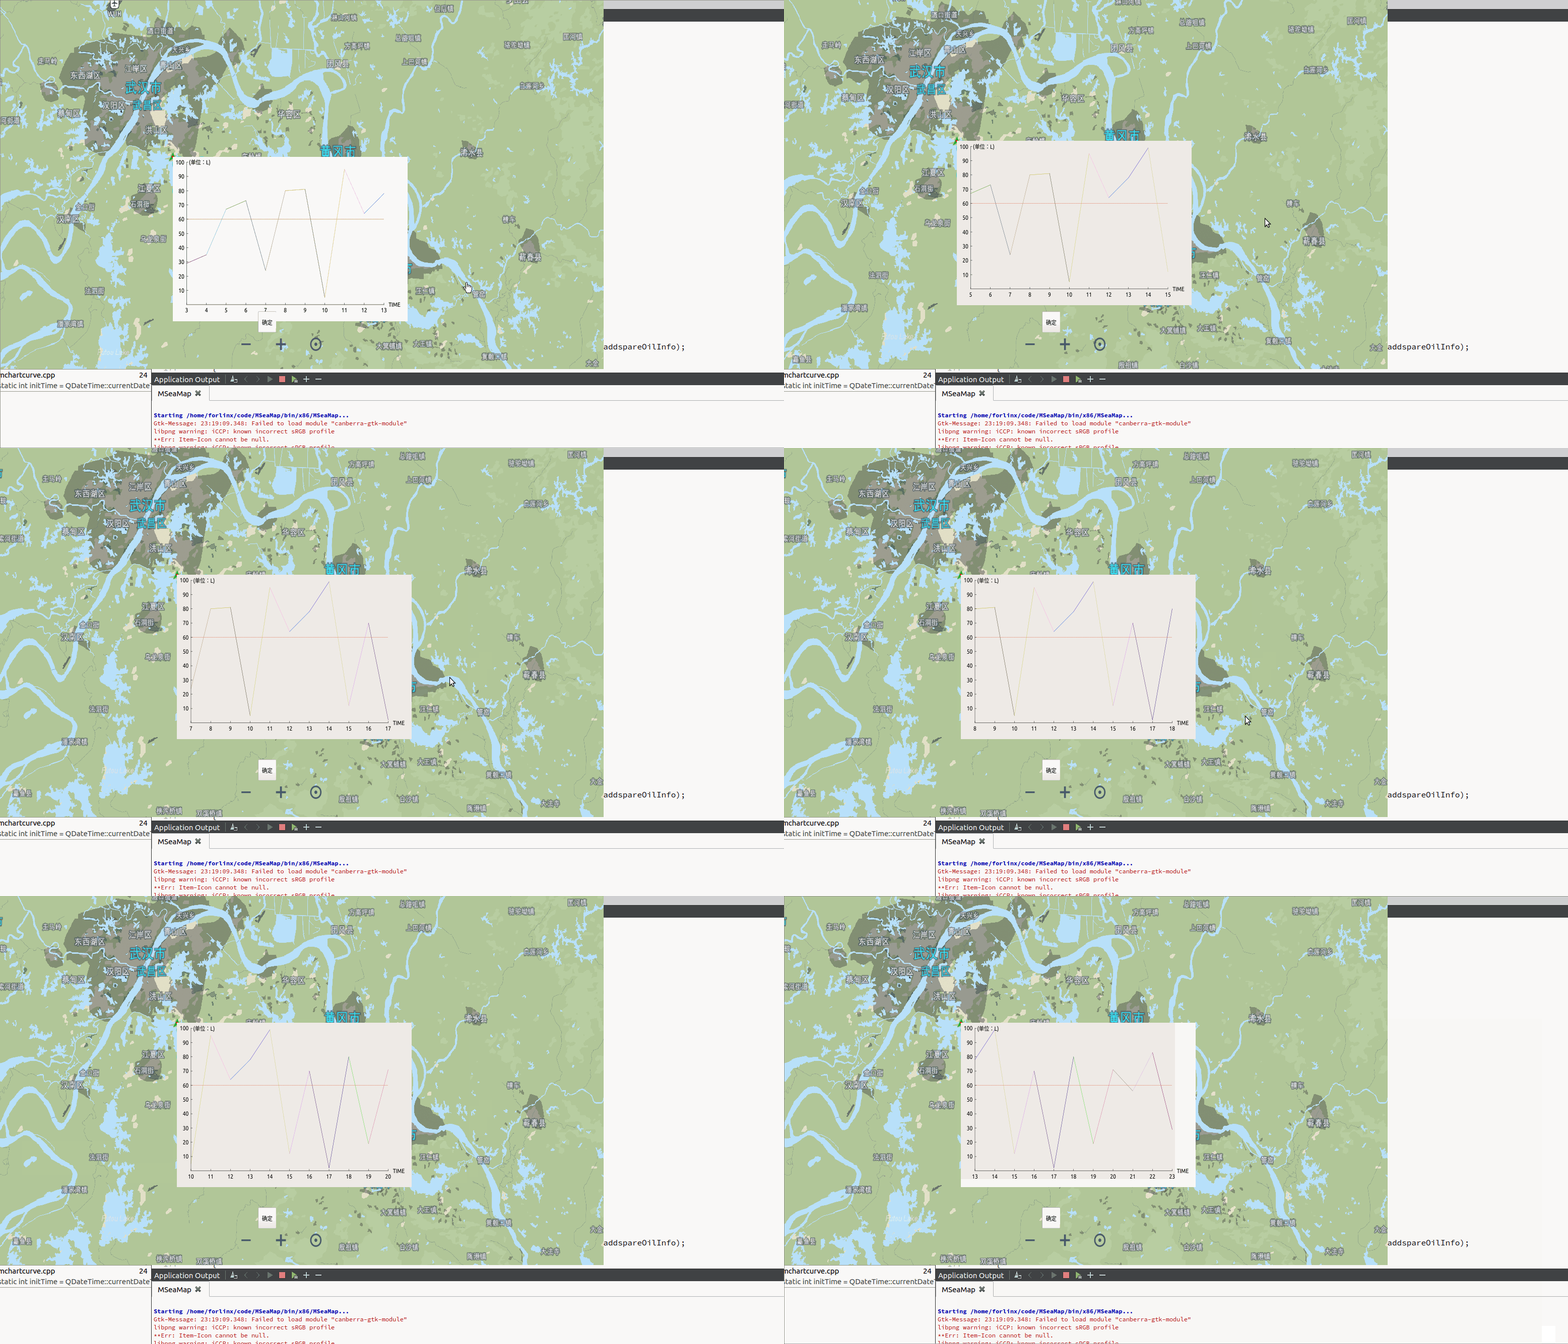
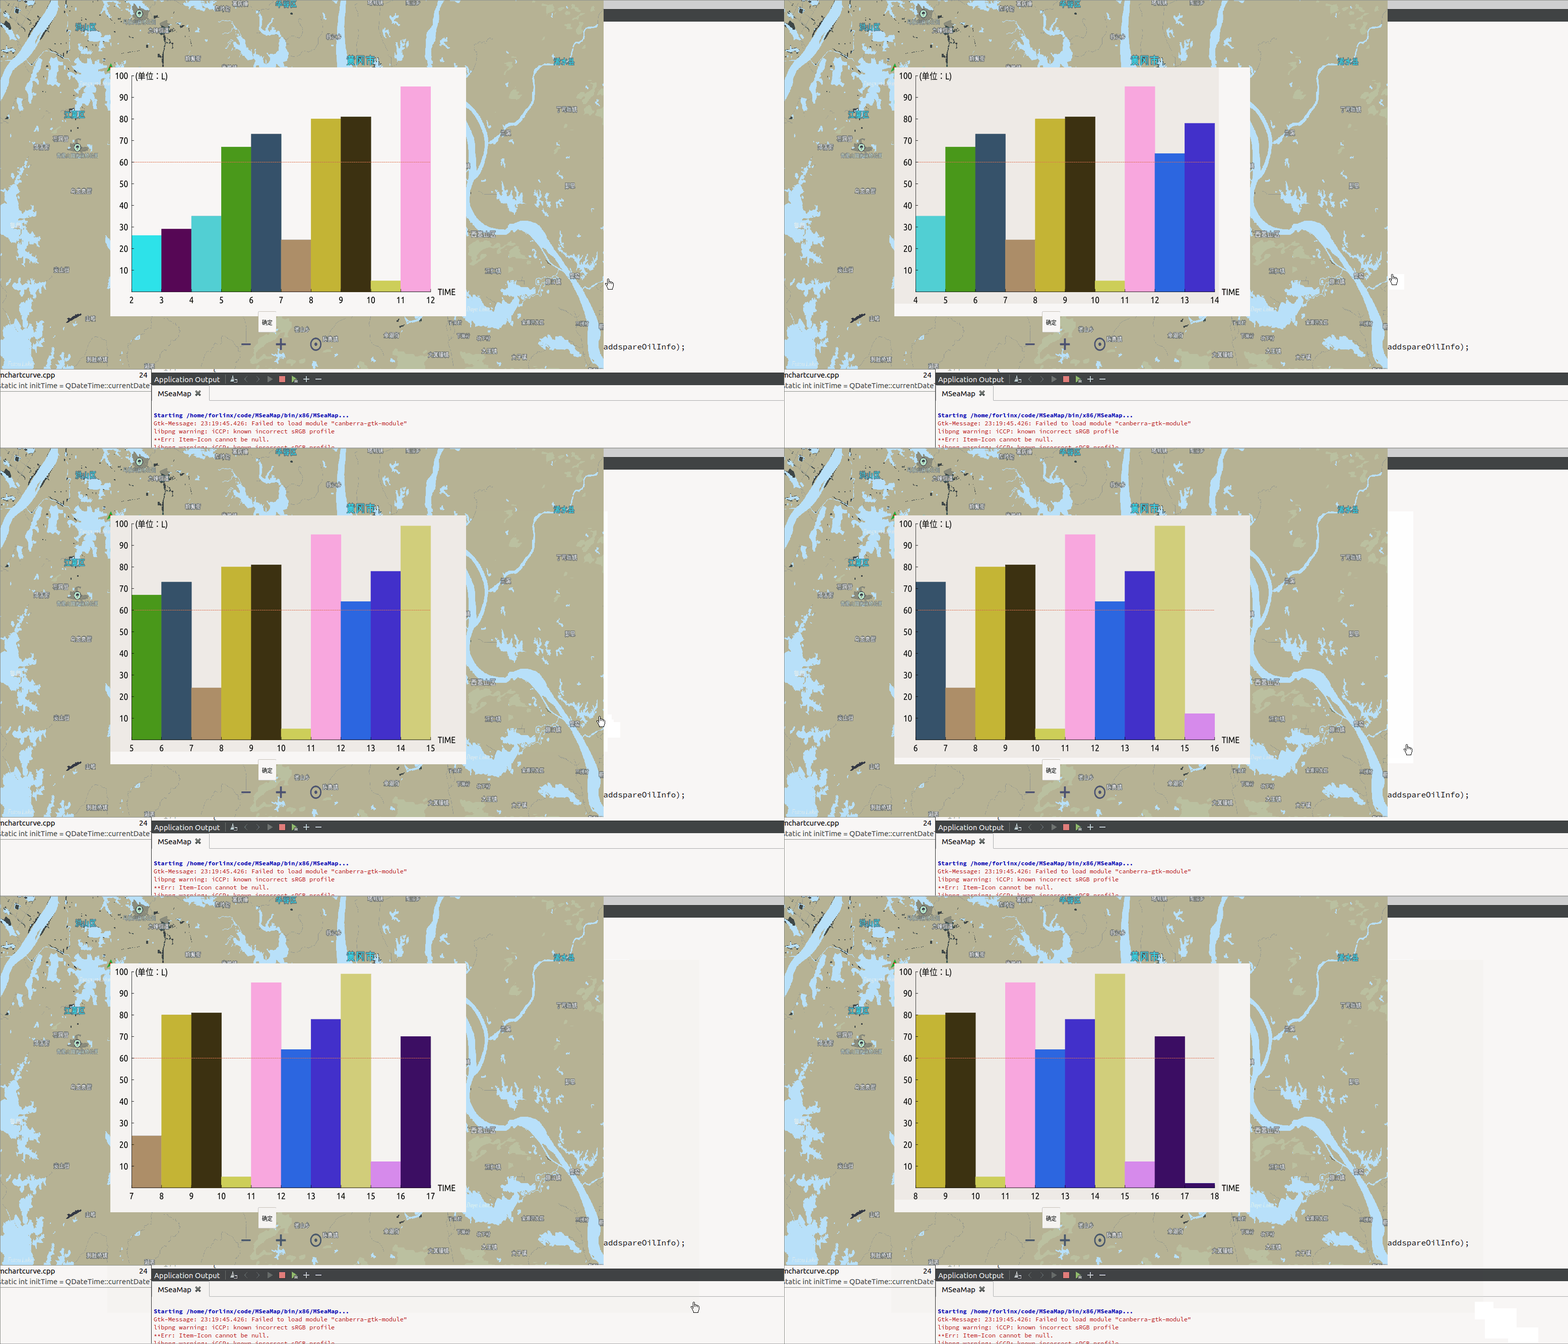
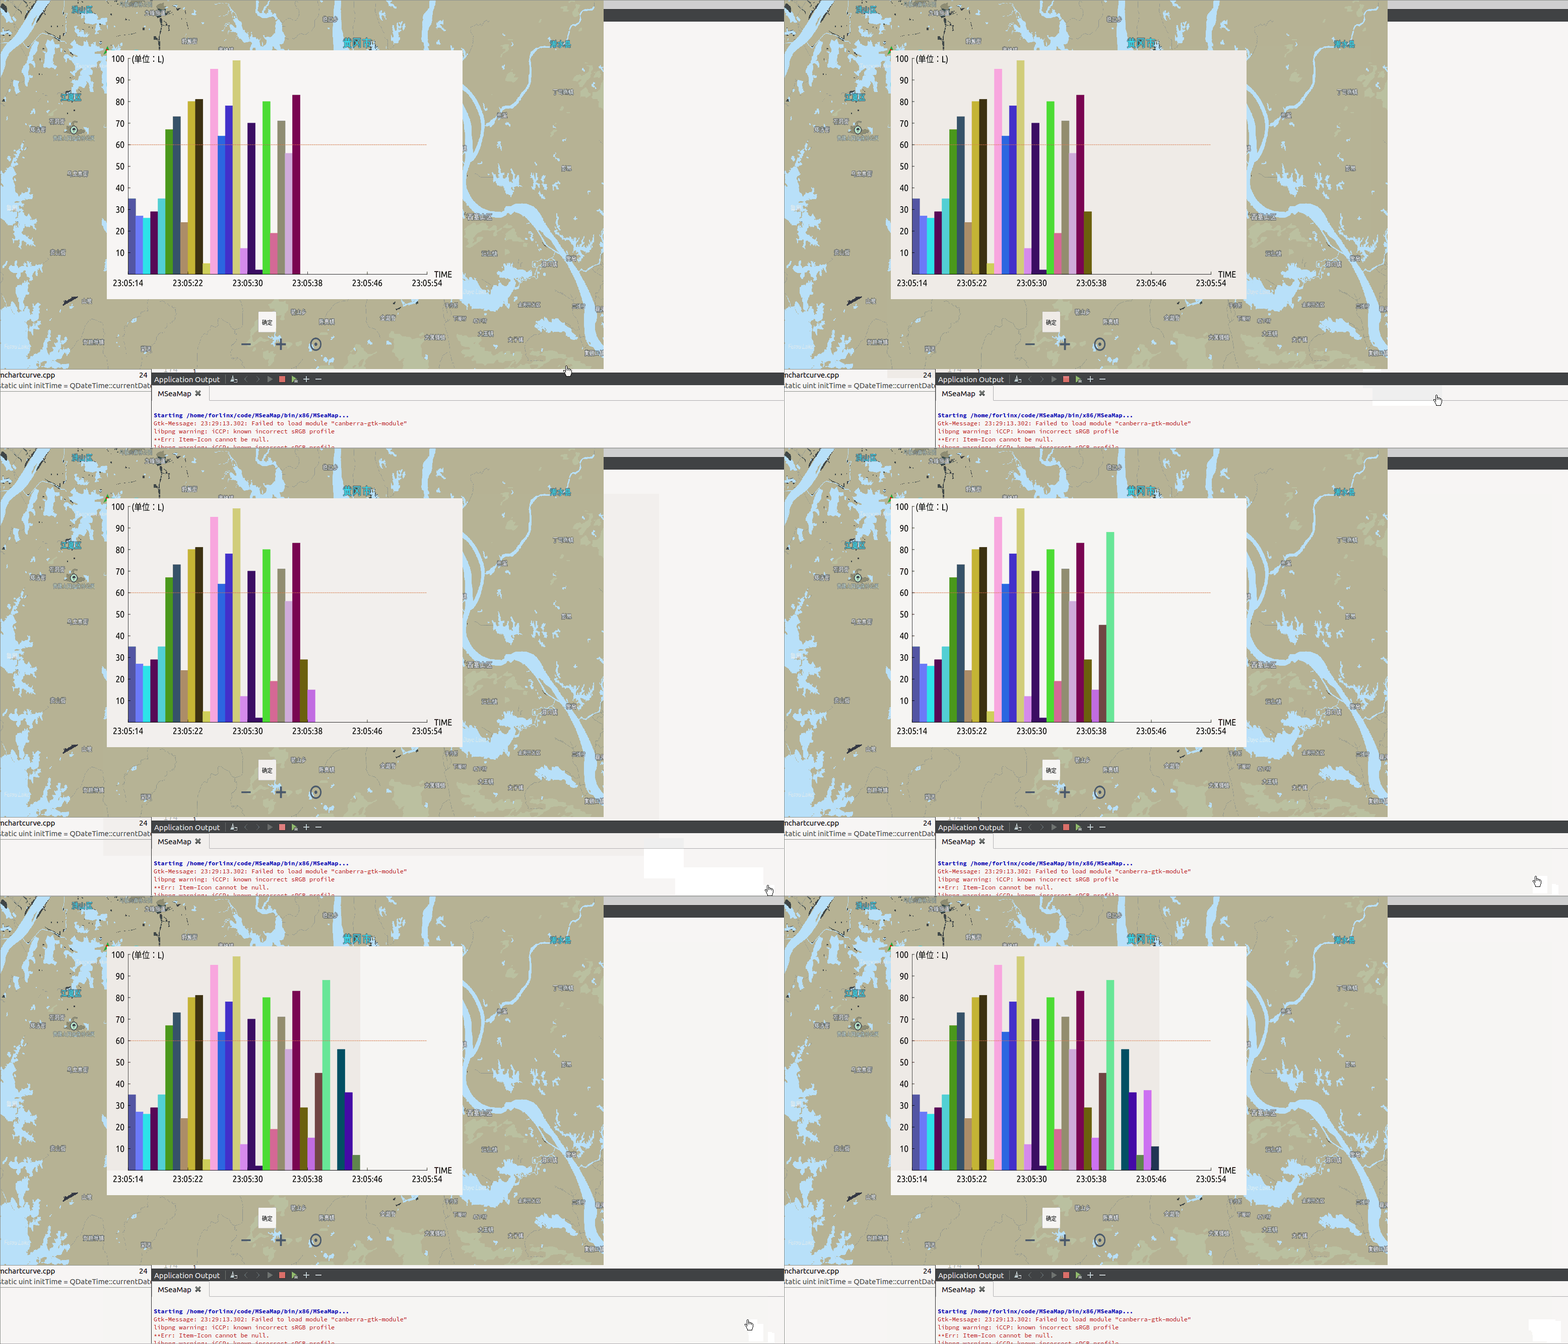
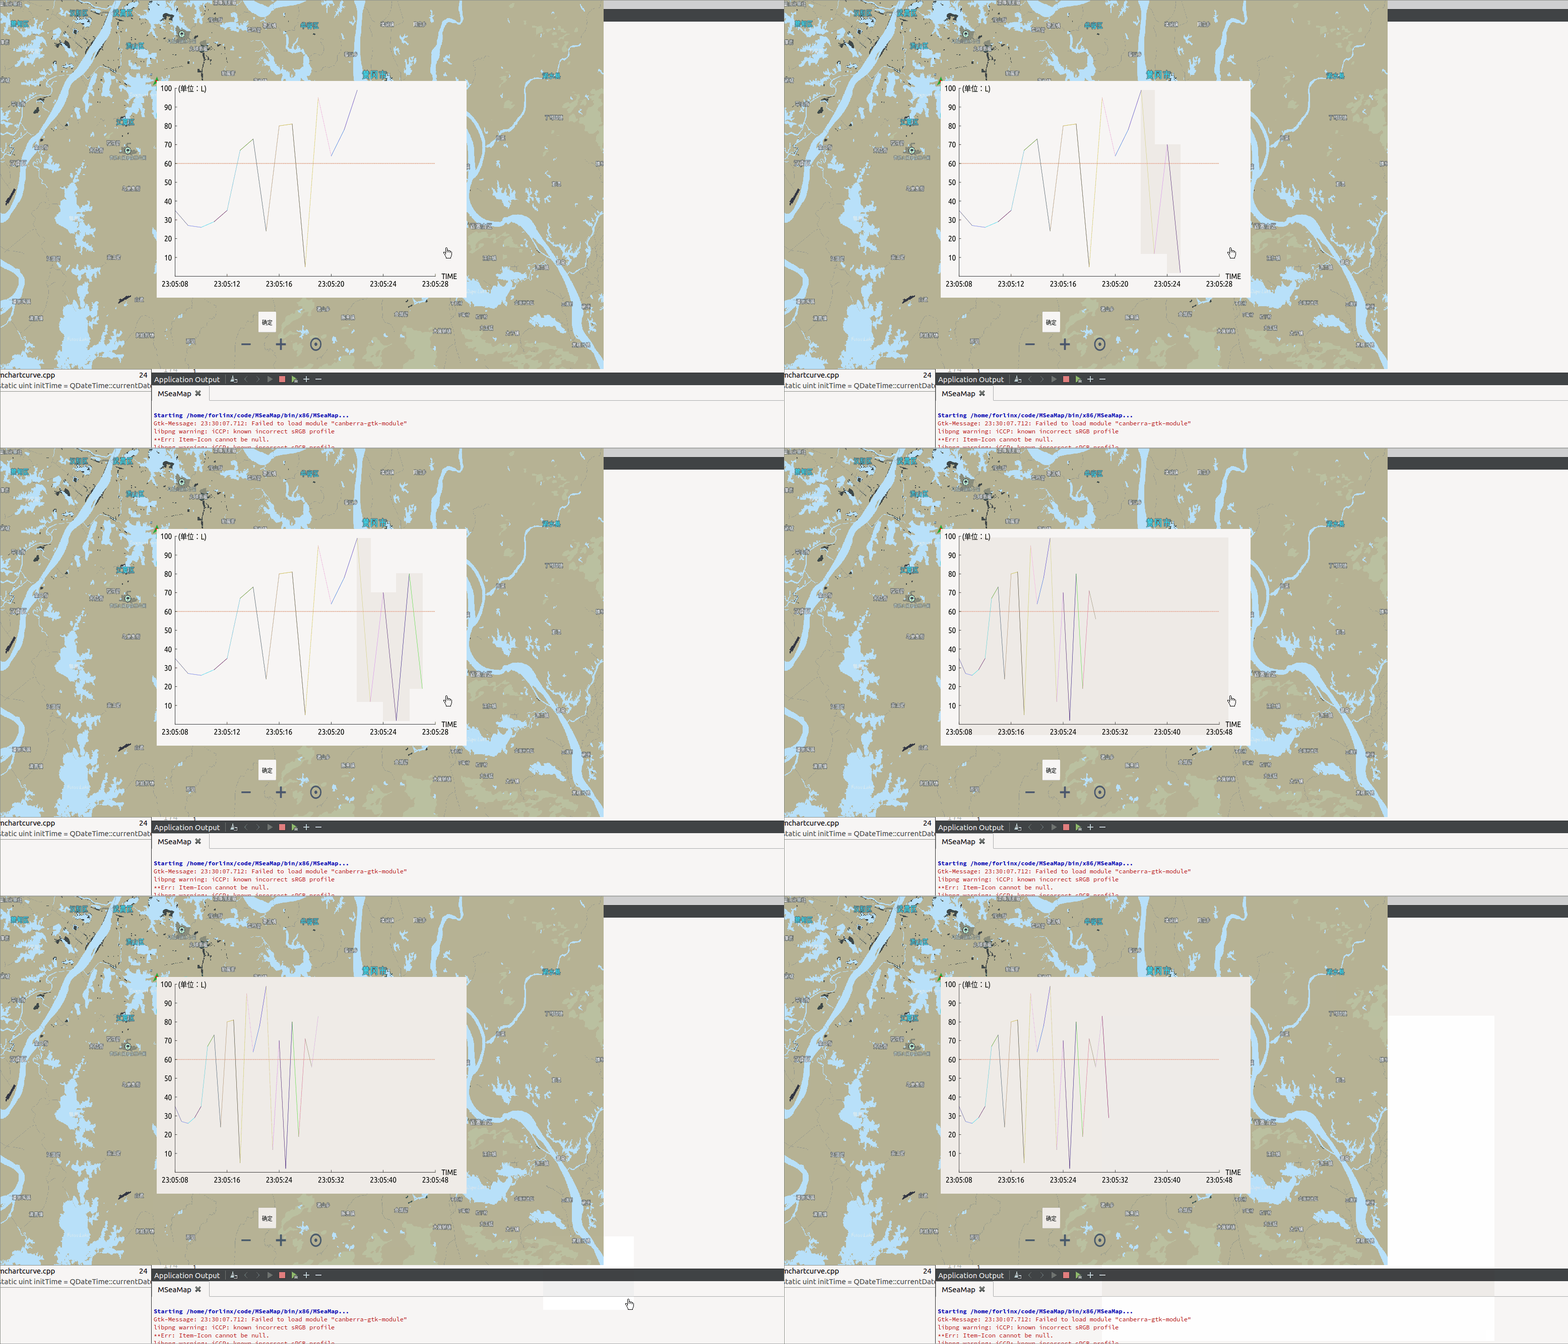
方法一:
接口介绍:
//传入数据,根据实际情况添加。
struct ChartPointInfo
{
ChartPointInfo();
ChartPointInfo(double toilConspn,QColor tcolor,double tline_Wide = 1,quint64 txAxis = 0) {
oilConspn = toilConspn;color = tcolor;line_Wide = tline_Wide;xAxis = txAxis;
}
quint64 xAxis;
QColor color;
double line_Wide = 0;
};void addPointInfo(ChartPointInfo ptinfo); //单个数据增加。 void setData(QList<ChartPointInfo> &datas); //批量数据整体赋值。 void setxAxisUnit(QString val); //设置x轴名称 void setyAxisUnit(QString val); //设置y轴名称 void setShowType(int num){m_showType = num;} //设置显示类型。0:显示规定长度的数据;1:显示所有数据。 void setChartType(int num){m_chartType = num;}//设置表的类型。0:柱状图;1:折线图。 void setChartModel(int num){m_chartModel = num;}//设置x轴单位模式。0:数值;1:时间。 void setxAxisRange(int min,int max){m_xAxisMin = min;m_xAxisMax = max;}//设置x轴范围 void setyAxisRange(int min,int max){m_yAxisMinVal = min;m_yAxisMaxVal = max;}//设置y轴范围
调用接口:
        MChartCurve* curveChart = new MChartCurve();
        curveChart->setFixedSize(500,300);
        curveChart->setxAxisUnit("TIME");
        curveChart->setyAxisUnit("(单位:L)");
        curveChart->setShowType(1);
        curveChart->setChartType(0);
        curveChart->setChartModel(0);
实现代码:
.h
#ifndef MCHARTCURVE_H
#define MCHARTCURVE_H

#include <QWidget>
#include <QPainter>

struct ChartPointInfo
{
    ChartPointInfo();
    ChartPointInfo(double toilConspn,QColor tcolor,double tline_Wide = 1,quint64 txAxis = 0)
    {
        oilConspn = toilConspn;color = tcolor;line_Wide = tline_Wide;xAxis = txAxis;
    }

    double oilConspn = 0.0;
    quint64 xAxis;
    QColor color;
    double line_Wide = 0;
};

class MChartCurve : public QWidget
{
    Q_OBJECT
public:
    MChartCurve(QWidget* parent = nullptr);
    ~MChartCurve();
    void addPointInfo(ChartPointInfo ptinfo);
    void setData(QList<ChartPointInfo> &datas);

    void setxAxisUnit(QString val);
    void setyAxisUnit(QString val);
    void setShowType(int num){m_showType = num;}
    void setChartType(int num){m_chartType = num;}
    void setChartModel(int num){m_chartModel = num;}
    void setxAxisRange(int min,int max){m_xAxisMin = min;m_xAxisMax = max;}
    void setyAxisRange(int min,int max){m_yAxisMinVal = min;m_yAxisMaxVal = max;}
protected:
    void paintEvent(QPaintEvent *event);
    void timerEvent(QTimerEvent *event);
private:
    QList<ChartPointInfo> m_chartPtInfos;
    double m_yAxisSize = 10;
    double m_yAxisMaxVal = 100;
    double m_yAxisMinVal = 0;
    double m_xAxisSize = 5;
    double m_xAxisMax = 10;
    double m_xAxisMin = 0;
    int m_showType = 1;
    int m_chartType = 0;
    int m_chartModel = 0;
    QString m_xAxisUnit;
    QString m_yAxisUnit;
    qint64 m_timeSpec = 0;

};

#endif // MCHARTCURVE_H
.cpp
#include "mchartcurve.h"
#include <QDateTime>
#include <QDebug>
#include <QApplication>

MChartCurve::MChartCurve(QWidget *parent) /*: QWidget(parent)*/
{
    //    this->setAttribute(Qt::WA_TranslucentBackground);
    startTimer(1000);
}

MChartCurve::~MChartCurve()
{

}

void MChartCurve::timerEvent(QTimerEvent *event)
{
    addPointInfo(ChartPointInfo(rand()%(int)m_yAxisMaxVal,QColor(rand()%255,rand()%255,rand()%255),0.5));
}

void MChartCurve::addPointInfo(ChartPointInfo ptinfo)
{
    static uint initTime = QDateTime::currentDateTime().toTime_t();

    //模拟数据
    ptinfo.xAxis = QDateTime::currentDateTime().toTime_t() - initTime;

    m_timeSpec = initTime;
    m_chartPtInfos.append(ptinfo);

    if (m_showType == 0)
    {
        if (m_chartPtInfos.size() > m_xAxisMax-m_xAxisMin + 1)
        {
            m_chartPtInfos.removeFirst();
            m_xAxisMin++;
            m_xAxisMax++;
        }
    }
    else
    {
        if (m_xAxisMax < ptinfo.xAxis)
            m_xAxisMax = m_xAxisMax*2;
    }
    update();
}

void MChartCurve::setData(QList<ChartPointInfo>& datas)
{
    m_chartPtInfos = datas;
    if (m_showType == 0)
    {
        if (m_chartPtInfos.size() > m_xAxisMax-m_xAxisMin + 1)
        {
            m_chartPtInfos.removeFirst();
            m_xAxisMin++;
            m_xAxisMax++;
        }
    }
    else
    {
        if (m_xAxisMax < datas.last().xAxis)
            m_xAxisMax = m_xAxisMax*2;
    }
    update();
}

void MChartCurve::paintEvent(QPaintEvent *event)
{
    QPainter p(this);
    p.setRenderHint(QPainter::Antialiasing);
    QPen pen;
    QFont font;

    double xstartPos = 30;                 //x轴全局坐标起始点
    double ystartPos = 10;                 //y轴全局坐标起始点
    double xWidth = width() - 80;
    double yHeight = height() - 40;
    double yAxisSize = m_yAxisSize;        //x轴刻度数
    double yAxisMaxVal = m_yAxisMaxVal;
    double xAxisSize = m_xAxisSize;        //y轴刻度数
    double xAxisMax = m_xAxisMax;
    double xAxisMin = m_xAxisMin;

    //chart
    double xAxisTextLen = xWidth/(xAxisMax - xAxisMin);
    double yAxisTextLen = yHeight/yAxisMaxVal;
    for (int i = 0; i < m_chartPtInfos.size() - 1; i++)
    {
        ChartPointInfo startinfo = m_chartPtInfos[i];
        ChartPointInfo endinfo = m_chartPtInfos[i+1];
        pen.setWidthF(startinfo.line_Wide);
        pen.setColor(startinfo.color);
        p.setPen(pen);
        p.setBrush(QBrush(startinfo.color));

        if (m_chartType == 1)
            p.drawRect(QRectF(xstartPos + (startinfo.xAxis-xAxisMin)*xAxisTextLen,ystartPos + (yAxisMaxVal-startinfo.oilConspn)*yAxisTextLen,
                              qAbs(endinfo.xAxis - startinfo.xAxis)*xAxisTextLen,10 + yHeight - (ystartPos + (yAxisMaxVal-startinfo.oilConspn)*yAxisTextLen)));
        else
            p.drawLine(QPointF(xstartPos + (startinfo.xAxis-xAxisMin)*xAxisTextLen,ystartPos + (yAxisMaxVal-startinfo.oilConspn)*yAxisTextLen)
                       ,QPointF(xstartPos + (endinfo.xAxis-xAxisMin)*xAxisTextLen,ystartPos + (yAxisMaxVal-endinfo.oilConspn)*yAxisTextLen));

    }

    //base line
    double oilprec = 0.6;
    double baseyPos = yAxisMaxVal * (1 - oilprec) * yAxisTextLen;
    pen.setStyle(Qt::DashLine);
    pen.setColor(QColor("#df7050"));
    p.setPen(pen);
    p.drawLine(QPoint(xstartPos,10 + baseyPos),QPoint(xstartPos + xWidth,10 + baseyPos));

    pen.setStyle(Qt::SolidLine);
    pen.setColor(QColor("#000000"));
    p.setPen(pen);
    font.setPointSize(8);
    p.setFont(font);

    //xAxis
    p.drawLine(QPoint(xstartPos,ystartPos + yHeight),QPoint(xstartPos + xWidth,ystartPos + yHeight));
    //xAxis Unit
    p.drawText(xstartPos + xWidth + 10,yHeight,50,20,Qt::AlignLeft|Qt::AlignVCenter,m_xAxisUnit);
    //xAxis text
    for (int i = 0; i < xAxisSize + 1; i++)
    {
        p.drawLine(xstartPos+(xWidth/xAxisSize)*i,yHeight+10,xstartPos+(xWidth/xAxisSize)*i,yHeight+7);
        if (m_chartModel == 1)
        {
            int timespec = m_timeSpec + xAxisMin+(xAxisMax-xAxisMin)/xAxisSize*i;
            p.drawText(xstartPos+(xWidth/xAxisSize)*i-25,yHeight+10,50,20,Qt::AlignCenter,QDateTime::fromTime_t(timespec).toString("hh:MM:ss"));
        }
        else
            p.drawText(xstartPos+(xWidth/xAxisSize)*i-20,yHeight+10,40,20,Qt::AlignCenter,QString::number(xAxisMin+(xAxisMax-xAxisMin)/xAxisSize*i,'f',0));
    }

    //yAxis
    p.drawLine(QPoint(xstartPos,10),QPoint(xstartPos,ystartPos + yHeight));
    //yAxis Unit
    p.drawText(xstartPos + 5,0,60,20,Qt::AlignLeft|Qt::AlignVCenter,m_yAxisUnit);
    //yAxis text
    for (int i = 0; i < yAxisSize; i++)
    {
        p.drawLine(xstartPos,ystartPos+(yHeight/yAxisSize)*i,xstartPos + 3,ystartPos+(yHeight/yAxisSize)*i);
        p.drawText(0,ystartPos+(yHeight/yAxisSize)*i-10,xstartPos - 5,20,Qt::AlignRight|Qt::AlignVCenter,QString::number(yAxisMaxVal/yAxisSize*(yAxisSize-i)));
    }
}

void MChartCurve::setxAxisUnit(QString val)
{
    m_xAxisUnit = val;
}

void MChartCurve::setyAxisUnit(QString val)
{
    m_yAxisUnit = val;
}
方法二:使用qcustomplot实现
柱状图和折线图:
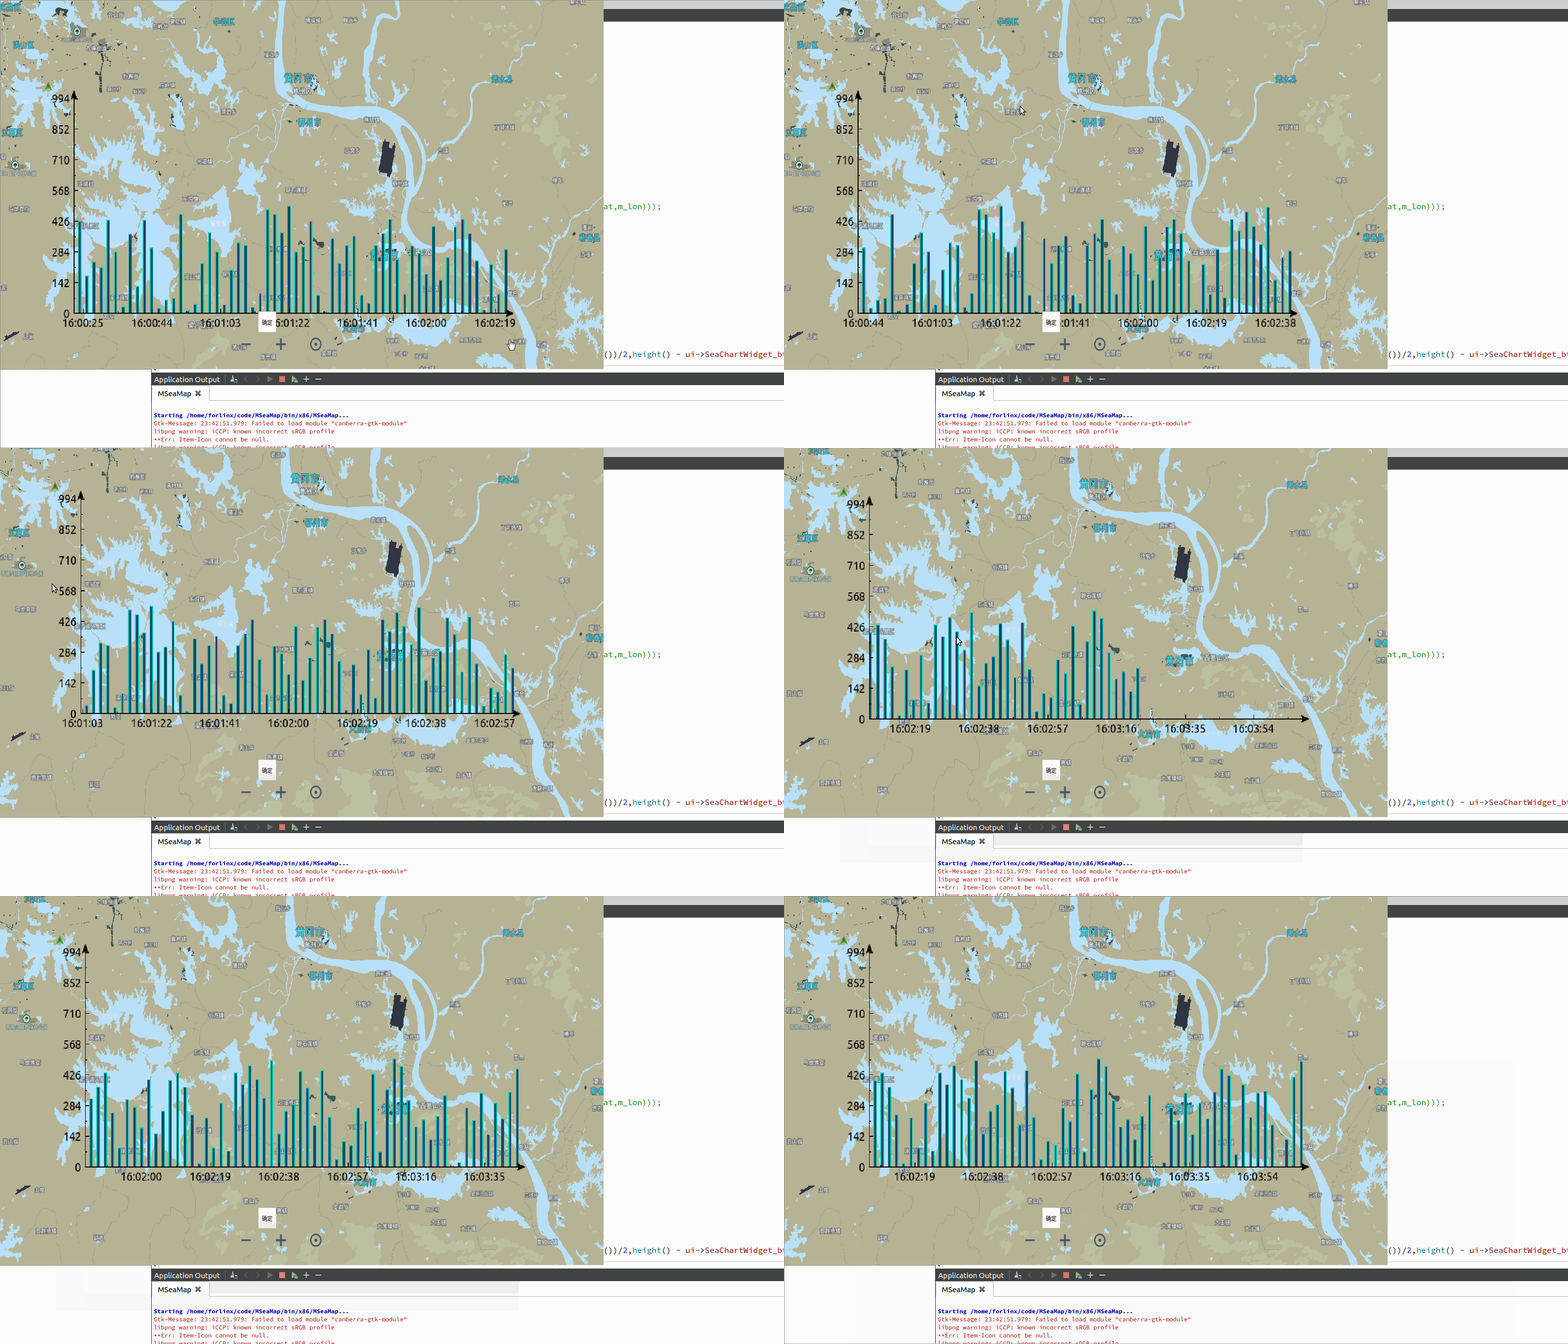
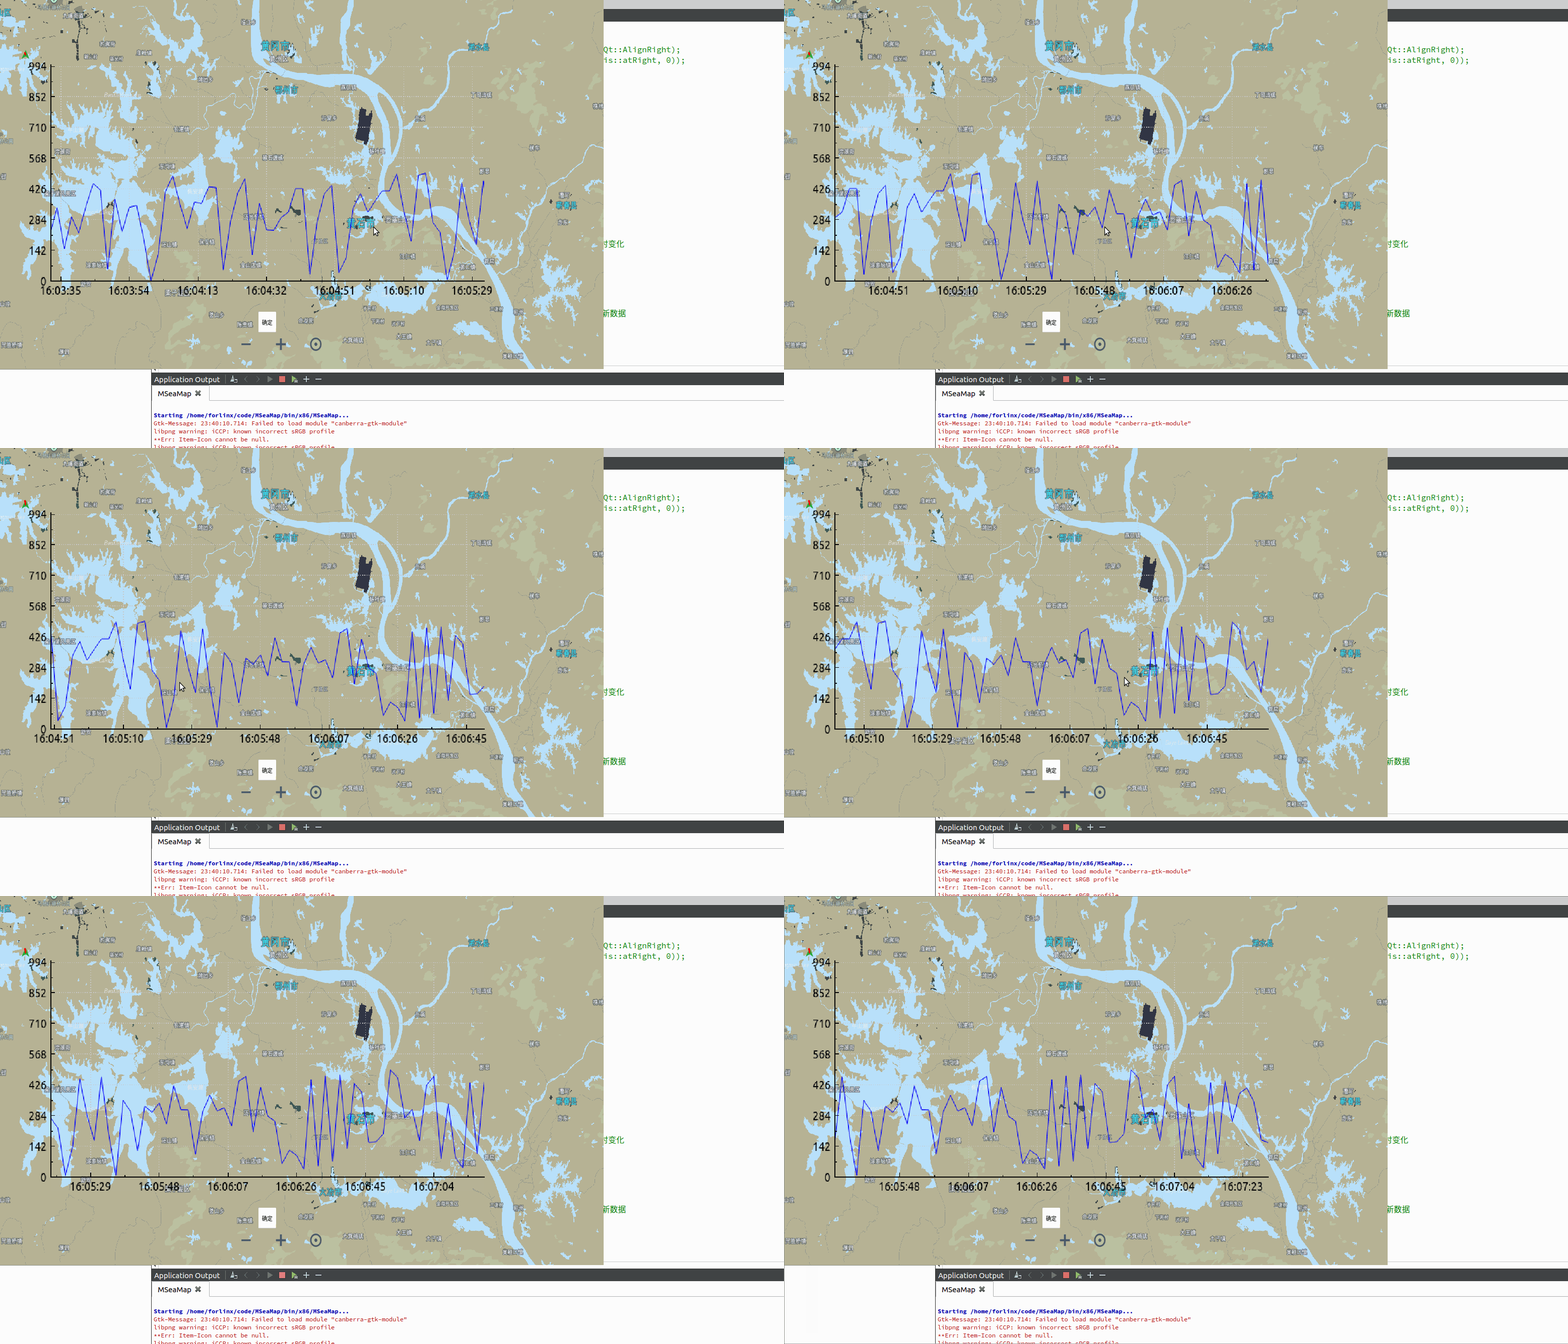
代码:
首先需要引入文件qcustomplot.h和qcustomplot.cpp
下载地址:https://download.csdn.net/download/weixin_43246170/87785302
.h
    QCustomPlot* m_cusPlot = nullptr;
    QCPBars *m_bars = nullptr;
    QVector<double> m_xList;
    QVector<double> m_yList;
.cpp
void SeaChartWidget::creatPlotChart()
{
    //qcomtomplot
    m_cusPlot = new QCustomPlot();
    m_cusPlot->setInteractions(QCP::iRangeDrag | QCP::iRangeZoom | QCP::iSelectAxes |
                               QCP::iSelectLegend | QCP::iSelectPlottables);
    m_cusPlot->axisRect()->setRangeDrag(Qt::Horizontal);
    m_cusPlot->setFixedSize(660,300);
    //背景透明
    m_cusPlot->setBackground(Qt::transparent);
    m_cusPlot->setStyleSheet("background:transparent");

    //        m_cusPlot->yAxis->setTickLabels(false); //关闭左侧y轴刻度值
    //        m_cusPlot->axisRect()->setupFullAxesBox(); //补全上下边框线

    //y
    m_cusPlot->xAxis->setRange(120, 120, Qt::AlignRight);
    m_cusPlot->yAxis->setRange(1000, 1000, Qt::AlignRight);
    m_cusPlot->yAxis->ticker()->setTickStepStrategy(QCPAxisTicker::TickStepStrategy::customTickCount);
    m_cusPlot->yAxis->ticker()->setTickCount(7);

    //x
    QSharedPointer<QCPAxisTickerDateTime> dateTick(new QCPAxisTickerDateTime);
    dateTick->setDateTimeFormat("hh:mm:ss");
    dateTick->setTickOrigin(6);    //设置第一个刻度值
    m_cusPlot->xAxis->setTicker(dateTick);
    m_cusPlot->xAxis->ticker()->setTickStepStrategy(QCPAxisTicker::TickStepStrategy::customTickCount);
    m_cusPlot->xAxis->ticker()->setTickCount(6);

#if 1 //柱状图
    m_bars = new QCPBars(m_cusPlot->xAxis, m_cusPlot->yAxis);  // 使用xAxis作为柱状图的x轴,yAxis作为y轴
    m_bars->setAntialiased(false); // 为了更好的边框效果,关闭抗齿锯
    m_bars->setPen(QPen(QColor(0, 160, 140).lighter(130))); // 设置柱状图的边框颜色
    m_bars->setBrush(QColor(20,68,106));  // 设置柱状图的画刷颜色

    //隐藏网格
    m_cusPlot->xAxis->grid()->setVisible(false);
    m_cusPlot->yAxis->grid()->setVisible(false);

    //坐标轴箭头
    m_cusPlot->xAxis->setUpperEnding(QCPLineEnding::esSpikeArrow);
    m_cusPlot->yAxis->setUpperEnding(QCPLineEnding::esSpikeArrow);
#endif

    //显示右侧y轴
    //        m_cusPlot->yAxis2->setVisible(true);
    //        m_cusPlot->axisRect()->axis(QCPAxis::atRight, 0)->setRange(1000, 1000, Qt::AlignRight);
    //        m_cusPlot->addGraph(m_cusPlot->xAxis, m_cusPlot->axisRect()->axis(QCPAxis::atRight, 0));
    m_cusPlot->addGraph(m_cusPlot->xAxis);

    m_cusPlot->graph(0)->setPen(QPen(Qt::blue));
    QGraphicsProxyWidget *w = m_mapView->scene()->addWidget(m_cusPlot);
    w->setPos(GraphicsMap::toScene(MyGeoCoordinate(m_lat,m_lon)));
}

void SeaChartWidget::updatePlotData()
{
    static double index = 0;
    index = index + 2;
    m_xList.append(index);
    m_yList.append(rand()%500);

#if 0 //折线图
    m_cusPlot->graph(0)->setData(m_xList, m_yList);//指定数据
    //        m_cusPlot->graph(0)->rescaleValueAxis(false,true);  //x,y刻度值根据数据实时变化
#else //柱状图
    m_bars->setData(m_xList, m_yList);
    //        m_bars->rescaleValueAxis(false,true);  //x,y刻度值根据数据实时变化
#endif
    //注意需要放在数据后面,否则会出现第一次设置未成功
    m_cusPlot->xAxis->rescale(true);   //true:从右侧开始绘制最新数据;false:从左侧开始绘制最新数据
    m_cusPlot->xAxis->setRange(m_cusPlot->xAxis->range().upper, 120, Qt::AlignRight);
    m_cusPlot->replot();
}
