学习Tidal forcing算例
- 简介
- 网格配置与地形
- 定解条件设置
- 初始条件设置
- 边界条件设置
- 开边界处的通量计算(OpenBoundaryFluxes)
- 开边处的速度、水位(BoundaryVelocities)
- 其它参数配置
- 模拟结果
简介
SUNTANS中 tidal forcing 算例的全称是 Example tidal forcing in Monterey Bay。该算例模拟了 Monterey Bay 地区在潮汐作用下的水流;但由于模型网格的水平分辨率较粗,该模型只能模拟正压流动,而无法模拟该区域的内波。通过该算例,我们可以学习SUNTANS模型中tide模块的应用及潮汐边界条件的设置。
该算例的网格和参数文件位于 /examples/tides,其中还包含一个简单的说明文件 README。
网格配置与地形
本例采用一个三维网格。从水平面上看,计算域如下图所示,其网格均为三角形。从垂向看,网格被分为了10层(suntans.dat: Nkmax=10, rstretch=1)。
注意,下图所示网格仅是输入时候的网格;在模型中,网格的 Voronoi 点需要被校正,之后才会进行模拟。当要对网格的 Voronoi 点进行校正时,suntans.dat 文件中的 CorrectVoronoi 要被设置成 -1,校正参数 VoronoiRatio 需要被指定。在本算例中, VoronoiRatio = 85,即对于任何最大角大于85°的三角形网格,其 Voronoi 点需要被校正。

注意,上图中不同颜色的计算域边界线表示了不同类型的边界。其中,紫红色线的编号为1(marker=1),表示陆地边界(闭边界);绿色线的编号为2(marker=2),表示受潮汐作用的开边界;
计算域的地形数据存储在 /examples/tides/rundata/mbay_bathy.dat 文件中。在运行SUNTANS时,该文件中的数据将被插值到每个网格的 Voronoi 点上。因为这个过程可能会花费相当长的时间,所以最好只在必要时运行它,并在之后的运行中使用预插值的水深测量(/examples/tides/rundata/mbay_bathy-voro)。
如果在模型运行过程中进行了地形数据插值,一个名为 mbay_bathy.dat-voro 将会被输出,并出现在结果文件夹 /examples/tides/data 中。是否进行地形插值计算可通过设置输入文件中 suntans.dat 来实现。当 suntans.dat 中的 IntDepth 被设置为1时,插值过程将会进行,即模型将在 rundata 文件夹中读取 mbay_bathy.dat 文件,并输出插值后的数据文件 mbay_bathy.dat-voro;若 IntDepth 被设置为2,模型则会直接读取 mbay_bathy.dat-voro 的数据,即不进行插值计算。由于自带算例文件中已经包含 mbay_bathy.dat-voro 文件,故本算例的 IntDepth 被设置为2。
请注意,若Voronoi点发生改变,地形数据都应该被重新插值。
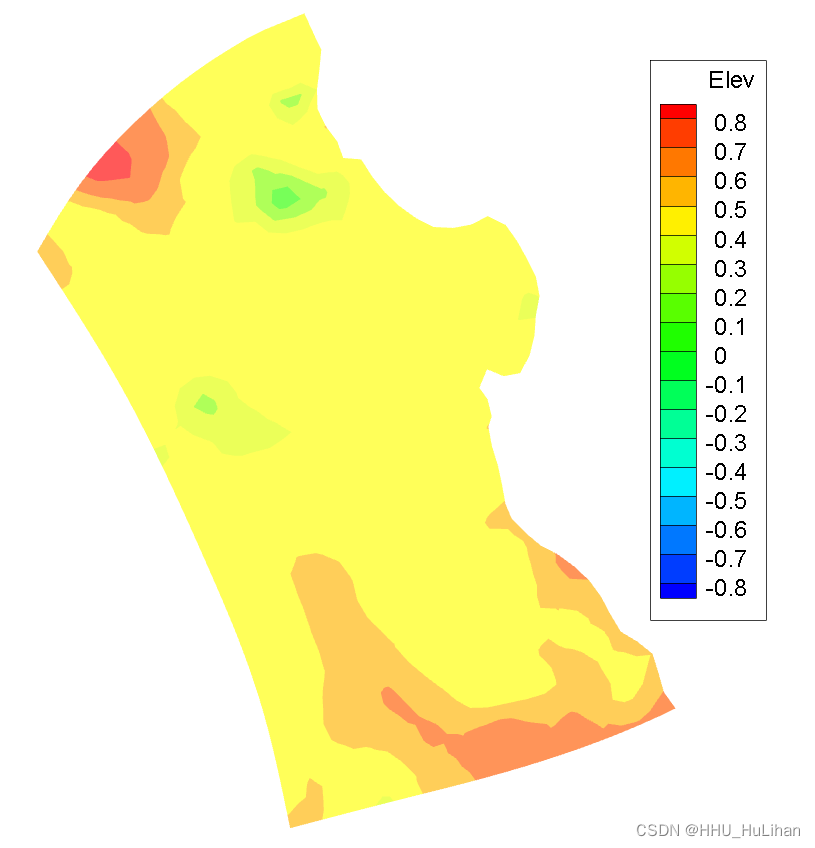
插值后的静水深如下图所示。

定解条件设置
初始条件设置
在本算例中,初始的水位和流速值需要设定。初始条件的相关设置参见 initialization.c 文件。
- 函数GetDZ:对本算例,此函数不重要,略作介绍
该函数用于确定垂向网格。对于本算例,rstretch=1,所以垂向网格通过水面、最深点和垂向最大网格数推算得出。 - 函数ReturnDepth:对本算例,此函数并没有被调用,因为仅当IntDepth=0时此函数才被调用;此处不讲解
- 函数ReturnFreeSurface(重要):用于给定水位的初始条件。
对于本算例,初始水位为0;故设置如下:REAL ReturnFreeSurface(REAL x, REAL y, REAL d) { return 0.0; } - 函数ReturnSalinity和ReturnTemperature:用于确定初始时刻的盐度/温度场(不重要)
由于state.c中的设置:
水体密度仅和水体盐度相关。而系数beta=0(suntans.dat中设定),故可认为本例中盐度和温度设置对流动过程没有影响。REAL StateEquation(const propT *prop, const REAL s, const REAL T, const REAL p) { return prop->beta*s; } - 函数ReturnHorizontalVelocity:设定了初始时的水平流速场
REAL ReturnHorizontalVelocity(REAL x, REAL y, REAL n1, REAL n2, REAL z) {
	return 0.0;
}
边界条件设置
在本算例中,需要设定的边界条件有两部分.一是陆地边界(marker=1),二是受潮汐驱动的开边界(marker=2)。相关设置都在 initialization.c 文件中。
开边界处的通量计算(OpenBoundaryFluxes)
void OpenBoundaryFluxes(REAL **q, REAL **ub, REAL **ubn, gridT *grid, physT *phys, propT *prop) {
  int j, jptr, ib, k, forced;
  REAL **uc = phys->uc, **vc = phys->vc, **ucold = phys->uold, **vcold = phys->vold;
  REAL z, c0, c1, C0, C1, dt=prop->dt, u0, u0new, uc0, vc0, uc0old, vc0old, ub0;

  for(jptr=grid->edgedist[2];jptr<grid->edgedist[3];jptr++) {
    j = grid->edgep[jptr];

    ib = grid->grad[2*j];

    for(k=grid->etop[j];k<grid->Nke[j];k++) {
      ub[j][k] = phys->boundary_u[jptr-grid->edgedist[2]][k]*grid->n1[j]
    	+ phys->boundary_v[jptr-grid->edgedist[2]][k]*grid->n2[j];
    }
  }
}
上面的代码指定了,在所有marker=2的边上(grid->edgedist[2]),速度ub为是 (boundary_u, boundary_v) 在边界法相量 (n1, n2)上的投影:
      ub[j][k] = phys->boundary_u[jptr-grid->edgedist[2]][k]*grid->n1[j]
    	+ phys->boundary_v[jptr-grid->edgedist[2]][k]*grid->n2[j];
(boundary_u, boundary_v) 将在函数BoundaryVelocities中设定。
开边处的速度、水位(BoundaryVelocities)
void BoundaryVelocities(gridT *grid, physT *phys, propT *prop, int myproc, MPI_Comm comm) {
  int i, j, jind, iptr, jptr, n, k;
  REAL h, u, v, toffSet, secondsPerDay = 86400.0;

  if(prop->n==prop->nstart+1)
    SetTideComponents(grid,myproc);

  // Tidal data is from the start of a particular year, so an offset
  // needs to be used to start the simulation on a particular date.
  // Note that the offset time is in days, and must be converted to seconds
  // using the secondsPerDay variable.
  toffSet = MPI_GetValue(DATAFILE,"toffSet","BoundaryVelocities",myproc)*secondsPerDay;

  for(jptr=grid->edgedist[2];jptr<grid->edgedist[3];jptr++) {
    jind = jptr-grid->edgedist[2];
    j = grid->edgep[jptr];

    u=v=h=0;
    for(n=0;n<numtides;n++) {
      h = h + h_amp[jind][n]*cos(omegas[n]*(toffSet+prop->rtime) + h_phase[jind][n]);
      u = u + u_amp[jind][n]*cos(omegas[n]*(toffSet+prop->rtime) + u_phase[jind][n]);
      v = v + v_amp[jind][n]*cos(omegas[n]*(toffSet+prop->rtime) + v_phase[jind][n]);
    }

    // Velocities from tides.c are in cm/s and h is in cm!
    phys->boundary_h[jind]=h*(1-exp(-prop->rtime/prop->thetaramptime))/100.0;
    for(k=grid->etop[j];k<grid->Nke[j];k++) {
      phys->boundary_u[jind][k]=u*(1-exp(-prop->rtime/prop->thetaramptime))/100.0;
      phys->boundary_v[jind][k]=v*(1-exp(-prop->rtime/prop->thetaramptime))/100.0;
      phys->boundary_w[jind][k]=0;
    }
  }
  for(iptr=grid->celldist[1];iptr<grid->celldist[2];iptr++) {
    jind = iptr-grid->celldist[1]+grid->edgedist[3]-grid->edgedist[2];
    i = grid->cellp[iptr];

    u=v=h=0;
    for(n=0;n<numtides;n++) {
      h = h + h_amp[jind][n]*cos(omegas[n]*(toffSet+prop->rtime) + h_phase[jind][n]);
      u = u + u_amp[jind][n]*cos(omegas[n]*(toffSet+prop->rtime) + u_phase[jind][n]);
      v = v + v_amp[jind][n]*cos(omegas[n]*(toffSet+prop->rtime) + v_phase[jind][n]);
    }

    // Velocities from tides.c are in cm/s and h is in cm!
    phys->h[i]=h*(1-exp(-prop->rtime/prop->thetaramptime))/100.0;
    for(k=grid->ctop[i];k<grid->Nk[i];k++) {
      phys->uc[i][k]=u*(1-exp(-prop->rtime/prop->thetaramptime))/100.0;
      phys->vc[i][k]=v*(1-exp(-prop->rtime/prop->thetaramptime))/100.0;
      phys->w[i][k]=0;
    }
  }
}
首先,调用tide.c中的SetTideComponents函数。该函数会读取输入文件夹中的潮汐参数文件,该参数文件的名字在suntans.dat中被指定:
TideInput               tidecomponents.dat
TideOutput              tidexy.dat
即潮汐参数文件的文件名为tidecomponents.dat。该数据文件是二进制格式,包含了分潮数 numtides、开边界的edges数 numboundaryedges,以及对应的各个分潮的角频率 omega,水平流速、水位振幅 amp 和相位角 phase。

此外,BoundaryVelocities还会读取 suntans.dat 中的一个数据 toffSet。这个数据表示模拟起始时间与tidecomponents.dat起始时间的偏移量,单位为天。在本算例中,toffSet=7。
prop->nctime = prop->toffSet*86400.0 + prop->nstart*prop->dt;
随后,第一个循环 for(jptr=grid->edgedist[2];jptr< grid->edgedist[3];jptr++) 中根据不同分潮的参数,求出了水位h和水平流速u、v的值;并用这些值确定了开边界的boundary_u、boundary_v、boundary_w。同时,为了避免潮汐边界条件在脉冲启动时的瞬态振荡,潮汐边界的添加还涉及了“缓坡启动”,设置的启动时间 thetaramptime=86400s (suntans.dat)。
在第二个循环 for(iptr=grid->celldist[1];iptr< grid->celldist[2];iptr++) 中,设定边界处的网格中心的流速uc、vc和w与边界处相等,即 uc = boundary_u、vc = boundary_v、wc = boundary_w。
其它参数配置
该算例采用静压模拟(suntans.dat: nonhydrostatic = 0),时间步长为Δt=90s (suntans.dat: dt = 90),总共运行3000个时间步(suntans.dat: nstep = 13440),并每隔120步输出一次结果(suntans.dat: ntout = 1344)。
水体的分子粘度采用 0.1 m2/s,垂向粘度通过求解MY-2.5紊流模型得到。
动量平流项采用中心差分格式(suntans.dat: nonlinear = 2)。
此外,模拟考虑了科氏力效应,设置科氏力系数Coriolis_f = 8.7e-5。
模拟结果
以下展示水位的模拟结果(TStep=13440; T=14days)。
