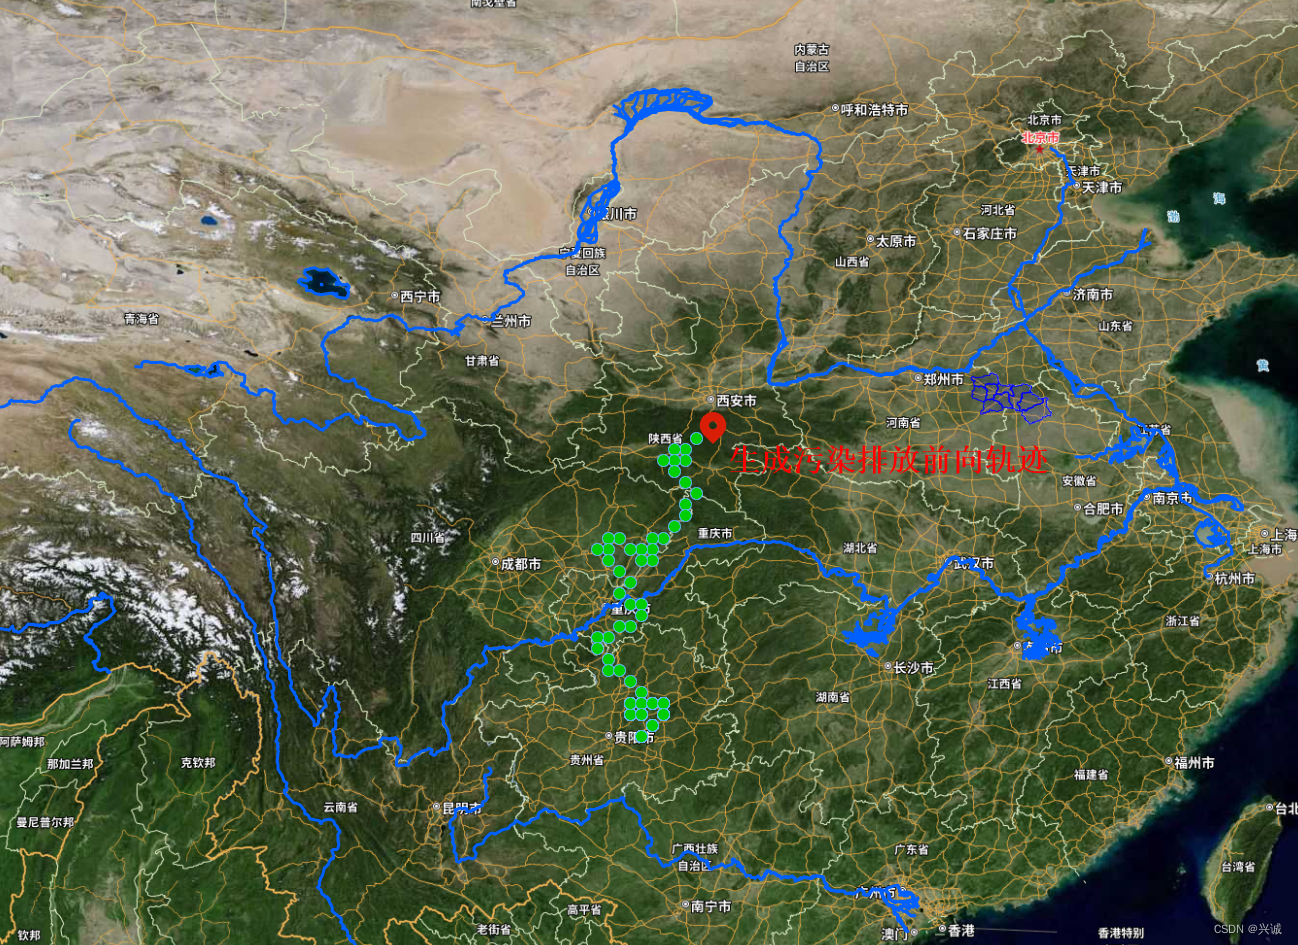
开头先看下模拟实现效果图
一、技术应用及背景说明
了解大气污染传输路径模拟可以帮助我们更好地了解空气污染的来源和传播方式,从而采取更有效的控制措施。这种模拟技术可以根据大气环境和气象条件,模拟出污染物在大气中的传播路径和影响范围,提供科学依据来指导环保政策制定和实施。
利用科技手段来探究大气污染的传输路径是一项重要的研究工作。通过模拟分析,我们可以更全面地了解污染物在空气中的流动情况,为环境保护和治理提供有力支持。
在现代社会中,空气污染已经成为了一个普遍存在的问题。尽管这是一个复杂的问题,但是我们可以采用各种手段来减少大气污染的影响,比如提高环保意识、使用清洁能源、建设绿色城市等。
除了我们个人和企业的努力,科技也可以帮助我们更好地理解和应对大气污染。例如,大气污染传输路径模拟技术可以帮助我们了解污染物在大气中的传播规律和来源,并制定相应的治理措施。这种技术的应用不仅可以提高我们的环境治理能力,也可以为科学家提供数据和信息,促进环境科学研究的发展。
同时,大气污染传输路径模拟技术的应用也需要政府的支持和监管。政府可以制定更加严格的环保法规和标准,规范企业的生产行为,减少大气污染物的排放。此外,政府还可以通过资金投入和科技支持,推动环境科学研究和技术创新,为环境治理提供更多的手段和资源。
二大气污染排放场景
污染排放

三、技术实现
1、风场数据抓取可参照
风场数据抓取程序实现(java+python实现)_兴诚的博客-CSDN博客

2、Java接口代码编写实现
//http://localhost:8945/api/TrajectoryTracking/TrajectoryTrackingForward?lon=126&lat=45
@ApiOperation(value = "TrajectoryTracking")
@GetMapping(value = "/TrajectoryTrackingForward")
public String TrajectoryTrackingForward(double lon,double lat) {
    JSONArray datalist = JSON.parseArray(HttpUtils.sendGet("http://localhost:8213/wind/windresult/20230412/2023041202.json",""));
    String geoStr = InterpolationTraceUtils.calForwardPoints(lon,lat,datalist);
    return geoStr;
}
3、iClientOpenlayer实现可视化代码部分代码配置
<template>
  <div class="layerPanel">
    <div v-if="isPanelShow" class="layerPanel-content">
      <el-container>
        <el-header style="height: 30px">大气污染传输轨迹模拟计算</el-header>
        <el-main>
          <div>
            <div style="margin: 3px">
              <span>起点坐标:</span>
              <el-input v-model= 'startLonLat' style="width: 90%;" clearable></el-input>
            </div>
            <div style="margin: 3px">
              <span>模拟计算:</span>
              <el-button type="primary" round @click="simulationCalculate">计算</el-button>
            </div>
          </div>
        </el-main>
      </el-container>
    </div>
    <div class="layer-collapse" @click="layersPanelCollapse">
      <i class="layerlist"></i>
    </div>
  </div>
</template>

<script>
export default {
  data () {
    return {
      layers: 11,
      isPanelShow: false,
      clayersInfo: [],
      opacityValue: 100,
      dh: 40,
      dz: 60,
      u: 3,
      q: 300000,
      gRows: 25,
      gColums: 50,
      gScale: 8,
      windOptions: [{
        value: '0',
        label: '北风'
      }, {
        value: '45',
        label: '东北风'
      }, {
        value: '90',
        label: '东风'
      }, {
        value: '135',
        label: '东南风'
      }, {
        value: '180',
        label: '南风'
      },{
        value: '225',
        label: '西南风'
      }, {
        value: '270',
        label: '西风'
      }, {
        value: '315',
        label: '西北风'
      }],
      windValue: '225',
      airStableOptions: [{
        value: 'A',
        label: '强不稳定'
      }, {
        value: 'B',
        label: '不稳定'
      }, {
        value: 'C',
        label: '弱不稳定'
      }, {
        value: 'D',
        label: '中性'
      }, {
        value: 'E',
        label: '较稳定'
      },{
        value: 'F',
        label: '稳定'
      }],
      airStableValue: 'F'
    }
  },
  mounted () {

  },
  methods: {
    layersPanelCollapse () {
      this.isPanelShow = !this.isPanelShow
    },
    simulationCalculate(){
      this.$emit("GaussPlumeSimulation", this.windValue,this.dz,this.dh,this.u,this.q,this.startLonLat.split(',')[0], this.startLonLat.split(',')[1],this.gColums,this.gRows,this.gScale,this.airStableValue)
    },
    locationToItem () {
      this.$emit("zoomToC", this.startLonLat.split(',')[0], this.startLonLat.split(',')[1], 14.2)
    }
  },
  props: {
    startLonLat: Object
  }
}
</script>

<style lang="less" scoped>
@import "./assets/css/index";
</style>
<template>
  <div>
    <div id="map" style="width: 100%;">
      <popHover :popHoverInfo="popHoverInfo" :popHoverScreenPoint="popHoverScreenPoint" :popHoverVisible="popHoverVisible"></popHover>
      <popClick :popAspect="popAspect" :popClickScreenPoint="popClickScreenPoint" :popClickVisible="popClickVisible" :popClickTitleInfo="popClickTitleInfo" :popClickContentInfo="popClickContentInfo"></popClick>
    </div>
    <div id="gisToolPopoup">
      <GisTool :sMap="smap" @tdtSwitchBase="tdtSwitchBase"></GisTool>
    </div>
    <div id="layersPanel">
      <layerPanel :layersInfo="layersInfo" @setLayerVisible="setLayerVisible" @setLayerOpacity="setLayerOpacity" @zoomToC="zoomToC"></layerPanel>
    </div>
    <div id="GaussPlumeCalculate">
      <GaussPlumePanel :startLonLat="startLonLat" @zoomToC="zoomToC" @GaussPlumeSimulation="GaussPlumeSimulation"></GaussPlumePanel>
    </div>
  </div>
</template>
<script>
import GisTool from './gisTool'
import layerPanel from './widgets/layerPanel/index'
import GaussPlumePanel from './widgets/GaussPlumePanel/index'
import Map from 'ol/Map'
import View from 'ol/View'
import * as control from 'ol/control'
// import { Logo,ScaleLine } from '@supermap/iclient-ol'
import {Logo} from '@supermap/iclient-ol/control/Logo'
import {ScaleLine} from '@supermap/iclient-ol/control/ScaleLine'
import {iCOLMapConfig} from './Store/iCOLMapConfig'
import {layersInfo} from './LayersInfo/LayersInfo'
import {layerMsgClick} from './layerMsg/LayerMsgClick'
import {layerMsgMouseOver} from './layerMsg/LayerMsgMouseOver'
import popHover from './widgets/popHover/index'
import popClick from './widgets/popClick/index'
import {WindyUtil} from './gisUtils/WindyUtil.js'
import {
  initTdtBaseMap,
  CommonCreateLayers,
  getLayerByCode,
  tdtSwitchBase,
  MapMouseoverEvent,
  MapClick,
  addElementToMap,
  getGeojsonByLayerCode,
  setLayersVisible,
  setLayersVisibleByCode,
  zoomC,
  commonRefreshVectorGeojsonLayer,
  CommonCreateVectorLayerGroup,
  refreshCv, CommonRemoveLayers, commonCreatePoint
} from './MapCommon'
import $ from 'jquery'
import {windData} from './data/windData'
import {LayersRenderSet} from "@/components/iClientOpenLayers/RendersInfo/LayersRenderSet";
let icolMap,_this
export default {
  components: {
    GisTool,
    layerPanel,
    GaussPlumePanel,
    popHover,
    popClick
  },
  name: 'iCOLMapCommon',
  data () {
    return {
      smap: null,
      startLonLat: '115.76745223366264,34.40937666512325',
      layersInfo: layersInfo,
      baseLayerArr:[],
      popHoverScreenPoint: {x: null, y: null},
      popHoverInfo: '',
      popHoverVisible: false,
      popClickScreenPoint: {x: null, y: null},
      popAspect: {cWidth: 600, cHeight: 400},
      popClickPoint: null,
      windyUtil: null,
      popClickTitleInfo: '',
      popClickContentInfo: '',
      popClickVisible: false,
    }
  },
  methods: {
    initMap: function () {
      $('#map').css('height', window.innerHeight)
      icolMap = new Map({
        target: 'map',
        controls: control.defaults({attributionOptions: {collapsed: true}})
            .extend([new Logo()]),
        view: new View({
          center: iCOLMapConfig.defaultMapViewCenter,
          zoom: iCOLMapConfig.defaultMapViewLevel,
          minZoom: iCOLMapConfig.minZoom,
          maxZoom: iCOLMapConfig.maxZoom,
          projection: iCOLMapConfig.projection,
          multiWorld: true
        })
      })
      this.smap = icolMap
      initTdtBaseMap(icolMap)
      icolMap.addControl(new ScaleLine())
      CommonCreateLayers(icolMap, layersInfo,_this)
      tdtSwitchBase(icolMap, 'img', true)
      // let windyUtil = new WindyUtil(this.smap)
      // windyUtil.addWindyLayer(windData)
      // windyUtil.clearWindyLayer()
      // debugger
      // var detail=windyUtil.getWindyDetail([103,45])

      let source = getLayerByCode(icolMap, 'CRegion').getSource()
      let vector = getLayerByCode(icolMap, 'CRegion')
      source.layer = vector
      // icolMap.addLayer(vector);
      // console.log(new Modify({source: source}))
      // let modify = new Modify({source: source})
      // icolMap.addInteraction(modify);
      let displayFeatureInfo = function (coordinate) {
        let pixel = icolMap.getPixelFromCoordinate(coordinate)
        console.log('longitude: ' + icolMap.getView().getCenter()[0].toString() + ', latitude: '+ icolMap.getView().getCenter()[1].toString() + ', level: '+ icolMap.getView().getZoom().toString())

        // var details = windyUtil.getWindyDetail(coordinate);
        // console.log(details);
        // alert(' 风向:' + details.direction + '\n 风级:' + details.level + '\n 风速:' + details.speed)
        let features = {length: 0}
        icolMap.forEachFeatureAtPixel(pixel, function (feature, layer) {
          if (layer == null){
            return
          }
          // debugger
          features.length = features.length + 1
          let code = layer.get('code')
          let obj = features[code]
          if (!obj) {
            obj = []
          }
          obj.push(feature)

          features[code] = obj
        })
        //console.log(features.length);

        let laysers = Object.keys(features)
        if (laysers.length > 1) {
          features[laysers[1]][0]["code"] = laysers[1]
          MapClick(_this,layerMsgClick,features[laysers[1]][0], laysers[1])
          if (layersInfo[laysers[1]].CustomPopupTemplate) {
            _this.popHoverVisible = false
            _this.popClickTitleInfo = features[laysers[1]][0].values_.values_[layersInfo[laysers[1]].CustomPopupTemplate.titleField]
            _this.popClickContentInfo = layersInfo[laysers[1]].CustomPopupTemplate.content
            let attrs = Object.keys(features[laysers[1]][0].values_.values_)
            for (let i = 0; i < attrs.length; i++) {
              _this.popClickContentInfo = _this.popClickContentInfo.replaceAll('{' + attrs[i] + '}', features[laysers[1]][0].values_.values_[attrs[i]])
            }
            _this.popAspect.cWidth = layersInfo[laysers[1]].CustomPopupTemplate.width
            _this.popAspect.cHeight = layersInfo[laysers[1]].CustomPopupTemplate.height
            _this.popClickVisible = true
          }
        }
        return features.length > 0
      }
      let displayFeatureInfoOver = function (coordinate) {
        let pixel = icolMap.getPixelFromCoordinate(coordinate)
        let features = {length: 0}
        icolMap.forEachFeatureAtPixel(pixel, function (feature, layer) {
          if (layer == null){
            return
          }
          features.length = features.length + 1
          let code = layer.get('code')
          let obj = features[code]
          if (!obj) {
            obj = []
          }
          obj.push(feature)

          features[code] = obj
        })
        //console.log(features.length);

        let laysers = Object.keys(features)
        if (laysers.length > 1) {
          features[laysers[1]][0]["code"] = laysers[1]
          features[laysers[1]][0]["pixel"] = pixel
          MapMouseoverEvent(_this,layerMsgMouseOver,features[laysers[1]][0], laysers[1])
          if (layersInfo[laysers[1]] && layersInfo[laysers[1]].floatLabelInfo) {
            _this.popHoverScreenPoint.x = pixel[0] + layersInfo[laysers[1]].floatLabelInfo.offsetX
            _this.popHoverScreenPoint.y = pixel[1] + layersInfo[laysers[1]].floatLabelInfo.offsetY
            _this.popHoverInfo = features[laysers[1]][0].values_.values_[layersInfo[laysers[1]].floatLabelInfo.floatLabelField]
            _this.popHoverVisible = true
          } else {
            _this.popHoverVisible = false
          }
        } else {
          _this.popHoverVisible = false
        }
        return features.length > 0
      }

      /**
       * Add a click handler to the map to render the popup.
       */
      icolMap.on('click', function (evt) {
        // let geojson=getGeojsonByLayerCode(icolMap,'Measure')

        // if (evt.dragging) {
        //     //处于多边形查询工具操作下
        //     return;
        // }
        let coordinate = evt.coordinate
        _this.startLonLat = evt.coordinate[0]+','+evt.coordinate[1]
        commonCreatePoint(icolMap,layersInfo,"LS",LayersRenderSet,[{id:1,lon:evt.coordinate[0],lat:evt.coordinate[1]}],"lon","lat")
        // var details = _this.getWindyDetail(coordinate);
        // console.log(details);
        // alert(' 风向:' + details.direction + '\n 风级:' + details.level + '\n 风速:' + details.speed);
        //console.log(coordinate);
        //点击事件
        if (displayFeatureInfo(coordinate)) {
          return
        }
      })
      icolMap.on('dblclick', function (evt) {
        // if (evt.dragging) {
        //     //处于多边形查询工具操作下
        //     return;
        // }
      })
      icolMap.on('moveend', function (evt) {
        //缩放等级控制解析器
        let laysers = Object.keys(layersInfo);
        let cZoom = icolMap.getView().getZoom()
        for (let i = 0; i < laysers.length; i++) {
          if (layersInfo[laysers[i]].sourceType === "Overlay" && layersInfo[laysers[i]].visible == true ) {
            if(layersInfo[laysers[i]].minZoom < cZoom && cZoom <= layersInfo[laysers[i]].maxZoom){
              _this.setLayerVisibleOverly(laysers[i],true)
            }else {
              _this.setLayerVisibleOverly(laysers[i],false)
            }
          }
          if((layersInfo[laysers[i]].isGroupLayer||false == true)&&layersInfo[laysers[i]].visible == true) {
            if(layersInfo[laysers[i]].minZoom < cZoom && cZoom <= layersInfo[laysers[i]].maxZoom && layersInfo[laysers[i]].outRes.length>0) {
              refreshCv(layersInfo[laysers[i]].outRes,icolMap,layersInfo,laysers[i])
            }
          }
        }


        // var pixel = icolMap.getPixelFromCoordinate([115.783878,34.308761])
      })
      icolMap.on('pointermove', function (evt) {
        if (evt.dragging) {
          return
        }
        let coordinate = evt.coordinate
        displayFeatureInfoOver(coordinate)
      })
      // let el = document.createElement('div')
      // el.innerHTML = "<span style='color: red;font-size: larger;font-weight: bold'>gis创造美好未来</span>"
      // addElementToMap(this.smap,el,115.783878,34.308761,'popoupid')
      // let echartsLayerUtil = new EchartsLayerUtil(this.smap)
      // echartsLayerUtil.createTransferLayer(transferData,'code','entName')
      // let info = new control.Control({element: document.getElementById('popup')})
      // info.setMap(icolMap)
      // icolMap.addControl(info)

      // debugger
    },
    tdtSwitchBase (type, isLabel) {
      tdtSwitchBase(this.smap,type,isLabel)
    },
    refreshXZQH(regionCode){
      commonRefreshVectorGeojsonLayer('/image/duoyuanronghe/'+regionCode+'/XZQH.json',layersInfo,'XZQHRegion',this.smapm)
    },
    setLayerVisibleOverly (layerId, visible) {
      if(layersInfo[layerId].sourceType == 'Overlay'){
        for(let i = 0; i < layersInfo[layerId].overlays.length; i++){
          layersInfo[layerId].overlays[i].setVisible(visible)
        }
      }
    },
    setLayerVisible (layerId, visible) {
      let _this = this
      // debugger
      // CommonCreateVectorLayerGroup(_this.smap,layersInfo,'point1')
      // setInterval(function () {
      //   debugger
      //   CommonCreateVectorLayerGroup(_this.smap,layersInfo,'point1')
      // },13000)
      if(layersInfo[layerId].sourceType == 'Overlay'){
        for(let i = 0; i < layersInfo[layerId].overlays.length; i++){
          layersInfo[layerId].overlays[i].setVisible(visible)
        }
        // layersInfo[layerId].visible = visible
      }else {
        setLayersVisibleByCode(this.smap, [layerId], visible)
      }
      (layersInfo[layerId]||{}).visible = visible

    },
    setLayerOpacity (layerId, opacity) {
      getLayerByCode(this.smap, layerId).setOpacity(opacity)
    },
    GaussPlumeSimulation(wd,z,h,u,q,lon,lat,colums,rows,scale,airStable){
      let lyifs = {
        geoJsonFeP: {
          layerCode: 'geoJsonFeP',
          isRLayerPanel: true,
          sourceType: 'Vector',
          title: '轨迹点',
          url: '/api/TrajectoryTracking/TrajectoryTrackingForward?lon='+lon+'&lat='+lat,
          dataPath:'',
          floatLabelInfo: {floatLabelField: 'val', offsetX: 8, offsetY: -16},
          geoType: 'geojson',
          maxZoom: Infinity,
          minZoom: -Infinity,
          wrapX: false,
          opacity: 1,
          location: {longitude: 116.11704458402367, latitude: 34.25804927841997, level: 9.808516864898834},
          visible: layersInfo['geoJsonFeP'].visible
        },
      }
      CommonRemoveLayers(icolMap, lyifs)
      CommonCreateLayers(icolMap, lyifs,this)
    },
    zoomToC (x, y, level) {
      zoomC(this.smap, x, y, level, false)
    },
    getGeojsonByLayerCode(layerCode){
      return getGeojsonByLayerCode(this.smap,layerCode)
    }
  },
  updated () {

  },
  mounted () {
    _this = this
    this.initMap()
  }
}
</script>
<style>
@import url('../../../public/static/gis/css/ol.css');
@import url('../../../public/static/css/css/mapoperatestyle.css');
#popup1 {
  position: absolute;
  top: 50px;
  right: 20px;
}
.ol-zoom{
  display: none;
}
#gisToolPopoup{
  position: absolute;
  top: 50px;
  left: 20px;
}
#layersPanel{
  position: absolute;
  top: 50px;
  right: 300px;
}
#GaussPlumeCalculate{
  position: absolute;
  bottom: 20px;
  right: 30px;
}
.ol-attribution{
  display: none;
}
.ol-control-logo{
  display: none;
}
.ol-rotate{
  display: none;
}
.ol-scale-line{
  display: none;
}
</style>
//如果对您有所帮助, 请点赞支持 !
//技术合作交流qq:2401315930
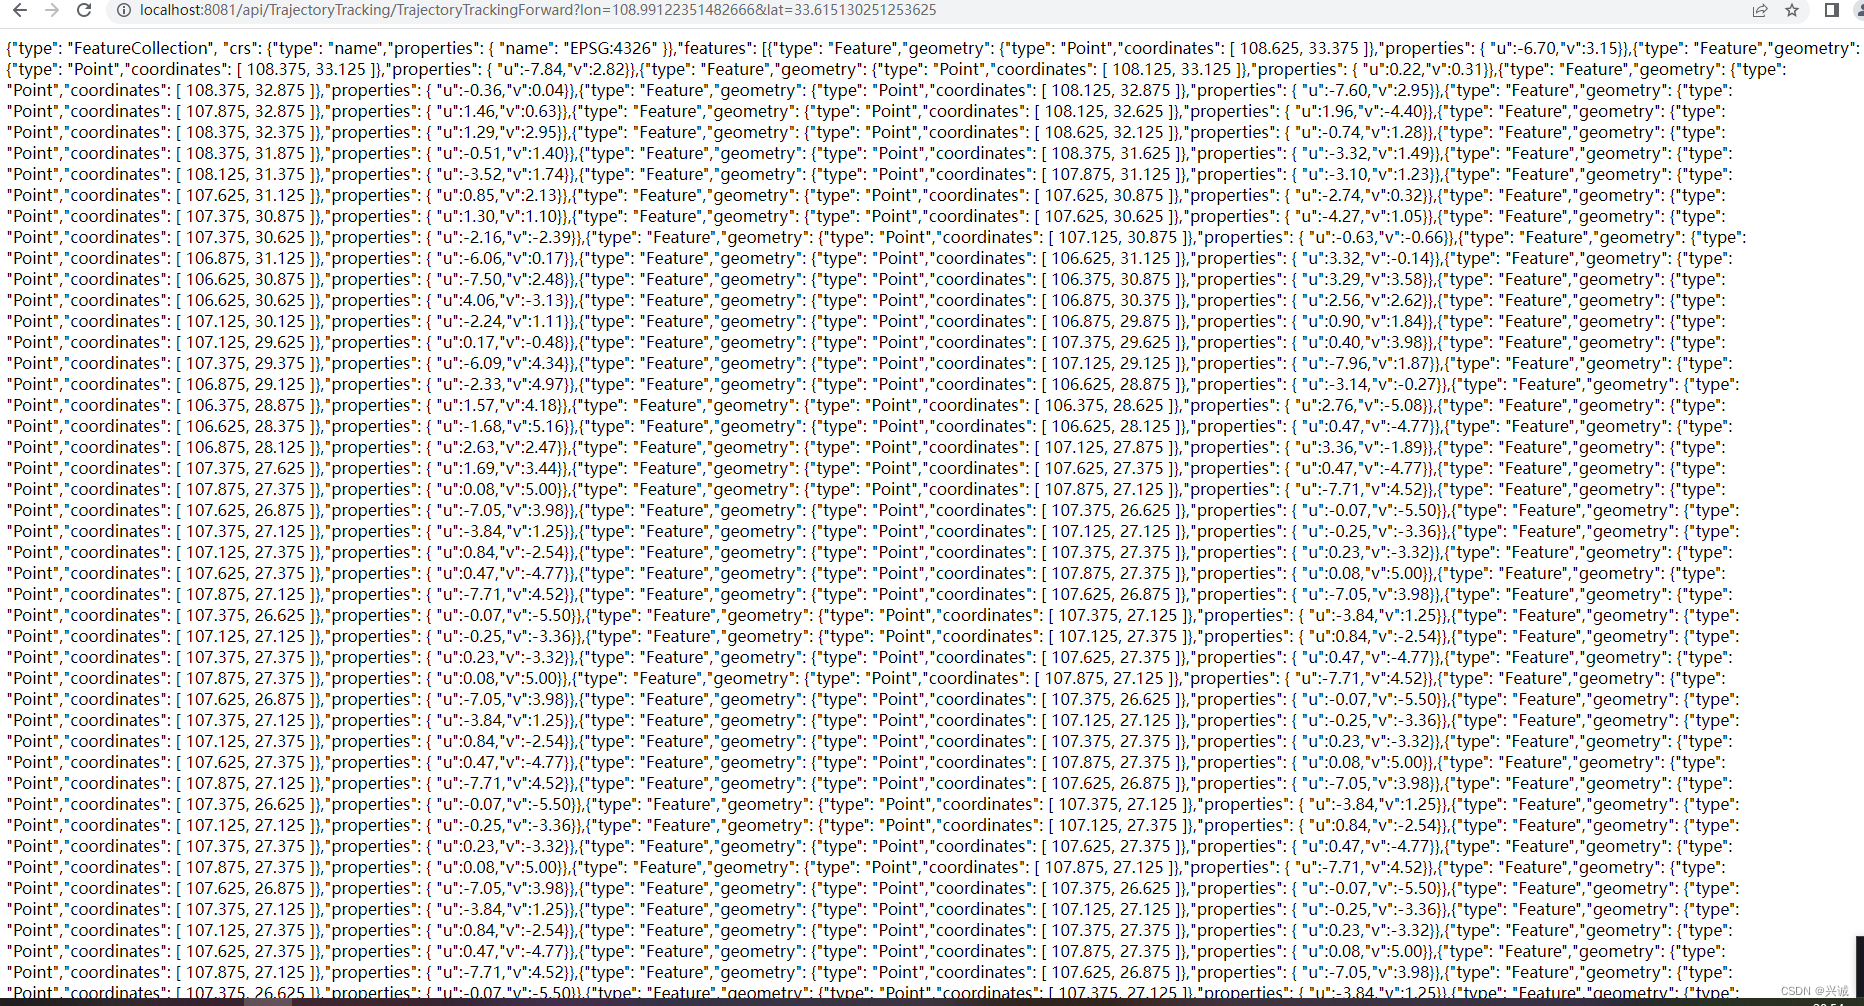
四、接口调用及geojson数据成果返回
五、前端可视化模拟效果


