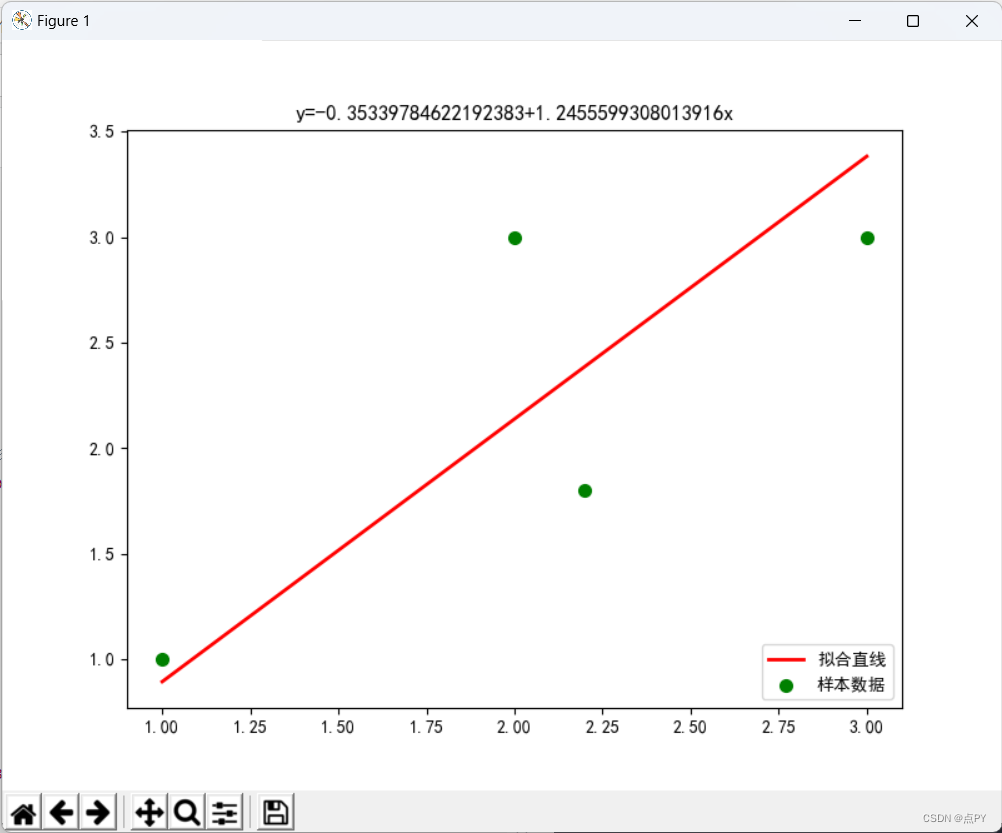
在图像处理中,通常会遇到根据给定的点集(比如轮廓)拟合出一条直线的情形。
import numpy as np
import matplotlib.pyplot as plt
import cv2


def Cal_kb_linear_fitline(pointLocs):
    loc = np.array(pointLocs) # loc 必须为矩阵形式,且表示[x,y]坐标
    output = cv2.fitLine(loc, cv2.DIST_L2, 0, 0.01, 0.01)
    k = output[1] / output[0]
    b = output[3] - k * output[2]
    return k[0], b[0]

if __name__ == "__main__":

    Xi = []
    Yi = []

    points = [[1, 1], [2, 3], [3, 3], [2.2, 1.8]]
    for x, y in points:
        Xi.append(x)
        Yi.append(y)

    Xi = np.array(Xi)
    Yi = np.array(Yi)

    k, b = Cal_kb_linear_fitline(np.array(points))

    plt.rcParams['font.sans-serif']=['SimHei']
    plt.figure(figsize=(8, 6))
    plt.scatter(Xi, Yi, color="green", label="样本数据", linewidth=2)

    x = np.array([1,2,3])
    y = k * x + b
    plt.plot(x, y, color="red", label="拟合直线", linewidth=2)
    plt.title('y={}+{}x'.format(b,k))
    plt.legend(loc='lower right')
    plt.show()
