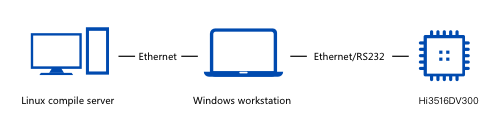
1. 结构图 Input Shape : (3, 7, 7) — Output Shape : (2, 3, 3) — K : (3, 3) — P : (1, 1) — S : (2, 2) — D : (2, 2) — G : 1 The parts of this post will be divided according to the following arguments. These arguments can be found in the Pytorch documen…
简介
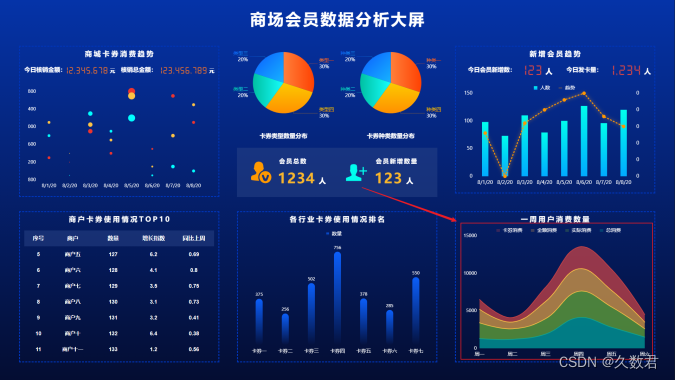
在之前的文章中提到过,面积图(Area Chart)是在折线图的基础上,对折线以下区域进行颜色填充,主要是用于在连续间隔或时间跨度上展示数值。而今天我们要说的是堆叠面积图(Stacked Area Chart࿰…