值函数近似
- Value Function Approximation
- Motivating examples: curve fitting
- Algorithm for state value estimation
- Objective function
- Optimization algorithms
- Selection of function approximators
- Illustrative examples
- Summary of the story
- Theoretical analysis
- Sarsa with function appriximation
- Q-learning with function approximation
- Deep Q-learning
- 内容来源
Value Function Approximation
Motivating examples: curve fitting
到目前为止,我们都是使用tables表示state和action values。例如,下表是action value的表示:

- 优势:直观且容易分析
- 劣势:难以处理较大或者连续的state或者action空间。两个方面:1)存储;2)泛化能力。
举个例子:假定有一个one-dimensional states
s
1
,
.
.
.
,
s
∣
S
∣
s_1,...,s_{|S|}
s1,...,s∣S∣,当
π
\pi
π是给定策略的时候,它们的state values是
v
π
(
s
1
)
,
.
.
.
,
v
π
(
s
∣
S
∣
)
v_\pi(s_1),...,v_\pi(s_{|S|})
vπ(s1),...,vπ(s∣S∣)。假设
∣
S
∣
|S|
∣S∣非常大,因此我们希望用一个简单的曲线近似它们的点以降低内存:

答案是可以的。
首先我们使用简单的straight line去拟合这些点。假设straight line的方程为

其中:
- w w w是参数向量(parameter vector)
- ϕ ( s ) \phi(s) ϕ(s)是s的特征向量(feature vector)
- v ^ ( s , w ) \hat{v}(s,w) v^(s,w)与 w w w成线性关系(当然,也可以是非线性的)
这样表示的好处是:
- 表格形式需要存储 ∣ S ∣ |S| ∣S∣个state values,现在,只需要存储两个参数 a a a和 b b b
- 每次我们想要使用s的值,我们可以计算 ϕ T ( s ) w \phi^T(s)w ϕT(s)w。
- 但是这个好处也不是免费的,它需要付出一些代价:state values不能被精确地表示,这也是为什么这个方法被称为value approximation。
既然直线不够准确,那么是否可以使用高阶的曲线呢?当然可以。第二,我们使用一个second-order curve去拟合这些点:

在这种情况下:
- w w w和 ϕ ( s ) \phi(s) ϕ(s)的维数增加了,但是values可以被拟合的更加精确。
- 尽管 v ^ ( s , w ) \hat{v}(s,w) v^(s,w)与 s s s是非线性的,但是它与 w w w是线性的。这种非线性的性质包含在 ϕ ( s ) \phi(s) ϕ(s)中。
当然,还可以继续增加阶数。第三,使用一个更加high-order polynomial curves(多项式曲线)或者其他复杂的曲线来拟合这些点:
- 好处是:更好的approximate
- 坏处是:需要更多的parameters
小结一下:
- Idea:value function approximation的idea是用一个函数 v ^ ( s , w ) \hat{v}(s, w) v^(s,w)来拟合 v π ( s ) v_\pi(s) vπ(s),这个函数里边有参数 w w w,所以被称为parameterized function, w w w就是parameter vector。
- 这样做的好处:
- 1)节省存储: w w w的维数远小于 ∣ S ∣ |S| ∣S∣
- 2)泛化能力:当一个state s s s是visited,参数 w w w是updated,这样某些其他unvisited states的values也可以被updated。按这种方式,the learned values可以泛化到unvisited states。
Algorithm for state value estimation
Objective function
首先,用一种更正式的方式:
- 令 v π ( s ) v_\pi(s) vπ(s)和 v ^ ( s , w ) \hat{v}(s,w) v^(s,w)分别表示true state value和approximate函数.
- 我们的目标是找到一个最优的 w w w,使得 v ^ ( s , w ) \hat{v}(s,w) v^(s,w)对于每个 s s s达到最优的近似 v π ( s ) v_\pi(s) vπ(s)
- 这个问题就是一个policy evaluation问题,稍后我们将会把它推广到policy improvement。
- 为了找到最优的
w
w
w,我们需要两步:
- 第一步定义一个目标函数(object function)
- 第二步是优化这个目标函数。
The objective function is: J ( w ) = E [ ( v π ( S ) − v ^ ( S , w ) ) 2 ] J(w)=\mathbb{E}[(v_\pi(S)-\hat{v}(S,w))^2] J(w)=E[(vπ(S)−v^(S,w))2]
- 我们的目标是找到最优的 w w w,这样可以最小化 J ( w ) J(w) J(w)
- The expectation is with respect to the random variable
S
∈
S
S\in \mathcal{S}
S∈S。
S
S
S的概率分布是什么?
- This is often confusing because we have not discussed the probability distribution of states so far
- There are several ways to define the probability distribution of S S S.
第一种方式是使用一个uniform distribution.
- 它对待每个states都是同等的重要性,通过将每个state的概率设置为 1 / ∣ S ∣ 1/|\mathcal{S}| 1/∣S∣
- 这种情况下,目标函数变为: J ( w ) = E [ ( v π ( S ) − v ^ ( S , w ) ) 2 ] = 1 ∣ S ∣ ∑ s ∈ S ( v π ( s ) − v ^ ( s , w ) ) 2 J(w)=\mathbb{E}[(v_\pi (S)-\hat{v}(S,w))^2]=\frac{1}{|\mathcal{S}|}\sum_{s\in \mathcal{S}}(v_\pi(s)-\hat{v}(s,w))^2 J(w)=E[(vπ(S)−v^(S,w))2]=∣S∣1s∈S∑(vπ(s)−v^(s,w))2
- 虽然平均分布是非常直观的,但是有一个问题:这里假设所有状态都是平等的,但是实际上可能不是那么回事。例如,某些状态在一个策略下可能几乎不会访问到。因此这种方式没有考虑一个给定策略下Markov process的实际动态变化。
第二种方式是使用stationary distribution
- Stationary distribution is an important concept. 它描述了一个Markov process的long-run behavior。
- 令 { d π ( s ) } s ∈ S \{d_\pi(s)\}_{s\in \mathcal{S} } {dπ(s)}s∈S表示基于策略 π \pi π的Markov process的stationary distribution。根据定义有, d π ( s ) ≥ 0 d_\pi(s)\ge 0 dπ(s)≥0且 ∑ s ∈ S d π ( s ) = 1 \sum_{s\in \mathcal{S}}d_\pi(s)=1 ∑s∈Sdπ(s)=1
- 在这种情况下,目标函数被重写为: J ( w ) = E [ ( v π ( S ) − v ^ ( S , w ) ) 2 ] = ∑ s ∈ S d π ( s ) ( v π ( s ) − v ^ ( s , w ) ) 2 J(w)=\mathbb{E}[(v_\pi (S)-\hat{v}(S,w))^2]=\sum_{s\in \mathcal{S}}d_\pi (s)(v_\pi(s)-\hat{v}(s,w))^2 J(w)=E[(vπ(S)−v^(S,w))2]=s∈S∑dπ(s)(vπ(s)−v^(s,w))2这里的 d π ( s ) d_\pi(s) dπ(s)就扮演了权重的意思,这个函数是一个weighted squared error。
- 由于更频繁地visited states,具有更高的 d π ( s ) d_\pi(s) dπ(s)值,它们在目标函数中的权重也比那些很少访问的states的权重高。
对于stationary distribution更多的介绍:
- Distribution:state的Distribution
- Stationary : Long-run behavior
- Summary: 智能体agent根据一个策略运行一个较长时间之后,the probability that the agent is at any state can be described by this distribution.
需要强调的是:
- Stationary distribution 也被称为steady-state distribution,或者limiting distribution
- 它在理解value functional approximation method方面是非常重要的
- 对于policy gradient method也是非常重要的。
举个例子:如图所示,给定一个探索性的策略。让agent从一个状态出发然后跑很多次,根据这个策略,然后看一下会发生什么事情。
- 令 n π ( s ) n_\pi(s) nπ(s)表示次数, s s s has been visited in a very long episode generated by π \pi π。
- 然后,
d
π
(
s
)
d_\pi(s)
dπ(s)可以由下式估计:
d
π
(
s
)
≈
n
π
(
s
)
∑
s
′
∈
S
n
π
(
s
′
)
d_\pi(s)\approx \frac{n_\pi(s)}{\sum_{s'\in \mathcal{S}}n_\pi(s') }
dπ(s)≈∑s′∈Snπ(s′)nπ(s)

The converged values can be predicted because they are the entries of d π d_\pi dπ: d π T = d π T P π d_\pi^T=d_\pi^TP_\pi dπT=dπTPπ
对于上面的例子,有 P π P_\pi Pπ: P π = [ 0.3 0.1 0.6 0 0.1 0.3 0 0.6 0.1 0 0.3 0.6 0 0.1 0.1 0.8 ] P_\pi=\begin{bmatrix}0.3 & 0.1 & 0.6 & 0\\0.1 & 0.3 & 0 & 0.6\\0.1 & 0 & 0.3 & 0.6\\0 & 0.1 & 0.1 & 0.8\end{bmatrix} Pπ= 0.30.10.100.10.300.10.600.30.100.60.60.8 可以计算出来它左边对应于eigenvalue等于1的那个eigenvector: d π = [ 0.0345 , 0.1084 , 0.1330 , 0.7241 ] T d_\pi=[0.0345, 0.1084, 0.1330, 0.7241]^T dπ=[0.0345,0.1084,0.1330,0.7241]T
Optimization algorithms
当我们有了目标函数,下一步就是优化它。为了最小化目标函数
J
(
w
)
J(w)
J(w),我们可以使用gradient-descent算法:
w
k
+
1
=
w
k
−
α
k
∇
w
J
(
w
k
)
w_{k+1}=w_k-\alpha_k\nabla_w J(w_k)
wk+1=wk−αk∇wJ(wk)它的true gradient是:

这个true gradient需要计算一个expectation。我们可以使用stochastic gradient替代the true gradient:
w
t
+
1
=
w
t
+
α
t
(
v
π
(
s
t
)
−
v
^
(
s
t
,
w
t
)
)
∇
w
v
^
(
s
t
,
w
t
)
w_{t+1}=w_t+\alpha_t (v_\pi(s_t)-\hat{v}(s_t,w_t))\nabla_w \hat{v}(s_t, w_t)
wt+1=wt+αt(vπ(st)−v^(st,wt))∇wv^(st,wt)其中
s
t
s_t
st是
S
\mathcal{S}
S的一个采样。这里
2
α
k
2\alpha_k
2αk合并到了
α
k
\alpha_k
αk。
- 这个算法在实际当中是不能使用的,因为它需要true state value v π v_\pi vπ,这是未知的。
- 可以使用 v π ( s t ) v_\pi(s_t) vπ(st)的一个估计来替代它,这样该算法就可以实现了
那么如何进行代替呢?有两种方法:
- 第一种,Monte Carlo learning with function approximation
令 g t g_t gt表示在episode中从 s t s_t st开始的discounted return,然后使用 g t g_t gt近似 v π ( s t ) v_\pi(s_t) vπ(st)。该算法变为 w t + 1 = w t + α t ( g t − v ^ ( s t , w t ) ) ∇ w v ^ ( s t , w t ) w_{t+1}=w_t+\alpha_t (g_t-\hat{v}(s_t,w_t))\nabla_w \hat{v}(s_t, w_t) wt+1=wt+αt(gt−v^(st,wt))∇wv^(st,wt) - 第二种,TD learning with function approximate
By the spirit of TD learning, r t + 1 + γ v ^ ( s t + 1 , w t ) r_{t+1}+\gamma \hat{v}(s_{t+1}, w_t) rt+1+γv^(st+1,wt)可以视为 v π ( s t ) v_\pi(s_t) vπ(st)的一个近似。因此,算法变为: w t + 1 = w t + α t [ r t + 1 + γ v ^ ( s t + 1 , w t ) ] ∇ w v ^ ( s t , w t ) w_{t+1}=w_t+\alpha_t[r_{t+1}+\gamma \hat{v}(s_{t+1}, w_t)]\nabla_w \hat{v}(s_t, w_t) wt+1=wt+αt[rt+1+γv^(st+1,wt)]∇wv^(st,wt)
TD learning with function approximation的伪代码:

该方法仅能估计在给定policy情况下的state values,但是对于后面的算法的理解是非常重要的。
Selection of function approximators
如何选取函数 v ^ ( s , w ) \hat{v}(s,w) v^(s,w)?
- 第一种方法,也是之前被广泛使用的,就是linear function v ^ ( s , w ) = ϕ T ( s ) w \hat{v}(s,w)=\phi^T(s)w v^(s,w)=ϕT(s)w这里的 ϕ ( s ) \phi(s) ϕ(s)是一个feature vector, 可以是polynomial basis,Fourier basis,…。
- 第二种方法是,现在广泛使用的,就是用一个神经网络作为一个非线性函数近似器。神经网络的输入是state,输出是 v ^ ( s , w ) \hat{v}(s,w) v^(s,w),网络参数是 w w w。
在线性的情况中
v
^
(
s
,
w
)
=
ϕ
T
(
s
)
w
\hat{v}(s,w)=\phi^T(s)w
v^(s,w)=ϕT(s)w,我们有
∇
w
v
^
(
s
t
,
w
t
)
=
ϕ
(
s
)
\nabla_w \hat{v}(s_t, w_t)=\phi(s)
∇wv^(st,wt)=ϕ(s)将这个带入到TD算法
w
t
+
1
=
w
t
+
α
t
[
r
t
+
1
+
γ
v
^
(
s
t
+
1
,
w
t
)
−
v
^
(
s
t
,
w
t
)
]
∇
w
v
^
(
s
t
,
w
t
)
w_{t+1}=w_t+\alpha_t[r_{t+1}+\gamma \hat{v}(s_{t+1}, w_t)-\hat{v}(s_t,w_t)]\nabla_w \hat{v}(s_t, w_t)
wt+1=wt+αt[rt+1+γv^(st+1,wt)−v^(st,wt)]∇wv^(st,wt)就变成了
w
t
+
1
=
w
t
+
α
t
[
r
t
+
1
+
γ
ϕ
T
(
s
t
+
1
)
w
t
−
ϕ
T
(
s
t
)
w
t
]
ϕ
(
s
t
)
w_{t+1}=w_t+\alpha_t[r_{t+1}+\gamma \phi^T(s_{t+1})w_t-\phi^T(s_t)w_t]\phi(s_t)
wt+1=wt+αt[rt+1+γϕT(st+1)wt−ϕT(st)wt]ϕ(st)这个具有线性函数近似的TD learning算法称为TD-Linear。
线性函数近似的劣势是:
- 难以去选择合适的feature vector.
线性函数近似的优势是: - TD算法在线性情况下的理论上的性质很容易理解和分析,与非线性情况相比
- 线性函数近似仍然在某些情况下使用:tabular representation是linear function approximation的一种少见的特殊情况。
那么为什么tabular representation是linear function approximation的一种少见的特殊情况?
- 首先,对于state s s s,选择一个特殊的feature vector ϕ ( s ) = e s ∈ R ∣ S ∣ \phi(s)=e_s\in \mathbb{R}^{|\mathcal{S}|} ϕ(s)=es∈R∣S∣其中 e s e_s es是一个vector,其中第 s s s个实体为1,其他为0.
- 在这种情况下 v ^ ( s t , w t ) = e s T w = w ( s ) \hat{v}(s_t, w_t)=e_s^Tw=w(s) v^(st,wt)=esTw=w(s)其中 w ( s ) w(s) w(s)是 w w w的第s个实体。
回顾TD-Linear算法: w t + 1 = w t + α t [ r t + 1 + γ ϕ T ( s t + 1 ) w t − ϕ T ( s t ) w t ] ϕ ( s t ) w_{t+1}=w_t+\alpha_t[r_{t+1}+\gamma \phi^T(s_{t+1})w_t-\phi^T(s_t)w_t]\phi(s_t) wt+1=wt+αt[rt+1+γϕT(st+1)wt−ϕT(st)wt]ϕ(st)
- 当 ϕ ( s t ) = e s \phi(s_t)=e_s ϕ(st)=es,上面的算法变成了 w t + 1 = w t + α t [ r t + 1 + γ w t ( s t + 1 ) − w t ( s t ) ] e s t w_{t+1}=w_t+\alpha_t[r_{t+1}+\gamma w_t(s_{t+1})-w_t(s_t)]e_{s_t} wt+1=wt+αt[rt+1+γwt(st+1)−wt(st)]est这是一个向量等式,仅仅更新 w t w_t wt的第 s s s个实体。
- 将上面式子两边乘以 e s t T e_{s_t}^T estT,得到 w t + 1 ( s t ) = w t ( s t ) + α t [ r t + 1 + γ w t ( s t + 1 ) − w t ( s t ) ] w_{t+1}(s_t)=w_t(s_t)+\alpha_t[r_{t+1}+\gamma w_t(s_{t+1})-w_t(s_t)] wt+1(st)=wt(st)+αt[rt+1+γwt(st+1)−wt(st)]这就是基于表格形式的TD算法。
Illustrative examples
考虑一个5×5的网格世界示例:
- 给定一个策略: π ( a ∣ s ) = 0.2 \pi(a|s)=0.2 π(a∣s)=0.2,对于任意的 s , a s,a s,a
- 我们的目标是基于该策略,估计state values(策略评估问题)
- 总计有25种state values。
- 设置
r
f
o
r
b
i
d
d
e
n
=
r
b
o
u
n
d
a
r
y
=
−
1
,
r
t
a
r
g
e
t
=
1
,
γ
=
0.9
r_{forbidden}=r_{boundary}=-1, r_{target}=1, \gamma=0.9
rforbidden=rboundary=−1,rtarget=1,γ=0.9

Ground truth:
- true state values和3D可视化

Experience samples:
- 500 episodes were generated following the given policy
- Each episode has 500 steps and starts from a randomly selected state-action pair following a uniform distribution。
为了对比,首先给出表格形式的TD算法(TD-Table)的结果:

那么看一下TD-Linear是否也能很好估计出来state value呢?
第一步就是要建立feature vector。要建立一个函数,这个函数也对应一个曲面,这个曲面能很好地拟合真实的state value对应的曲面。那么函数对应的曲面最简单的情况是什么呢?就是平面,所以这时候选择feature vector等于
ϕ
(
s
)
=
[
1
x
y
]
∈
R
3
\phi(s)=\begin{bmatrix}1 \\x \\y\end{bmatrix}\in \mathbb{R}^3
ϕ(s)=
1xy
∈R3在这种情况下,近似的state value是
v
^
(
s
,
w
)
=
ϕ
T
(
s
)
w
=
[
1
,
x
,
y
]
[
w
1
w
2
w
3
]
=
w
1
+
w
2
x
+
w
3
y
\hat{v}(s,w)=\phi^T(s)w=[1, x, y]\begin{bmatrix}w_1 \\w_2 \\w_3\end{bmatrix} =w_1+w_2x+w_3y
v^(s,w)=ϕT(s)w=[1,x,y]
w1w2w3
=w1+w2x+w3y注意,
ϕ
(
s
)
\phi(s)
ϕ(s)也可以定义为
ϕ
(
s
)
=
[
x
,
y
,
1
]
T
\phi(s)=[x, y, 1]^T
ϕ(s)=[x,y,1]T,其中这里边的顺序是不重要的。
将刚才的feature vector带入TD-Linear算法中,得到:

- 这里边的趋势是正确的,但是有一些错误,这是由于用平面拟合的本身方法的局限性。
- 我们尝试使用一个平面去近似一个非平面,这是非常困难的。
为了提高近似能力,可以使用high-order feature vectors,这样也就有更多的参数。
- 例如,我们考虑这样一个feature vector: ϕ ( s ) = [ 1 , x , y , x 2 , y 2 , x y ] T ∈ R 6 \phi(s)=[1, x, y, x^2, y^2, xy]^T\in \mathbb{R}^6 ϕ(s)=[1,x,y,x2,y2,xy]T∈R6在这种情况下,有 v ^ ( s , w ) = ϕ T ( s ) w = w 1 + w 2 x + w 3 y + w 4 x 2 + w 5 y 2 + w 6 x y \hat{v}(s,w)=\phi^T(s)w=w_1+w_2x+w_3y+w_4x^2+w_5y^2+w_6xy v^(s,w)=ϕT(s)w=w1+w2x+w3y+w4x2+w5y2+w6xy这对应一个quadratic surface。
- 可以进一步增加feature vector的维度 ϕ ( s ) = [ 1 , x , y , x 2 , y 2 , x y , x 3 , y 3 , x 2 y , x y 2 ] T ∈ R 1 0 \phi(s)=[1, x, y, x^2, y^2, xy, x^3, y^3, x^2y, xy^2]^T\in \mathbb{R}^10 ϕ(s)=[1,x,y,x2,y2,xy,x3,y3,x2y,xy2]T∈R10
通过higher-order feature vectors的TD-Linear算法的结果:

Summary of the story
1)首先从一个objective function出发
J
(
w
)
=
E
[
(
v
π
(
S
)
−
v
^
(
S
,
w
)
)
2
]
J(w)=\mathbb{E}[(v_\pi(S)-\hat{v}(S, w))^2]
J(w)=E[(vπ(S)−v^(S,w))2]这个目标函数表明这是一个policy evaluation问题.
2)然后对这个objective function进行优化,优化方法使用gradient-descent algorithm:
w
t
+
1
=
w
t
+
α
t
(
v
π
(
s
t
)
−
v
^
(
s
t
,
w
t
)
)
∇
w
v
^
(
s
t
,
w
t
)
w_{t+1}=w_t+\alpha_t (v_\pi(s_t)-\hat{v}(s_t,w_t))\nabla_w \hat{v}(s_t, w_t)
wt+1=wt+αt(vπ(st)−v^(st,wt))∇wv^(st,wt)但是问题是里边有一个
v
π
(
s
t
)
v_\pi(s_t)
vπ(st)是不知道的。
3)第三,使用一个近似替代算法中的true value function
v
π
(
s
t
)
v_\pi(s_t)
vπ(st),得到下面算法:
w
t
+
1
=
w
t
+
α
t
[
r
t
+
1
+
γ
v
^
(
s
t
+
1
,
w
t
)
−
v
^
(
s
t
,
w
t
)
]
∇
w
v
^
(
s
t
,
w
t
)
w_{t+1}=w_t+\alpha_t[r_{t+1}+\gamma \hat{v}(s_{t+1}, w_t)-\hat{v}(s_t,w_t)]\nabla_w \hat{v}(s_t, w_t)
wt+1=wt+αt[rt+1+γv^(st+1,wt)−v^(st,wt)]∇wv^(st,wt)
尽管上面的思路对于理解基本思想是非常有帮助的,但是它在数学上是不严谨的,因为做了替换操作。
Theoretical analysis
一个基本的结论,这个算法 w t + 1 = w t + α t [ r t + 1 + γ v ^ ( s t + 1 , w t ) − v ^ ( s t , w t ) ] ∇ w v ^ ( s t , w t ) w_{t+1}=w_t+\alpha_t[r_{t+1}+\gamma \hat{v}(s_{t+1}, w_t)-\hat{v}(s_t,w_t)]\nabla_w \hat{v}(s_t, w_t) wt+1=wt+αt[rt+1+γv^(st+1,wt)−v^(st,wt)]∇wv^(st,wt)不是去minimize下面的objective function: J ( w ) = E [ ( v π ( S ) − v ^ ( S , w ) ) 2 ] J(w)=\mathbb{E}[(v_\pi(S)-\hat{v}(S, w))^2] J(w)=E[(vπ(S)−v^(S,w))2]
实际上,有多种objective functions:
- Objective function 1:True value error J ( w ) = E [ ( v π ( S ) − v ^ ( S , w ) ) 2 ] = ∣ ∣ v ^ ( w ) − v π ∣ ∣ D 2 J(w)=\mathbb{E}[(v_\pi(S)-\hat{v}(S, w))^2]=||\hat{v}(w)-v_\pi||_D^2 J(w)=E[(vπ(S)−v^(S,w))2]=∣∣v^(w)−vπ∣∣D2
- Objective function 2:Bellman error J B E ( w ) = ∣ ∣ v ^ ( w ) − ( r π + γ P π v ^ ( w ) ) ∣ ∣ D 2 ≐ ∣ ∣ v ^ ( w ) − T π ( v ^ ( w ) ) ∣ ∣ D 2 J_{BE}(w)=||\hat{v}(w)-(r_\pi+\gamma P_{\pi}\hat{v}(w))||_D^2\doteq ||\hat{v}(w)-T_\pi(\hat{v}(w))||_D^2 JBE(w)=∣∣v^(w)−(rπ+γPπv^(w))∣∣D2≐∣∣v^(w)−Tπ(v^(w))∣∣D2其中 T π ( x ) ≐ r π + γ P π x T_\pi(x)\doteq r_\pi+\gamma P_\pi x Tπ(x)≐rπ+γPπx
- Objective function 2:Projected Bellman error J P B E ( w ) = ∣ ∣ v ^ ( w ) − M T π ( v ^ ( w ) ) ∣ ∣ D 2 J_{PBE}(w)=||\hat{v}(w)-MT_\pi(\hat{v}(w))||_D^2 JPBE(w)=∣∣v^(w)−MTπ(v^(w))∣∣D2其中 M M M是一个projection matrix(投影矩阵)
简而言之,上面提到的TD-Linear算法在最小化projected Bellman error。
Sarsa with function appriximation
到目前为止,我们仅仅是考虑state value estimation的问题,也就是我们希望 v ^ ≈ v π \hat{v}\approx v_\pi v^≈vπ。为了搜索最优策略,我们需要估计action values。
The Sarsa algorithm with value function approximation是:

这个上一节介绍的TD算法是一样的,只不过将
v
^
\hat{v}
v^换成了
q
^
\hat{q}
q^
为了寻找最优策略,我们将policy evaluation(上面算法做的事儿)和policy improvement结合。下面给出Sarsa with function approximation的伪代码:

举个例子:
- Sarsa with linear function approximation。
-
r
f
o
r
b
i
d
d
e
n
=
r
b
o
u
n
d
a
r
y
=
−
10
,
r
t
a
r
g
e
t
=
1
,
γ
=
0.9
,
α
=
0.001
,
ϵ
=
0.1
r_{forbidden}=r_{boundary}=-10, r_{target}=1, \gamma=0.9, \alpha=0.001, \epsilon=0.1
rforbidden=rboundary=−10,rtarget=1,γ=0.9,α=0.001,ϵ=0.1

Q-learning with function approximation
类似地,tabular Q-learning也可以扩展到value function approximation的情况。
The q-value更新规则是:

这与上面的Sarsa算法相同,除了
q
^
(
s
t
+
1
,
a
t
+
1
,
w
t
)
\hat{q}(s_{t+1}, a_{t+1}, w_t)
q^(st+1,at+1,wt)被替换为
max
a
∈
A
(
s
t
+
1
)
q
^
(
s
t
+
1
,
a
,
w
t
)
\max_{a\in \mathcal{A}(s_{t+1})}\hat{q}(s_{t+1}, a, w_t)
maxa∈A(st+1)q^(st+1,a,wt)。
Q-learning with function approximation伪代码(on-policy version):

举个例子:
- Q-learning with linear function approximation
-
r
f
o
r
b
i
d
d
e
n
=
r
b
o
u
n
d
a
r
y
=
−
10
,
r
t
a
r
g
e
t
=
1
,
γ
=
0.9
,
α
=
0.001
,
ϵ
=
0.1
r_{forbidden}=r_{boundary}=-10, r_{target}=1, \gamma=0.9, \alpha=0.001, \epsilon=0.1
rforbidden=rboundary=−10,rtarget=1,γ=0.9,α=0.001,ϵ=0.1

Deep Q-learning
Deep Q-learning算法又被称为deep Q-network (DQN):
- 最早的一个和最成功的一个将深度神经网络算法引入到强化学习中
- 神经网络的角色是一个非线性函数approximator
- 与下面的算法不同,是由于训练一个网络的方式:

Deep Q-learning旨在最小化目标函数/损失函数:

其中 ( S , A , R , S ′ ) (S,A,R,S') (S,A,R,S′)是随机变量。

那么如何最小化目标函数呢?使用Gradient-descent!但是如何计算目标函数的梯度还是有一些tricky。这是因为在目标函数中有两个位置有 w w w:

也就是说参数w不仅仅只出现在 q ^ ( S , A , w ) \hat{q}(S,A,w) q^(S,A,w)中,还出现在它的前面。这里用 y y y表示: y ≐ R + γ max a ∈ A ( S ′ ) q ^ ( S ′ , a , w ) y\doteq R+\gamma \max_{a\in \mathcal{A}(S')} \hat{q}(S',a,w) y≐R+γa∈A(S′)maxq^(S′,a,w)
为了简单起见,我们可以假设 w w w在 y y y中是固定的(至少一定时间内),当我们计算梯度的时候。为了这样做,我们引入两个network。
- 一个是main network,用以表示 q ^ ( s , a , w ) \hat{q}(s,a,w) q^(s,a,w)
- 另一个是target network q ^ ( s , a , w T ) \hat{q}(s,a,w_T) q^(s,a,wT)
用这两个network吧上面目标函数中的两个
q
^
\hat{q}
q^区分开来,就得到了如下式子:

其中
w
T
w_T
wT是target network parameter。
当
w
T
w_T
wT是固定的,可以计算出来
J
J
J的梯度如下:

- 这就是Deep Q-learning的基本思想,使用gradient-descent算法最小化目标函数。
- 然而,这样的优化过程涉及许多重要的技巧。
第一个技巧:使用了两个网络,一个是main network,另一个是target network。
为什么要使用两个网络呢?在数学上来说因为计算梯度的时候会非常的复杂,所以先去固定一个,然后再去计算另一个,这样就需要两个网络来实现。
具体实现的细节:
- 令 w w w和 w T w_T wT分别表示mean network和target network的参数,它们初始化的时候是一样的。
- 在每个iteration中,从
replay buffer中draw一个mini-batch样本 { ( s , a , r , s ′ ) } \{(s,a,r,s')\} {(s,a,r,s′)} - 网络的输入包括state s s s和action a a a,目标输出是 y T ≐ r + γ max a ∈ A ( s ′ ) q ^ ( s ′ , a , w T ) y_T\doteq r+\gamma \max_{a\in \mathcal{A}(s')} \hat{q}(s',a,w_T) yT≐r+γmaxa∈A(s′)q^(s′,a,wT)。然后我们直接基于the mini-batch { ( s , a , r , s ′ ) } \{(s,a,r,s')\} {(s,a,r,s′)}最小化TD error或者称为loss function ( y T − q ^ ( s , a , w ) ) 2 (y_T-\hat{q}(s,a,w))^2 (yT−q^(s,a,w))2。这样一段时间后,参数w发生变化,再将其赋给 w T w_T wT,再用来训练 w w w。
另一个技巧:Experience replay(经验回放)
问题:什么是Experience replay?
回答:
- 我们收集一些experience samples之后,we do NOT use these samples in the order they were collected。
- Instead,我们将它们存储在一个set中,称为replay buffer B ≐ { ( s , a , r , s ′ ) } \mathcal{B}\doteq \{(s, a, r, s')\} B≐{(s,a,r,s′)}
- 每次我们训练neural network,我们可以从replay buffer中draw a mini-batch的random samples
- 取出的samples,称为experience replay,应当按照一个均匀分布的方式,即每个experience被replay的机会是相等的。
问题:为什么在deep Q-learning中要用experience replay?为什么replay必须要按照一个uniform distribution的方式?
回答:这个回答依赖于下面的objective function

- ( S , A ) ∼ d (S,A)\sim d (S,A)∼d: ( S , A ) (S,A) (S,A)是一个索引,并将其视为一个single random variable。
- R ∼ p ( R ∣ S , A ) , S ′ ∼ p ( S ′ ∣ S , A ) R\sim p(R|S,A), S'\sim p(S'|S,A) R∼p(R∣S,A),S′∼p(S′∣S,A): R R R和 S S S由system model确定
- state-action pair ( S , A ) (S,A) (S,A)的分布假定是uniform.
- 然而,样本采集不是按照均匀分布来的,因为它们是由某个policies按顺序生成的。
- 为了打破顺序采样样本的关联,我们才从replay buffer中按照uniformly方式drawing samples,也就是experience replay technique
- 这是在数学上为什么experience replay是必须的,以及为什么experience replay必须是uniform的原因。
回顾tabular的情况:
- 问题1:为什么tabular Q-learning没有要求experience replay?
- 回答:没有uniform distribution的需要
- 问题2:为什么Deep Q-learning 涉及distribution?
- 回答:因为在deep Q-learning的情况下,目标函数是一个在所有 ( S , A ) (S,A) (S,A)之上的scale average。tabular case没有涉及 S S S或者 A A A的任何distribution。在tabular情况下算法旨在求解对于所有的 ( s , a ) (s,a) (s,a)的一组方程(Bellman optimality equation)。
- 问题3:可以在tabular Q-learning中使用experience replay吗?
- 回答:可以,而且还会让sample更加高效,因为同一个sample可以用多次。
再次给出Deep Q-learning的伪代码(off-policy version):

需要澄清的几个问题:
- 为什么没有策略更新?因为这里是off-policy
- 为什么没有使用之前导出的梯度去更新策略?因为之前导出梯度的算法比较底层,它可以指导我们去生成现在的算法,但是要遵循神经网络批量训练的黑盒特性,然后更好地高效地训练神经网络
- 这里网络的input和output与DQN原文中的不一样。原文中是on-policy的,这里是off-policy的。
举个例子:目标是learn optimal action values for every state-action pair。一旦得到最优策略,最优greedy策略可以立即得到。
问题设置:

仿真结果:

如果我们仅仅使用100步的一个single episode将会发生什么?也就是数据不充分的情况
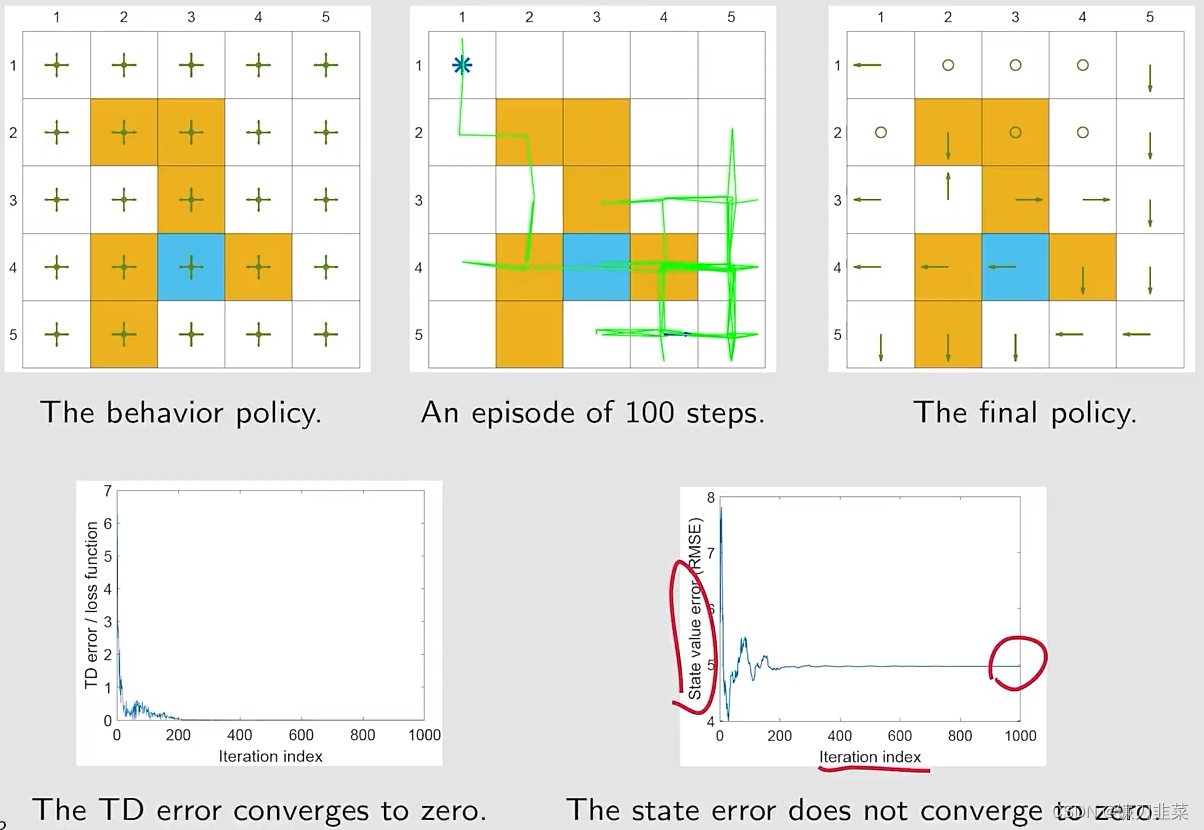
可以看出,好的算法是需要充分的数据才能体现效果的。
内容来源
- 《强化学习的数学原理》 西湖大学工学院赵世钰教授 主讲
- 《动手学强化学习》 俞勇 著


