目录
- 0 专栏介绍
- 1 Rviz可视化
- 2 环境配置
- 3 使用方法
- 4 测试用例
0 专栏介绍
本专栏旨在通过对ROS的系统学习,掌握ROS底层基本分布式原理,并具有机器人建模和应用ROS进行实际项目的开发和调试的工程能力。
🚀详情:《ROS从入门到精通》
1 Rviz可视化
ROS提供了三维可视化工具Rviz,用于可视化传感器的数据和状态信息。在Rviz中可以通过图形化的方式,实时显示机器人传感器的信息、机器人的运动状态、周围环境的变化等。
Rviz的基础操作详见:
- ROS从入门到精通2-1:机器人3D可视化工具——Rviz
- ROS从入门到精通2-4:Rviz插件制作实战案例(以多点连续导航插件为例)
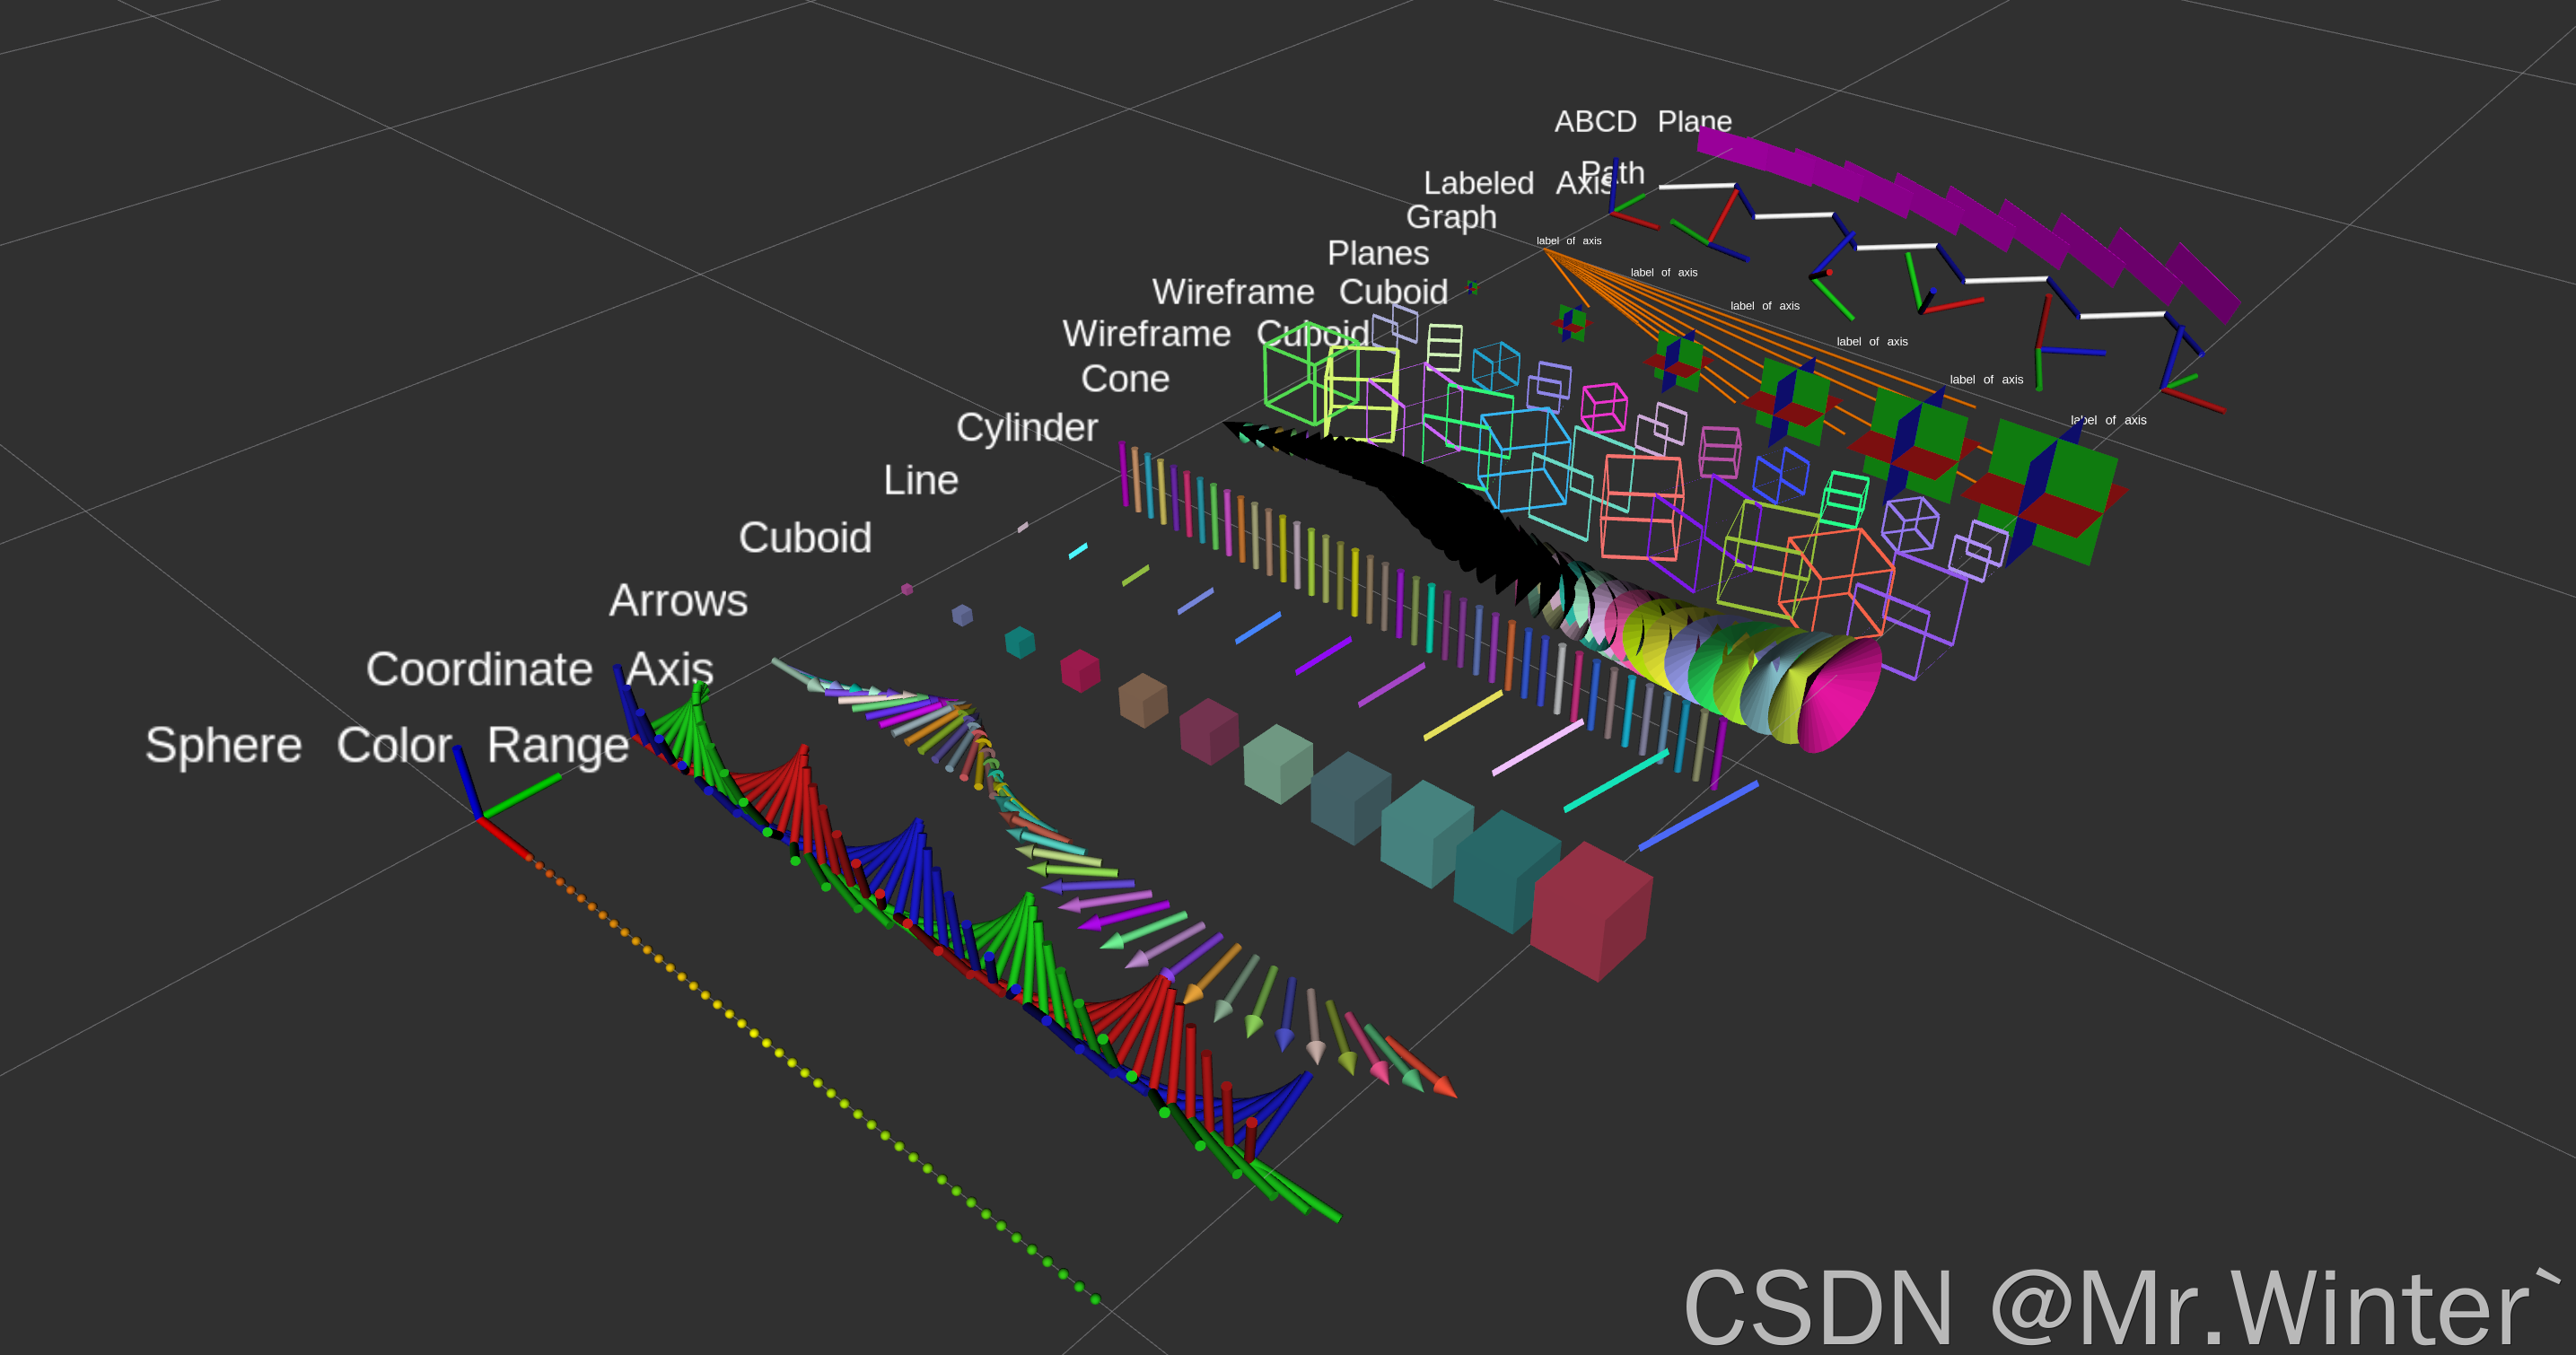
本文介绍Rviz的进阶使用,效果如下所示,可以实现坐标轴、坐标系、直线、平面、点列、圆柱等多种Marker的可视化。
2 环境配置
下载可视化库
git clone https://github.com/PickNikRobotics/rviz_visual_tools
初次编译可能会遇到以下问题
-
-- Could NOT find eigen_stl_containers (missing: eigen_stl_containers_DIR) -- Could not find the required component 'eigen_stl_containers'. The following CMake error indicates that you either need to install the package with the same name or change your environment so that it can be found.解决方案:
git clone https://github.com/AcutronicRobotics/eigen_stl_containers -
-- Could NOT find graph_msgs (missing: graph_msgs_DIR) -- Could not find the required component 'graph_msgs'. The following CMake error indicates that you either need to install the package with the same name or change your environment so that it can be found.解决方案:
sudo apt-get install ros-noetic-graph-msgs
最后一起编译即可
catkin_make
3 使用方法
rviz_visual_tools提供了很多方便的可视化API
- publishSphere
- publishSpheres
- publishArrow/publishXArrow
- publishYArrow
- publishZArrow
- publishCuboid
- publishCone
- publishXYPlane
- publishXZPlane
- publishYZPlane
- publishLine
- publishPath
- publishPolygon
- publishBlock
- publishWireframeCuboid
- publishWireframeRectangle
- publishAxis
- publishAxisLabeled
- publishCylinder
- publishMesh
- publishText
- publishTest
rviz_visual_tools提供了下述可选的颜色
- BLACK,
- BLUE,
- BROWN,
- CYAN,
- DARK_GREY,
- GREEN,
- GREY,
- LIME_GREEN,
- MAGENTA,
- ORANGE,
- PINK,
- PURPLE,
- RED,
- WHITE,
- YELLOW,
- TRANSLUCENT_LIGHT,
- TRANSLUCENT,
- TRANSLUCENT_DARK,
- RAND,
- CLEAR,
- DEFAULT
以及下述大小
- XXXXSMALL,
- XXXSMALL,
- XXSMALL,
- XSMALL,
- SMALL,
- MEDIUM,
- LARGE,
- XLARGE,
- XXLARGE,
- XXXLARGE,
- XXXXLARGE,
4 测试用例
比如要可视化一个三维位姿
#include <rviz_visual_tools/rviz_visual_tools.h>

// For visualizing things in rviz
rviz_visual_tools::RvizVisualToolsPtr visual_tools_;

// Change the first parameter to the name of your robot's base frame,
// and the second parameter to whatever name you'd like to use for the corresponding Rviz marker ROS topic.
visual_tools_.reset(new rviz_visual_tools::RvizVisualTools("base_frame","/rviz_visual_markers"));

// Create pose
Eigen::Isometry3d pose;
pose = Eigen::AngleAxisd(M_PI/4, Eigen::Vector3d::UnitY()); // rotate along X axis by 45 degrees
pose.translation() = Eigen::Vector3d( 0.1, 0.1, 0.1 ); // translate x,y,z

// Publish arrow vector of pose
ROS_INFO_STREAM_NAMED("test","Publishing Arrow");
visual_tools_->publishArrow(pose, rviz_visual_tools::RED, rviz_visual_tools::LARGE);

// publish
visual_tools_->trigger();
本文的完整工程代码联系下方博主名片获取
🔥 更多精彩专栏:
- 《ROS从入门到精通》
- 《Pytorch深度学习实战》
- 《机器学习强基计划》
- 《运动规划实战精讲》
- …

