Prometheus离线tar包安装
实验环境
一、部署前操作
二、Master
2.1下载
2.2解压
2.3更改服务目录名称
2.4创建系统服务启动文件
2.5配置修改
2.6启动并设置开机自启
2.7访问
2.8添加node节点
2.8.1 添加方法
2.8.2修改Prometheus配置(Master)
————————————————
实验环境
节点 | ip | cpu | 内存 | 磁盘 | 操作系统 |
Master | 192.168.3.233 | 2c | 4G | 50G | Centos7.9 |
node | 192.168.3.236 | 2c | 4G | 50G | Centos7.9 |
一、部署前操作
#1.关闭防火墙
systemctl stop firewalld
setenforce 0
二、Master 安装和配置
2.1下载
wget https://dl.grafana.com/oss/release/grafana-9.0.7.linux-amd64.tar.gz
wget https://github.com/prometheus/prometheus/releases/download/v2.38.0-rc.0/prometheus-2.38.0-rc.0.linux-amd64.tar.gz
wget https://github.com/prometheus/node_exporter/releases/download/v1.4.0-rc.0/node_exporter-1.4.0-rc.0.linux-amd64.tar.gz
2.2解压
tar xf grafana-9.0.7.linux-amd64.tar.gz -C /home
tar xf prometheus-2.38.0-rc.0.linux-amd64.tar.gz -C /home
tar xf node_exporter-1.4.0-rc.0.linux-amd64.tar.gz -C /home
2.3更改服务目录名称
cd /home
mv grafana-9.0.7 grafana
mv prometheus-2.38.0-rc.0.linux-amd64 prometheus
mv node_exporter-1.4.0-rc.0.linux-amd64 node_exporter
2.4创建系统服务启动文件
#2.4.1.grafana
vim /usr/lib/systemd/system/grafana.service
[Unit]
Description=grafana
After=network.target
[Service]
WorkingDirectory=/home/grafana
ExecStart=/home/grafana/bin/grafana-server
[Install]
WantedBy=multi-user.target
#2.4.2.prometheus
vim /usr/lib/systemd/system/prometheus.service
[Unit]
Description=prometheus
After=network.target
[Service]
User=prometheus
Group=prometheus
WorkingDirectory=/home/prometheus
ExecStart=/home/prometheus/prometheus
[Install]
WantedBy=multi-user.target
#2.4.3.node_exporter
vim /usr/lib/systemd/system/node_exporter.service
[Unit]
Description=node_exporter
After=network.target
[Service]
Type=simple
User=root
ExecStart=/home/node_exporter/node_exporter --web.config=/home/node_exporter/config.yml
Restart=on-failure
[Install]
WantedBy=multi-user.target
2.5配置修改
#2.5.1 prometheus
#创建prometheus用户设置不可登陆服务器
useradd -s /sbin/nologin -M prometheus
#授权目录属主属组
chown -R prometheus:prometheus /home/prometheus
vim /home/prometheus/prometheus.yml
scrape_configs:
# The job name is added as a label `job=<job_name>` to any timeseries scraped from this config.
- job_name: "prometheus"
# metrics_path defaults to '/metrics'
# scheme defaults to 'http'.
basic_auth: #访问9100开启用户登录
username: prometheus
password: 123456
static_configs:
- targets: ["192.168.3.233:9090","192.168.3.233:9100"]
#9090端口是prometheus服务,9100端口是node_exporter服务
#2.5.2 node_exporter
vim /home/node_exporter/config.yml
basic_auth_users:
#用户为prometheus,密码为123456
prometheus: $2y$20$wopw/vyuwARPSU5Qu29Zy.1oda9gs1QhHfpNCWliqpWcAYhRysgqy
#这个密码可以使用htpasswd -nBC 20 '' |tr -d '\:n'这条命令去生成,该命令由httpd-tools这个包提供。
2.6启动并设置开机自启
#2.6.1grafana
systemctl daemon-reload && systemctl restart grafana && systemctl enable grafana
#2.6.2 prometheus
systemctl daemon-reload && systemctl restart prometheus && systemctl enable prometheus
#2.6.3 node_exporter
systemctl daemon-reload && systemctl restart node_exporter && systemctl enable node_exporter
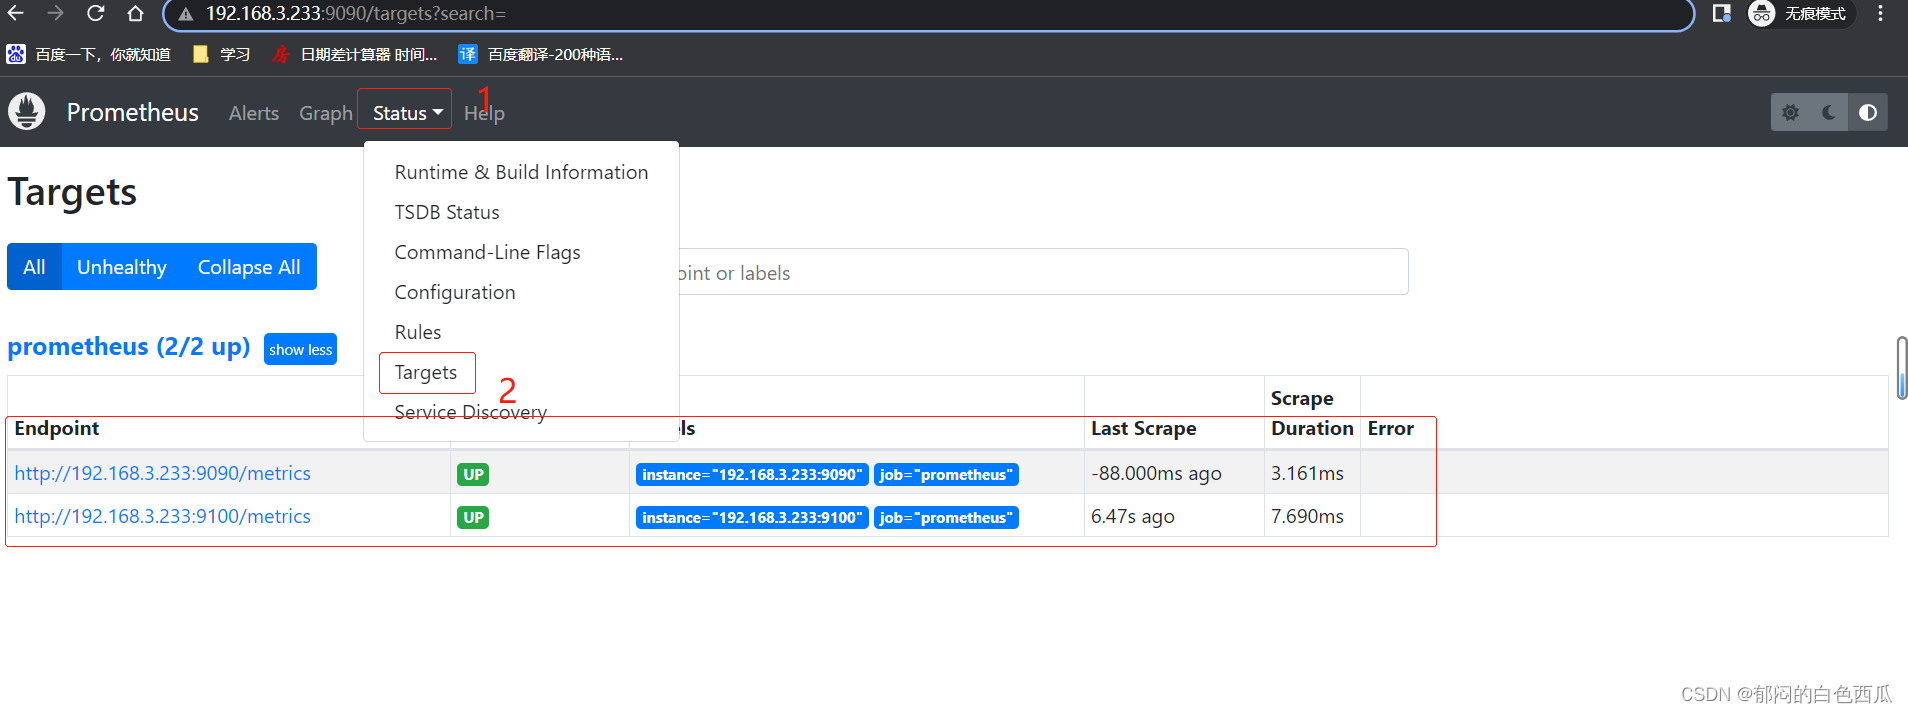
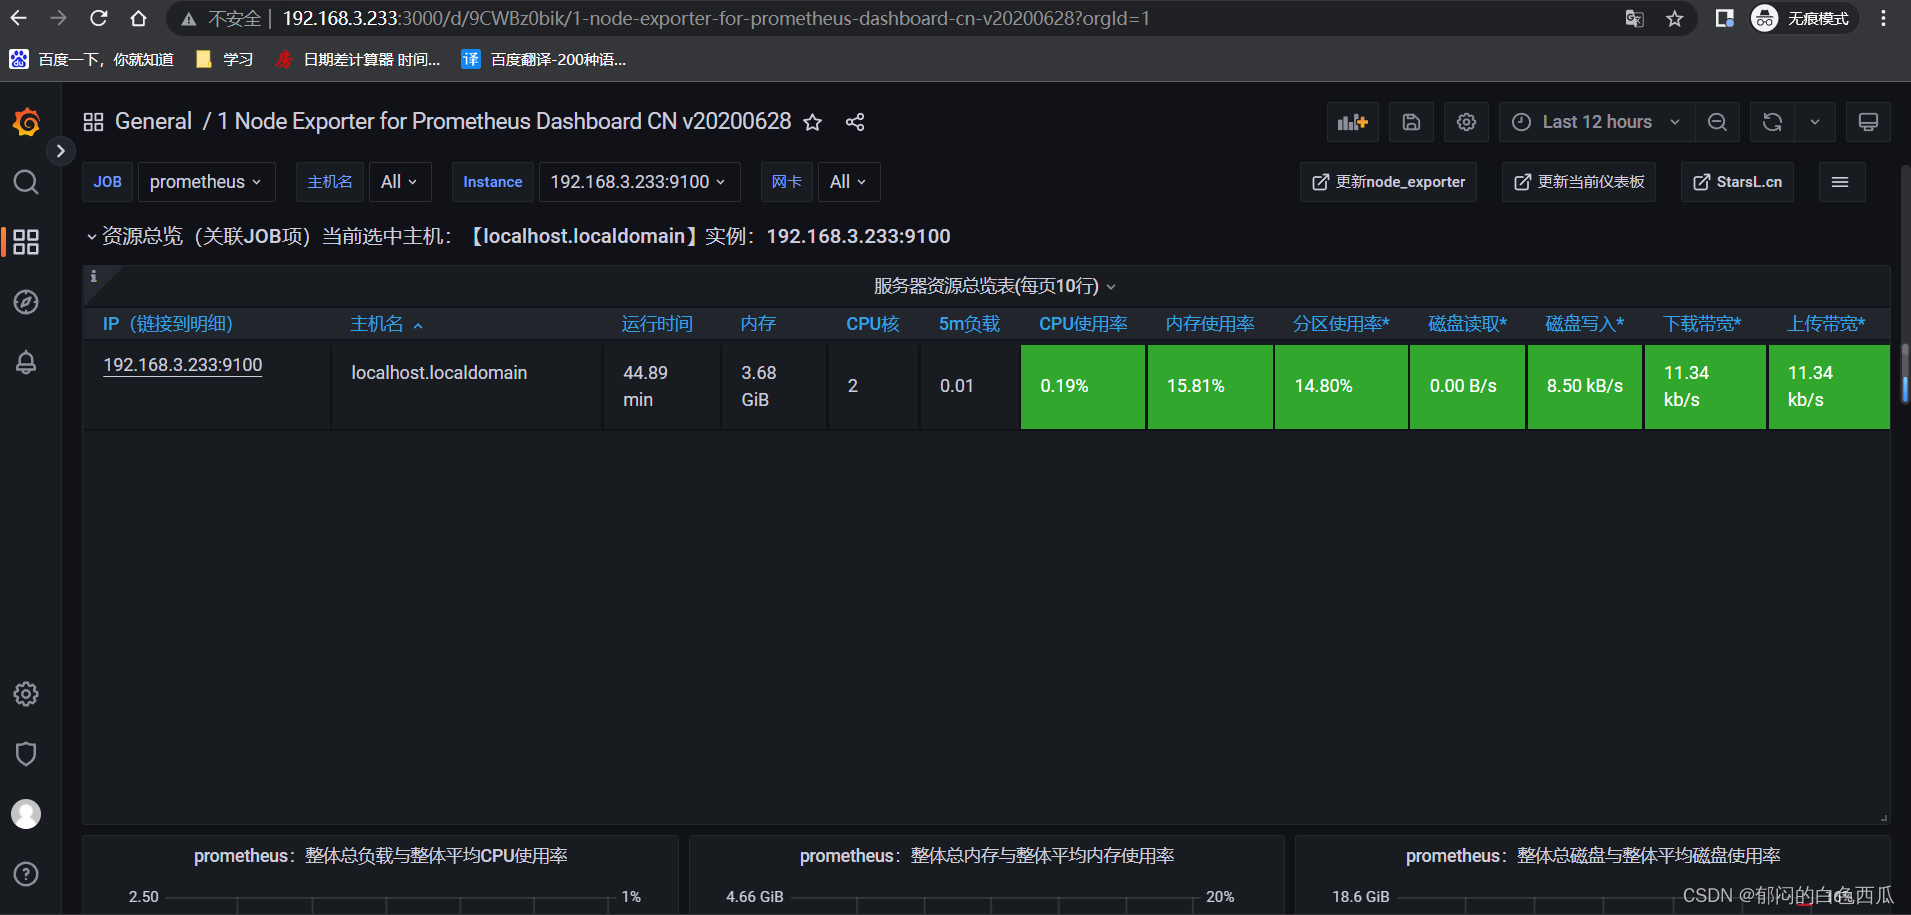
2.7访问
#浏览器访问
#9090为prometheus服务可查看node注册信息
192.168.3.233:9090
#3000为grafana服务也是可视化web页面
192.168.3.233:3000
默认用户密码
admin
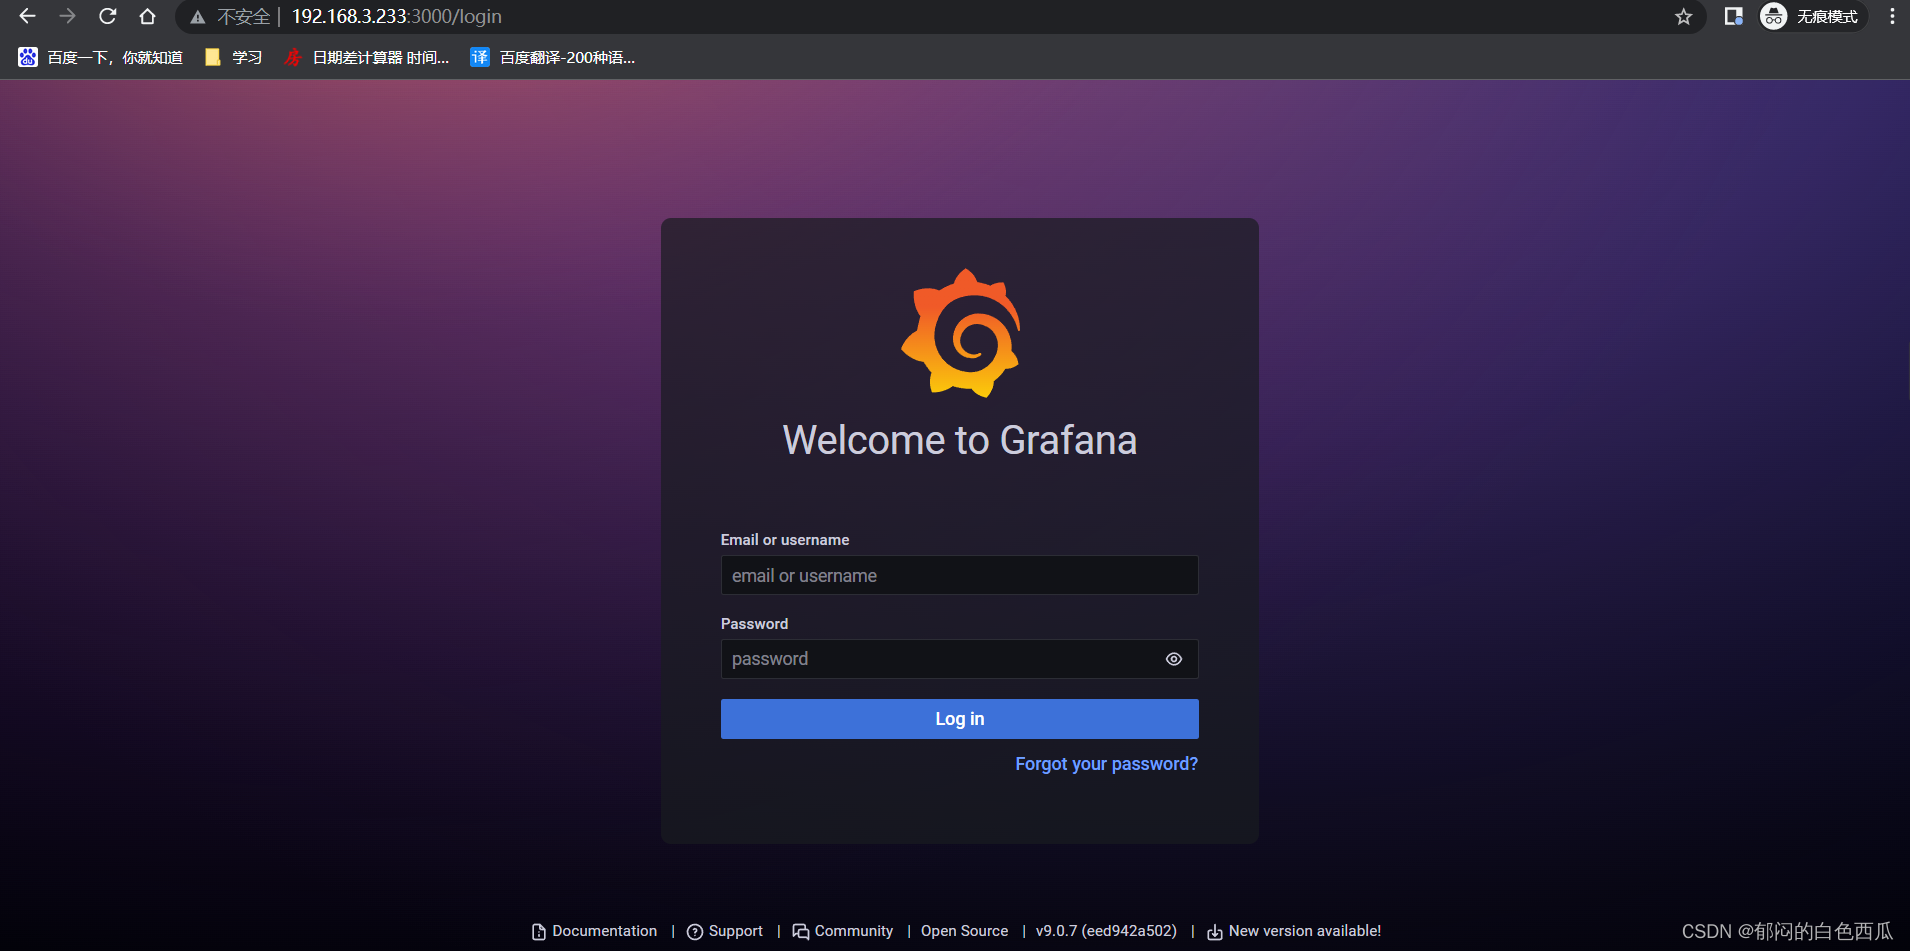
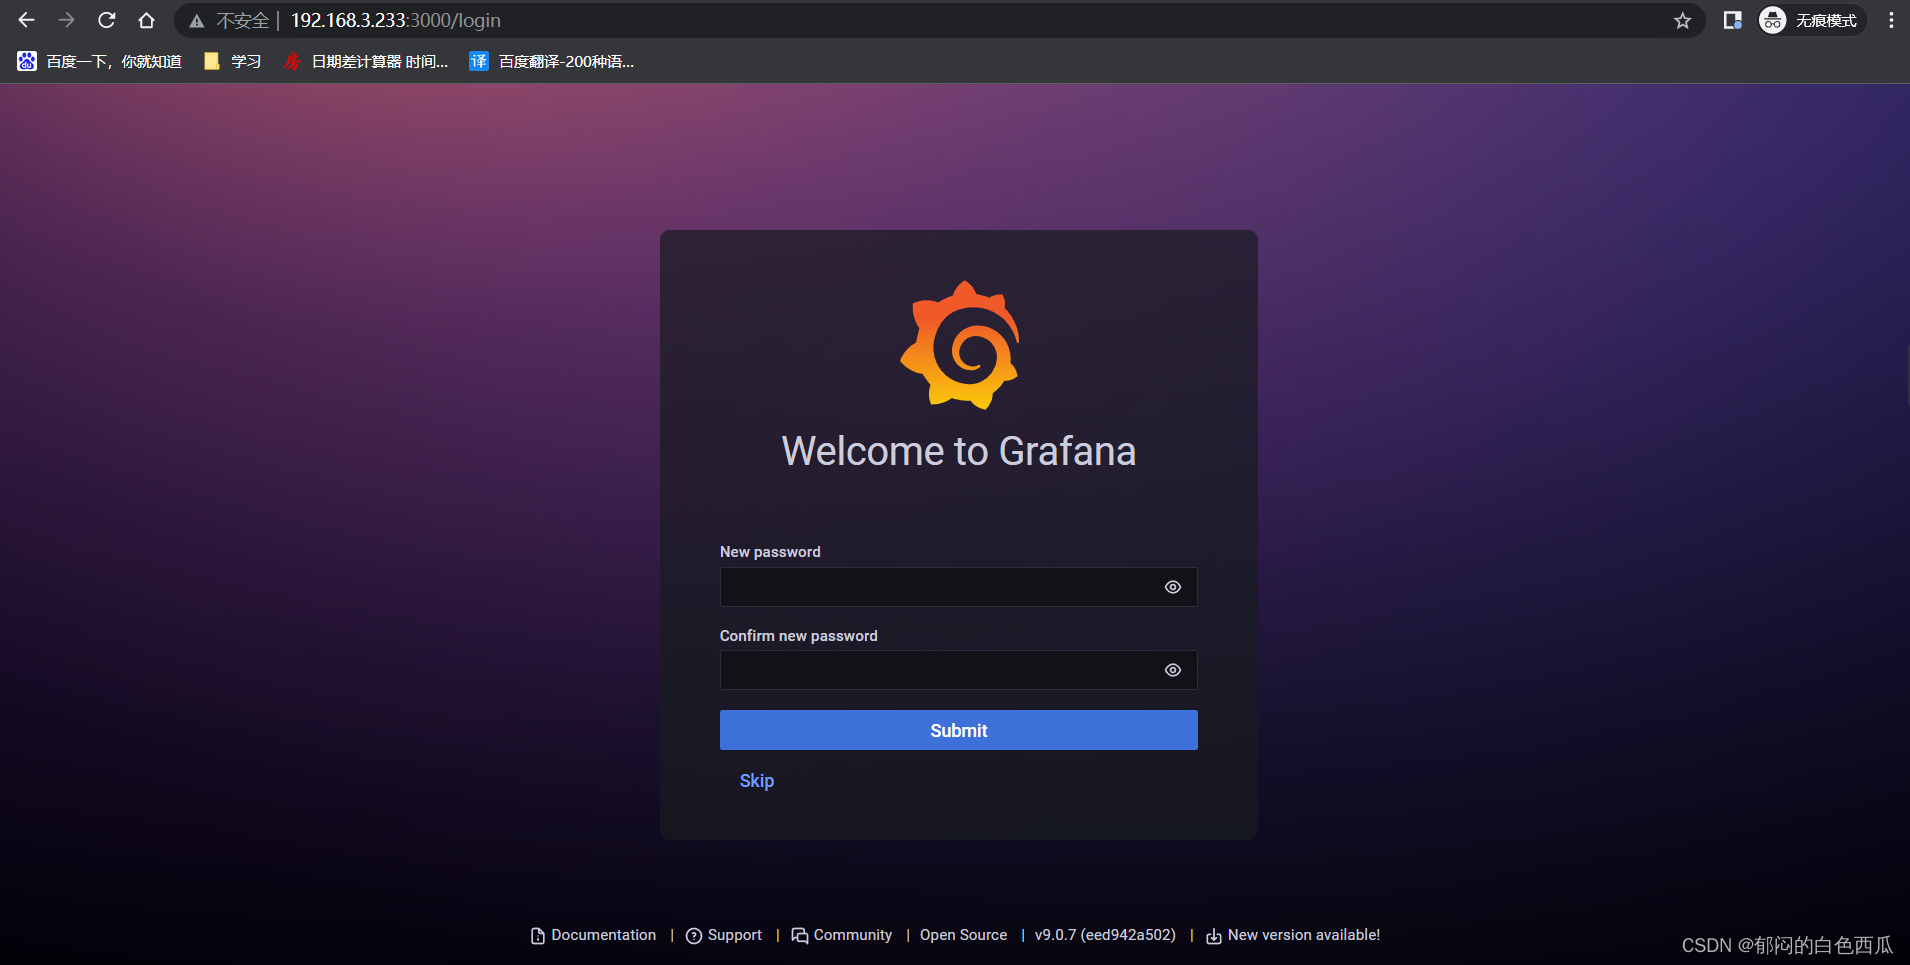
第一次登陆提示修改密码,不想修改可以点击Skip跳过
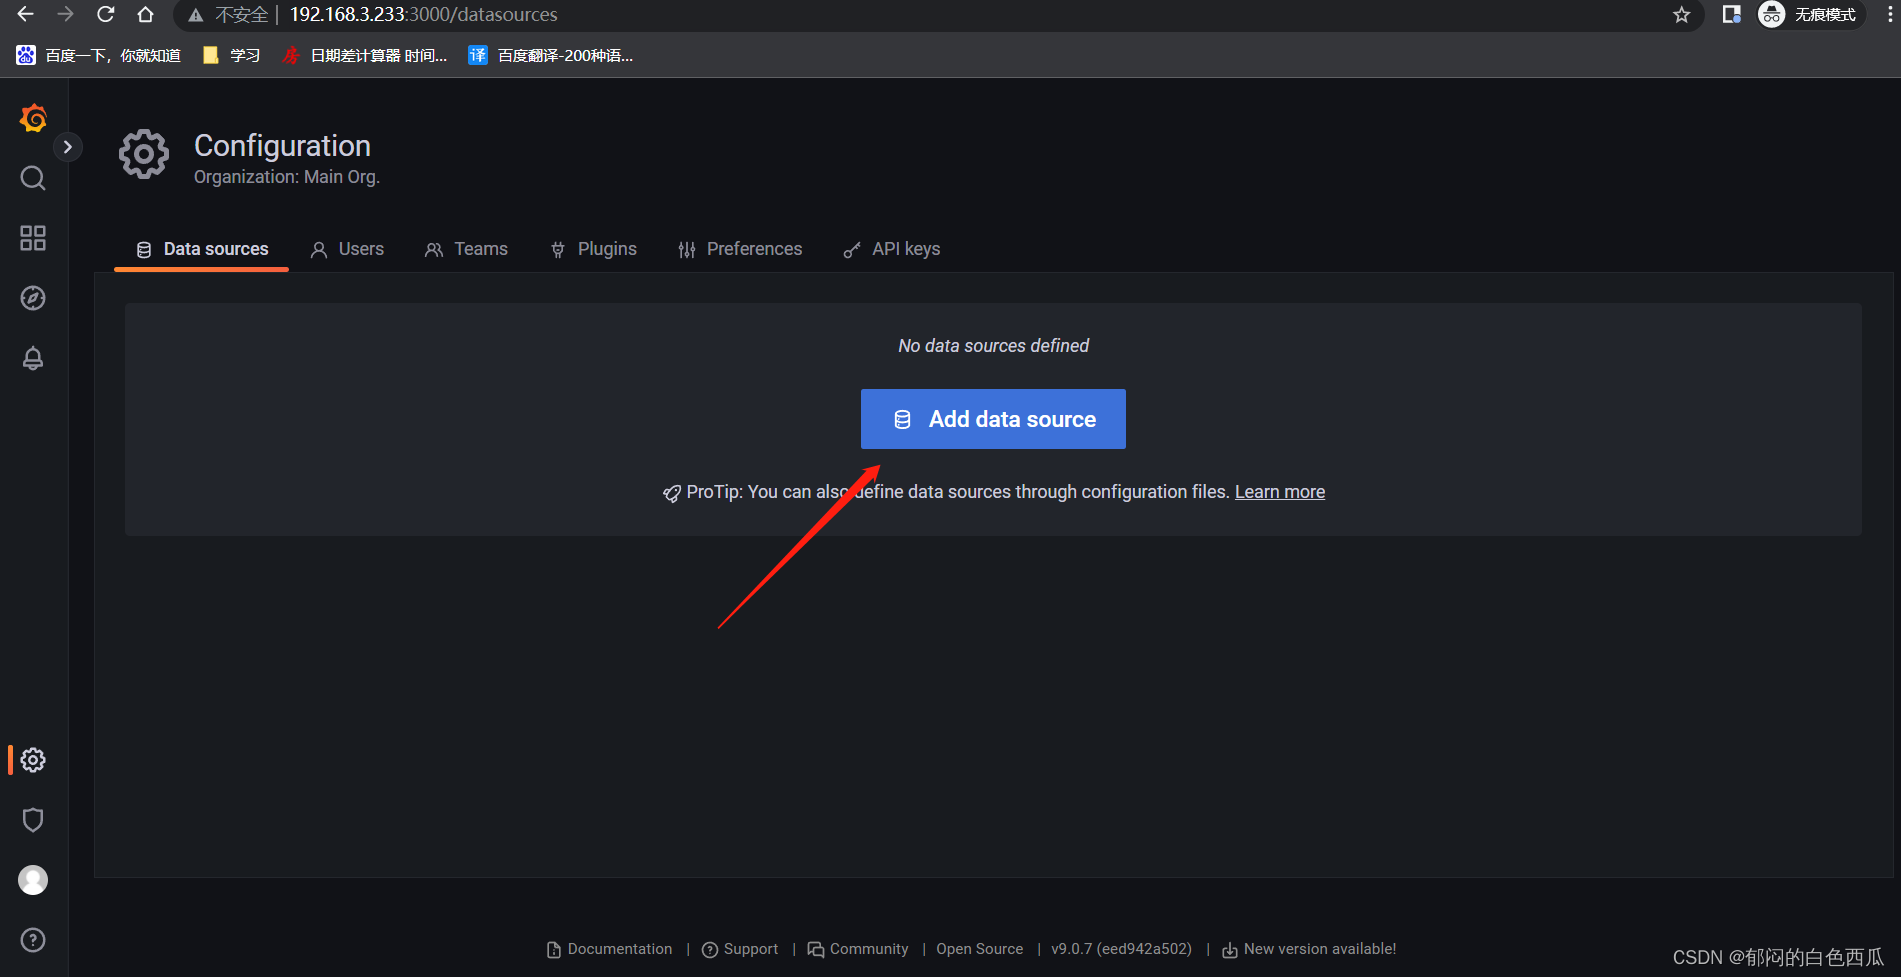
配置prometheus数据源
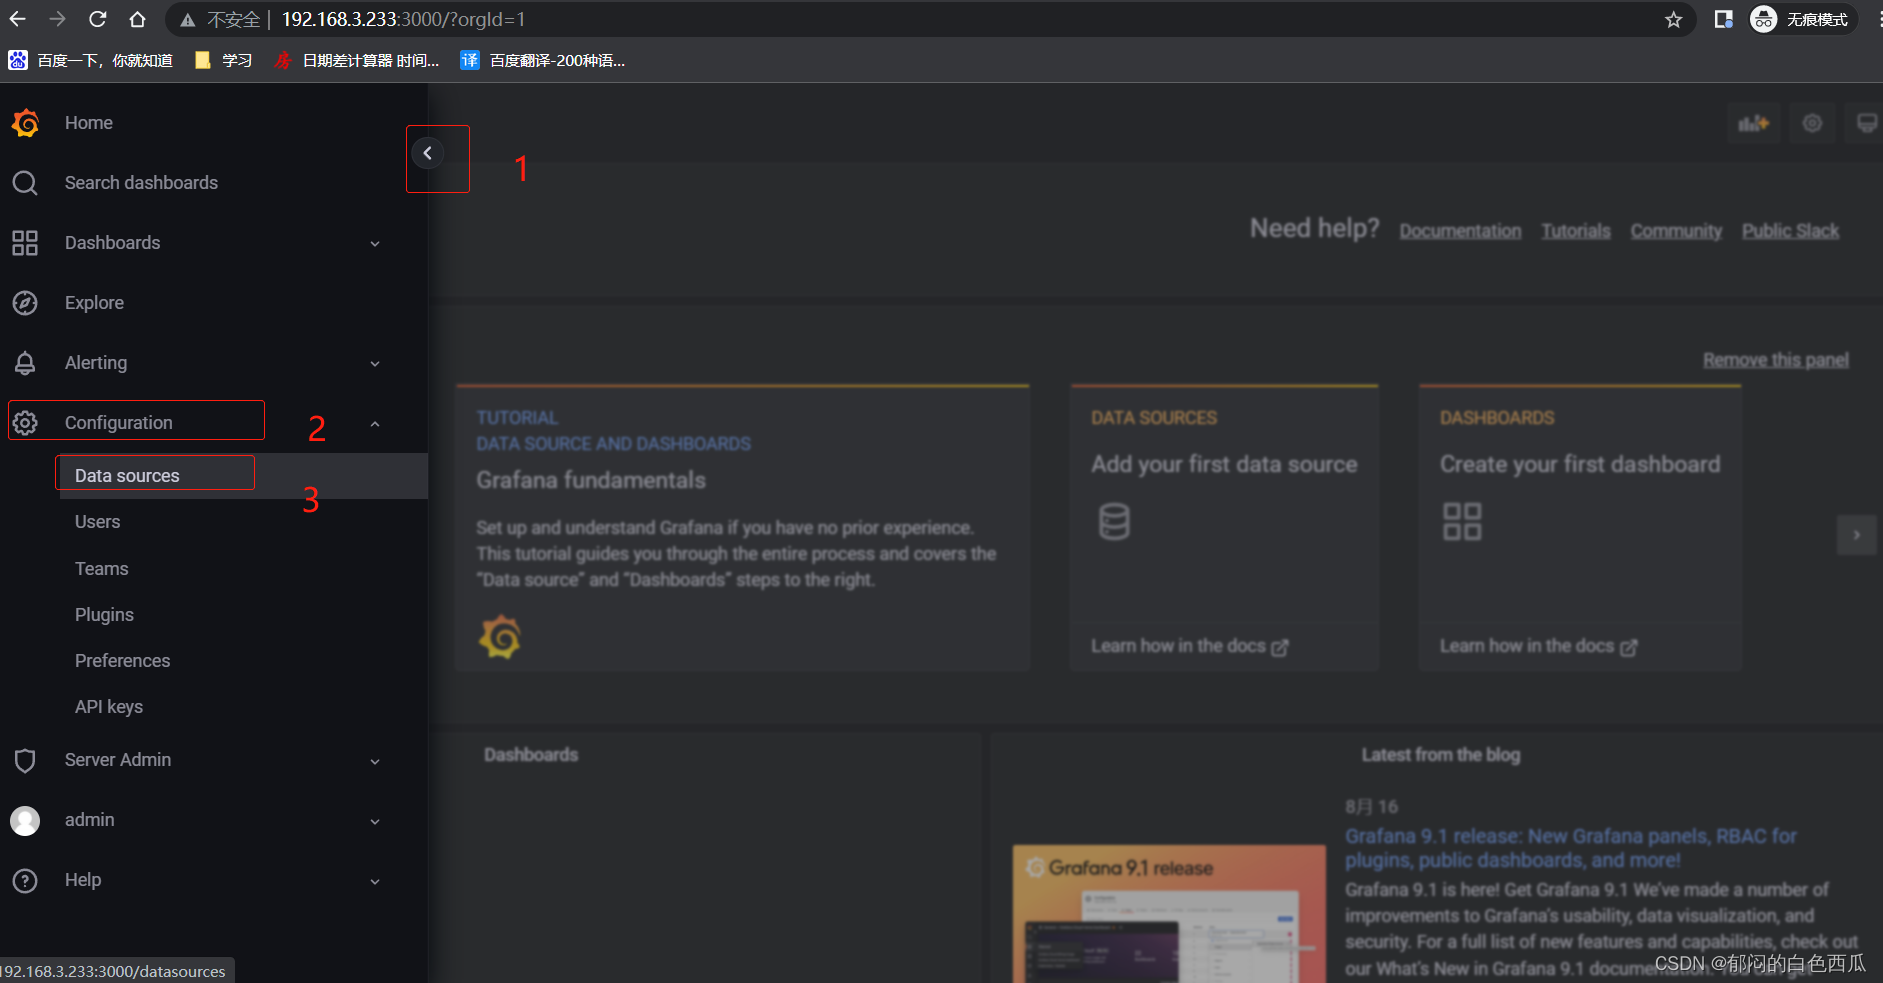
新增加数据源
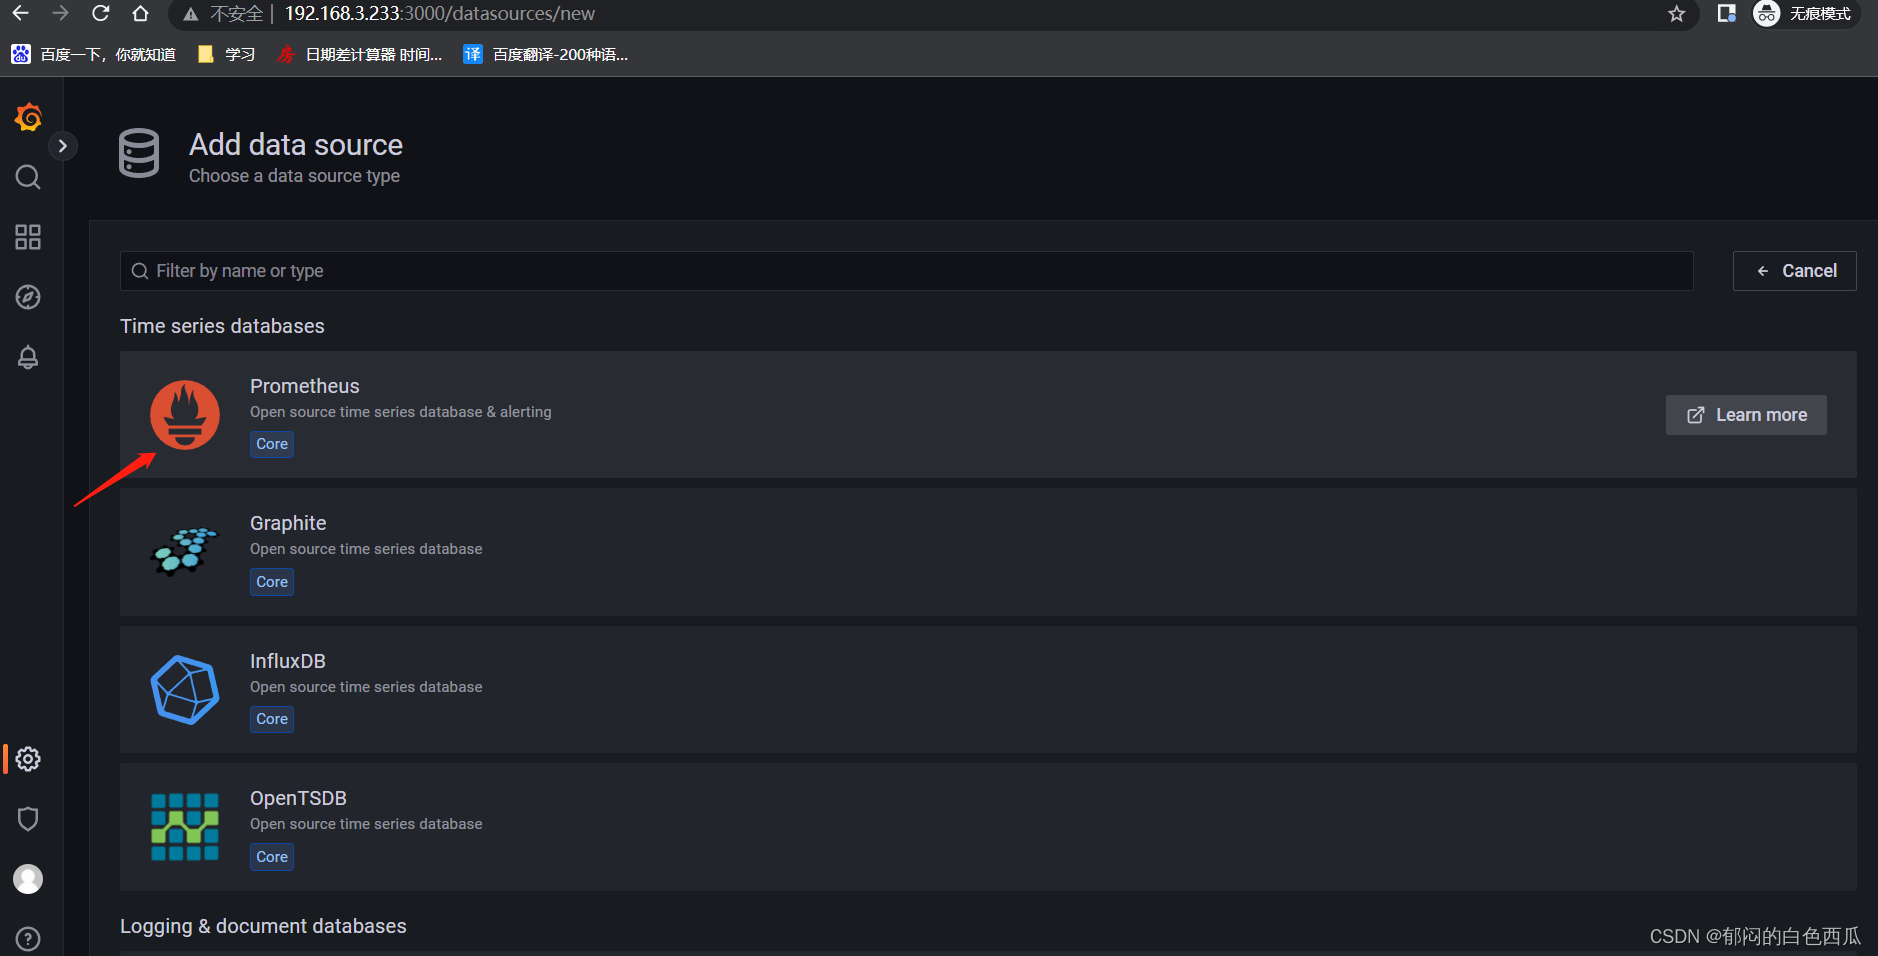
点击Prometheus
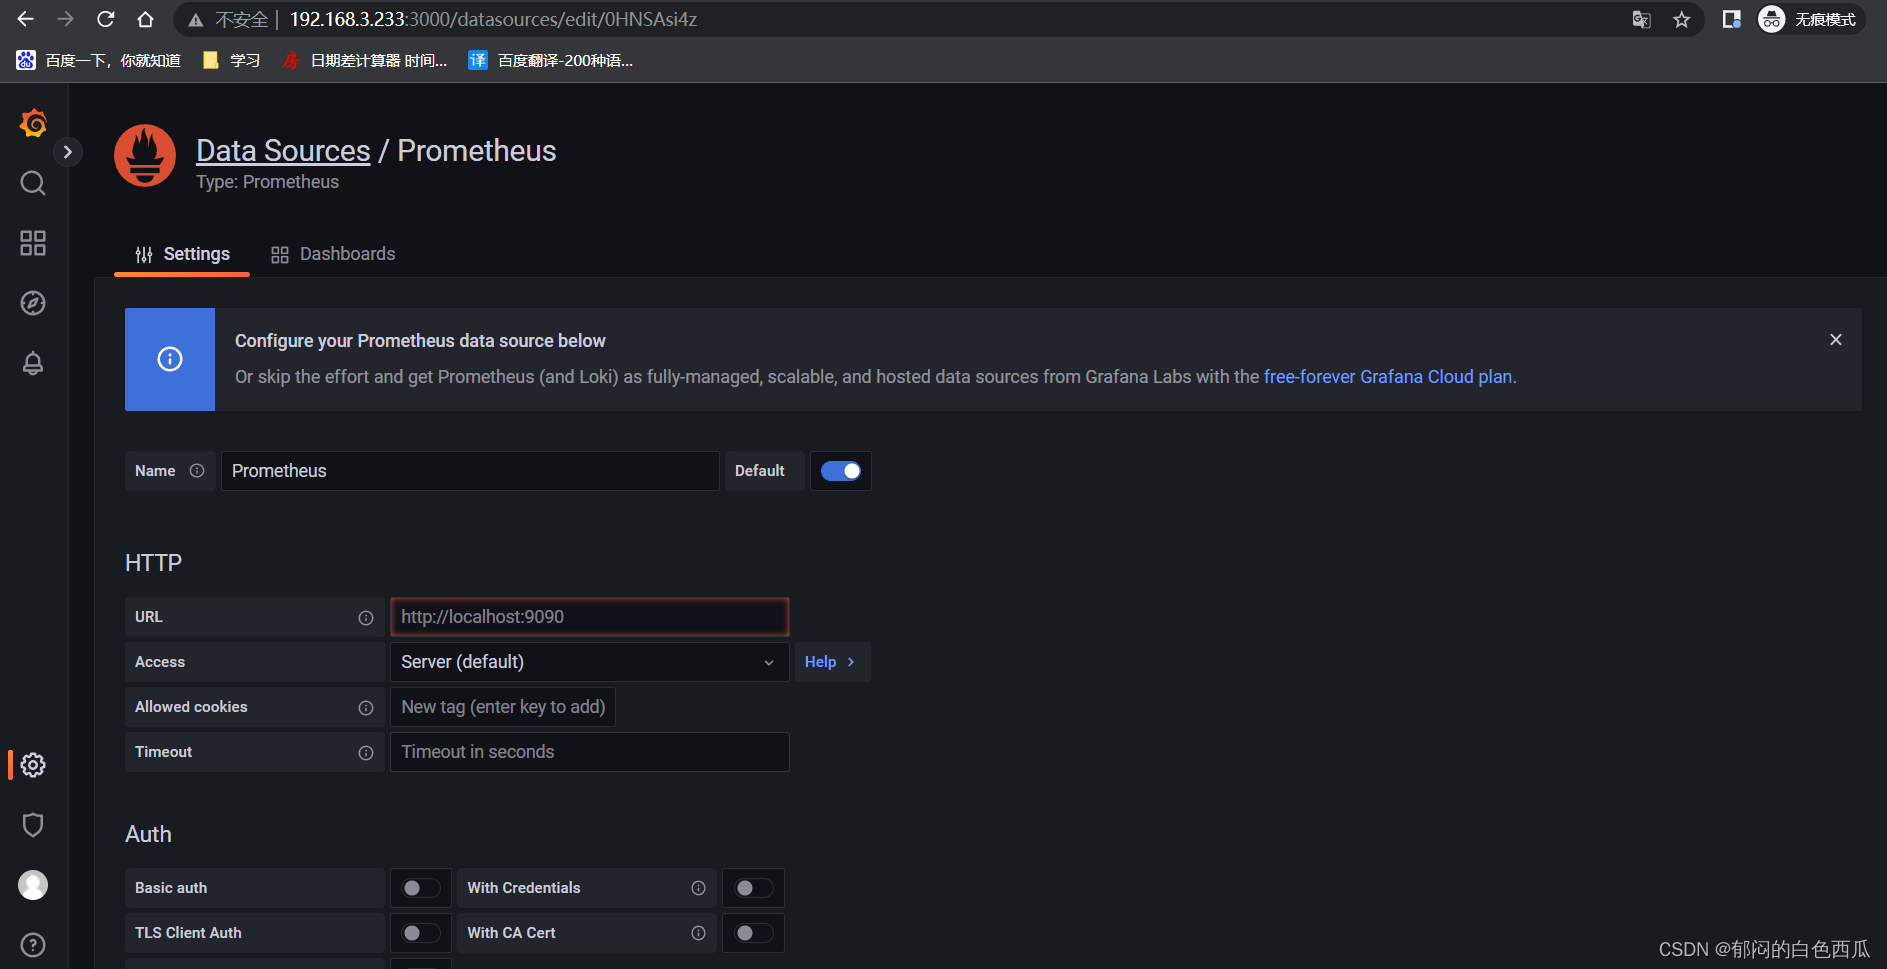
添加Prometheus信息
URL:http://192.168.3.233:9090
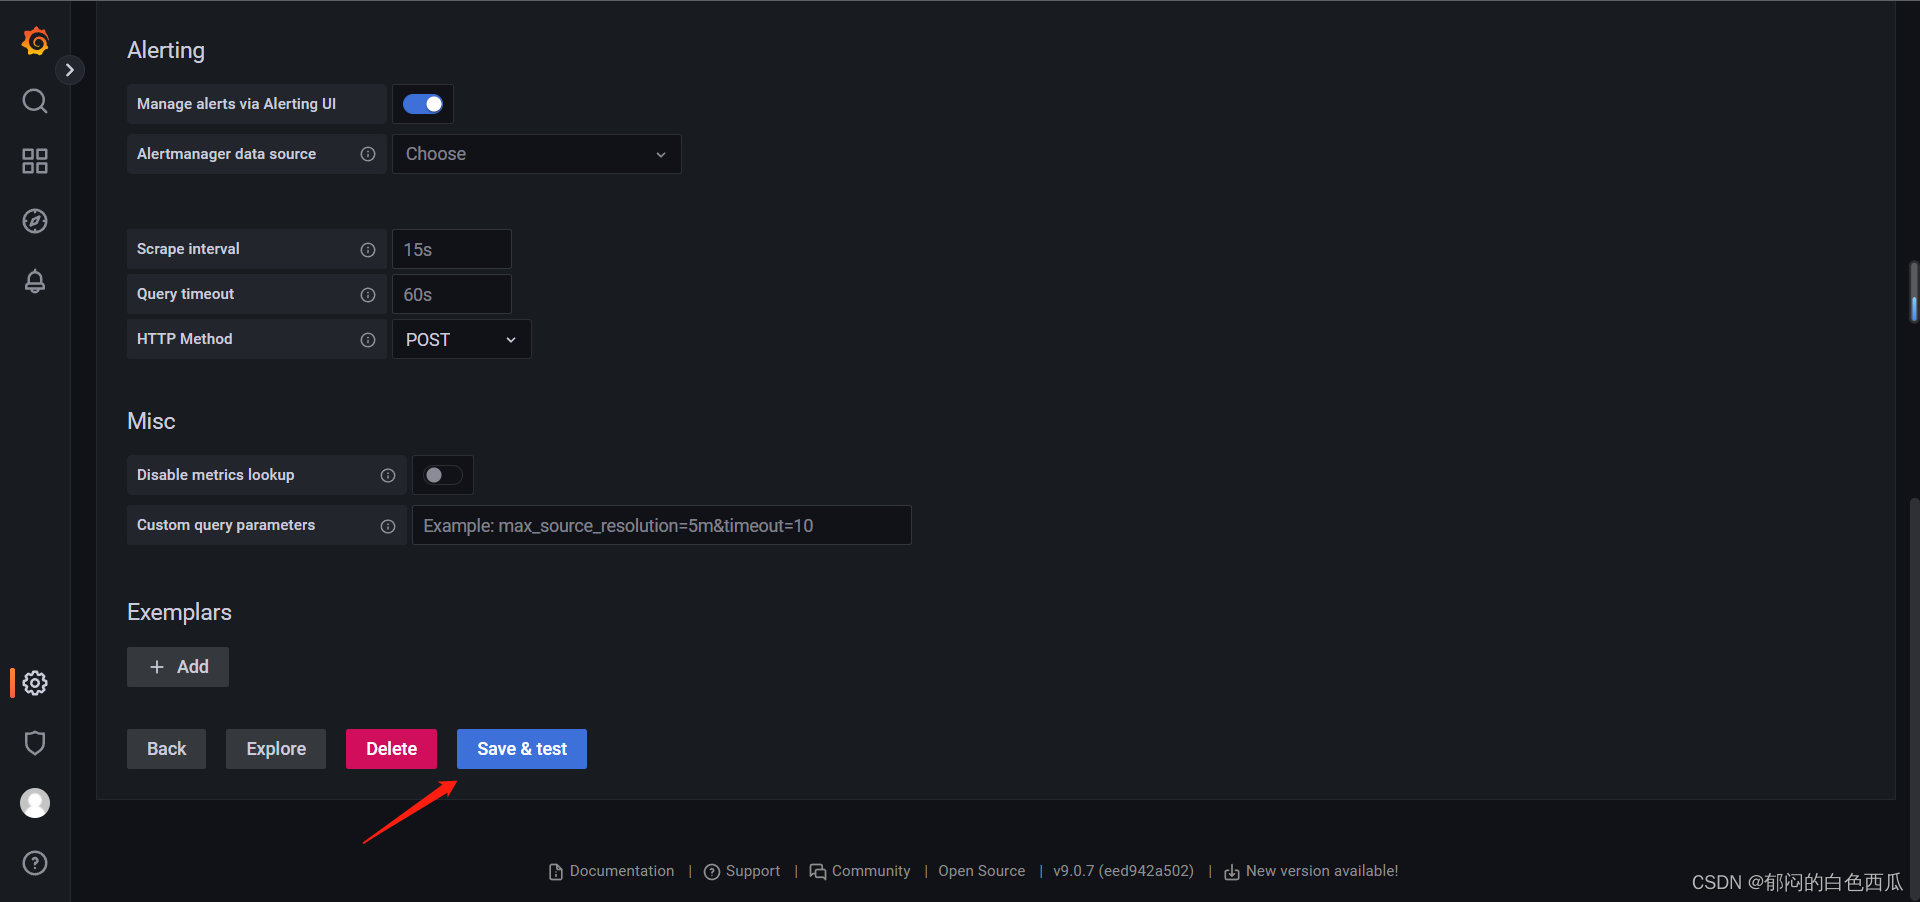
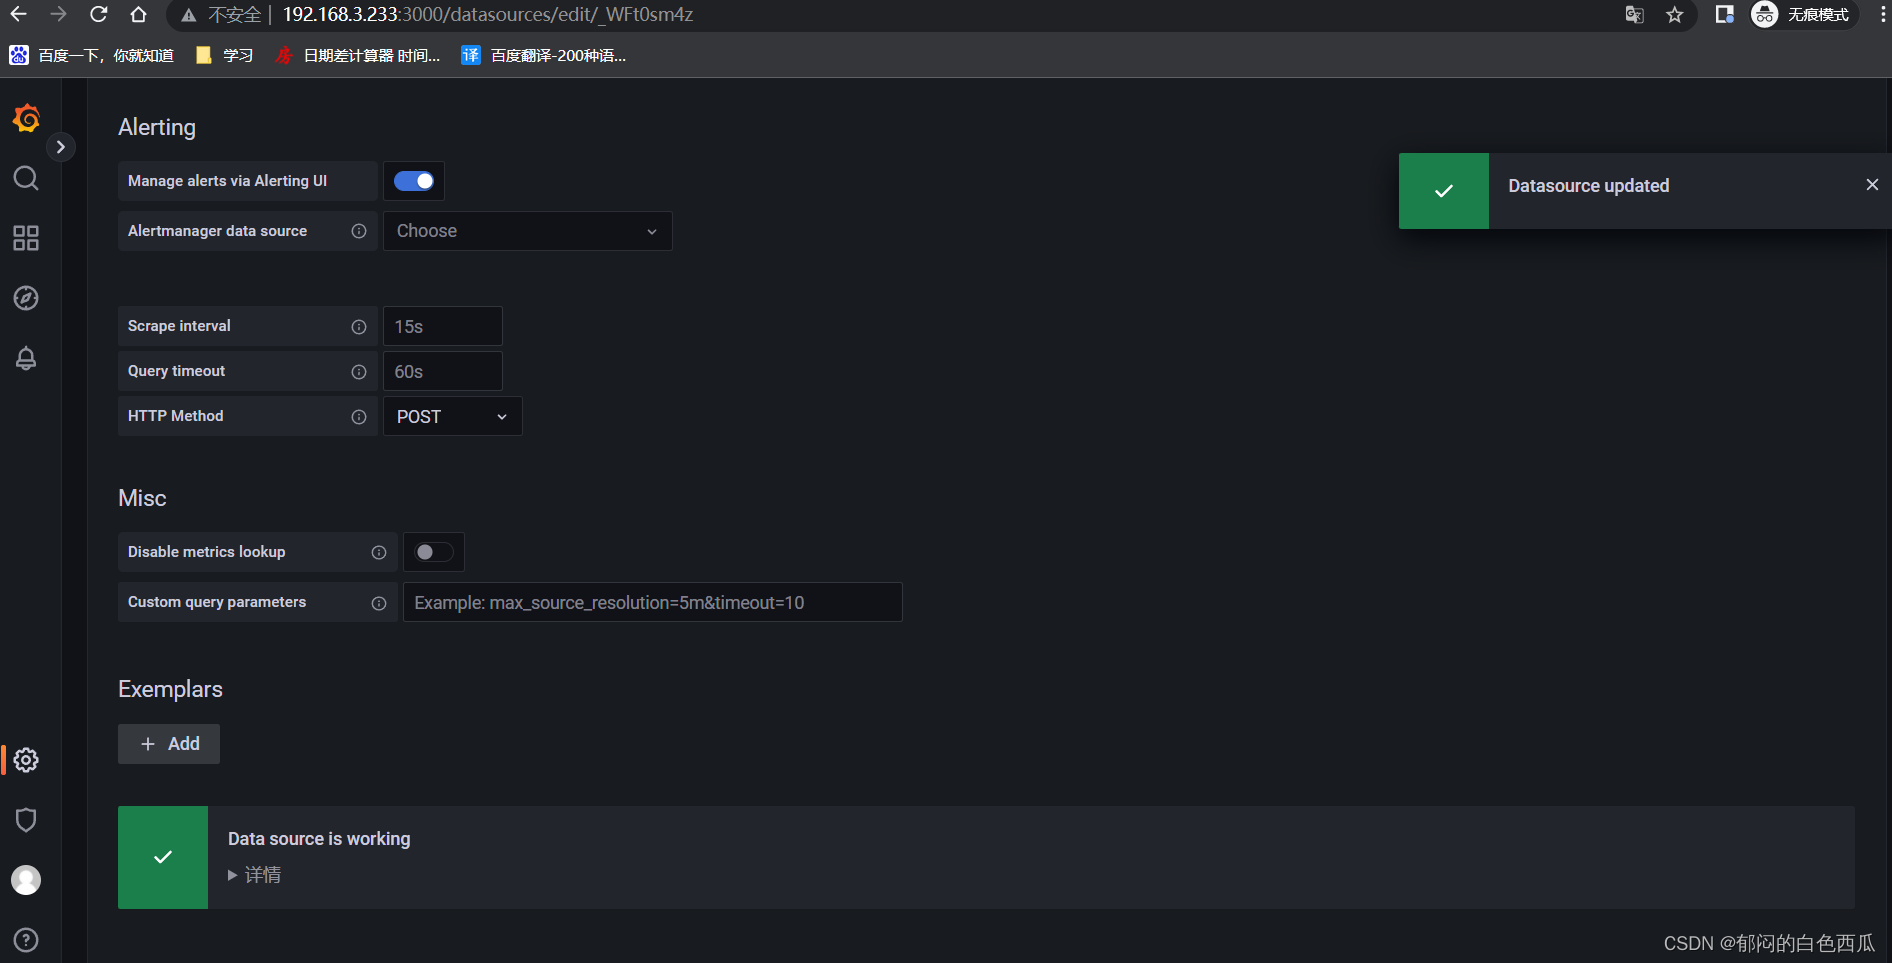
添加完成
开始添加监控的仪表盘
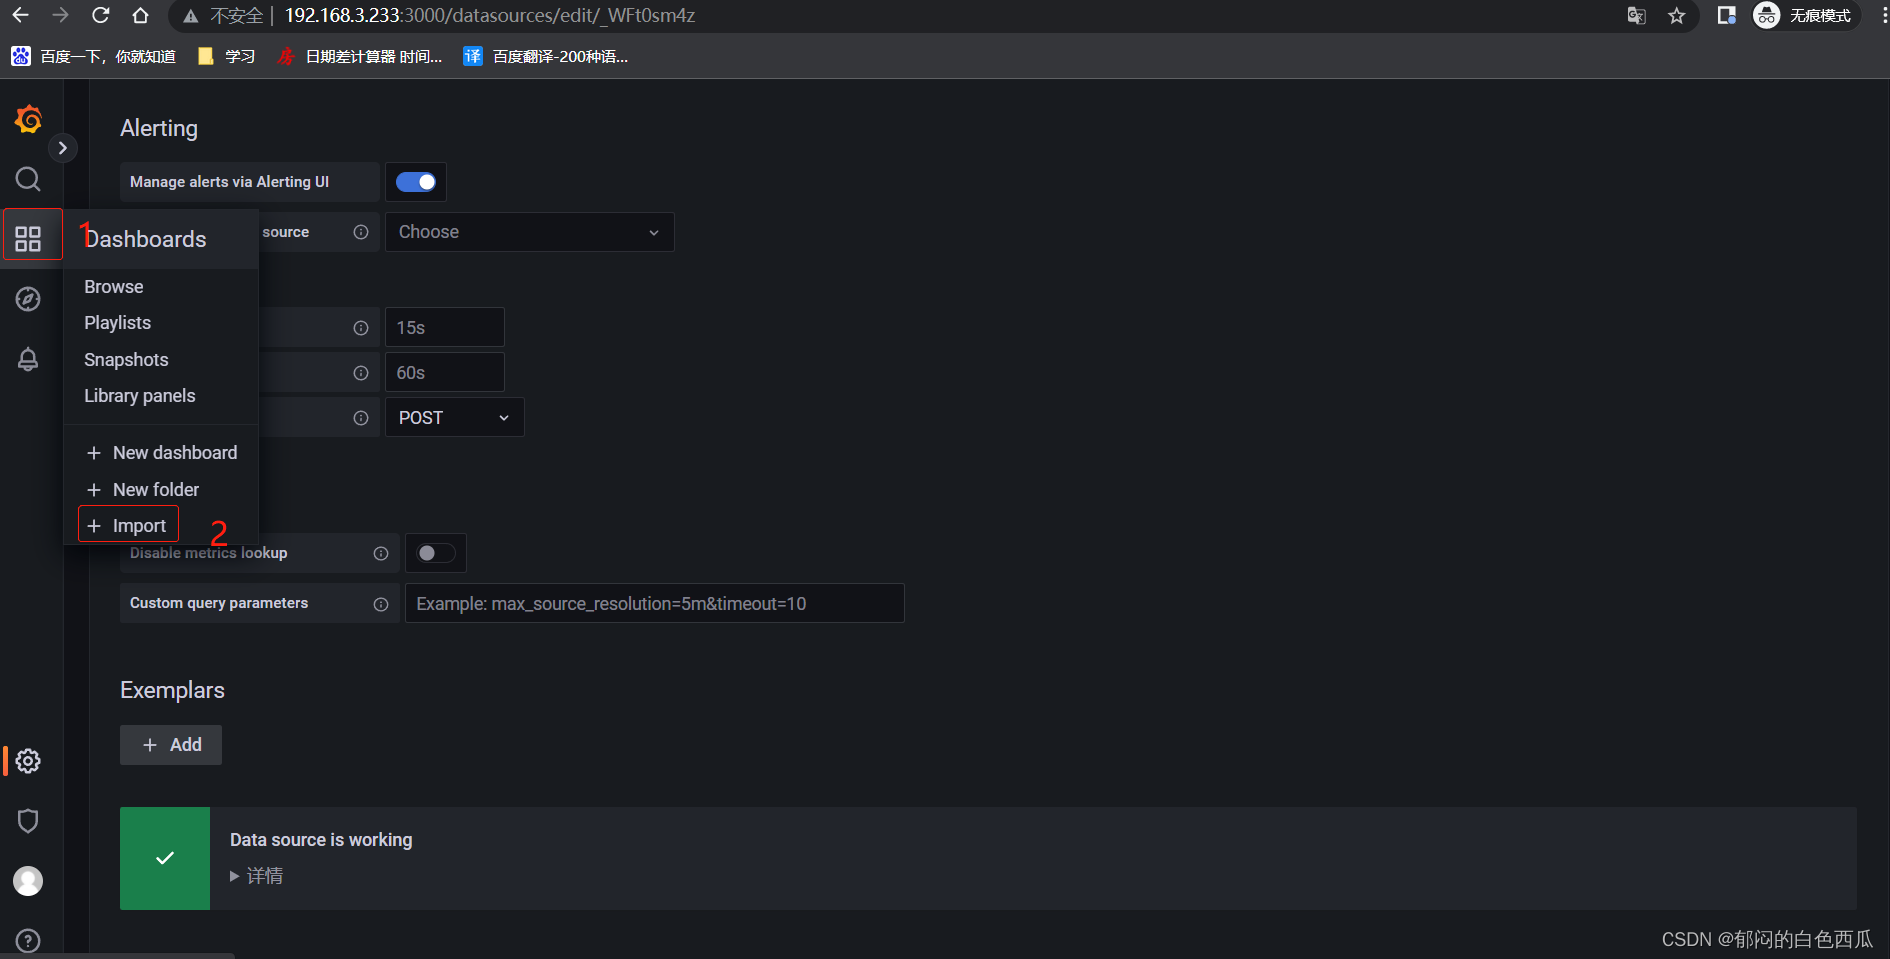
#浏览器打开这个链接下载模板
https://grafana.com/api/dashboards/12884/revisions/1/download
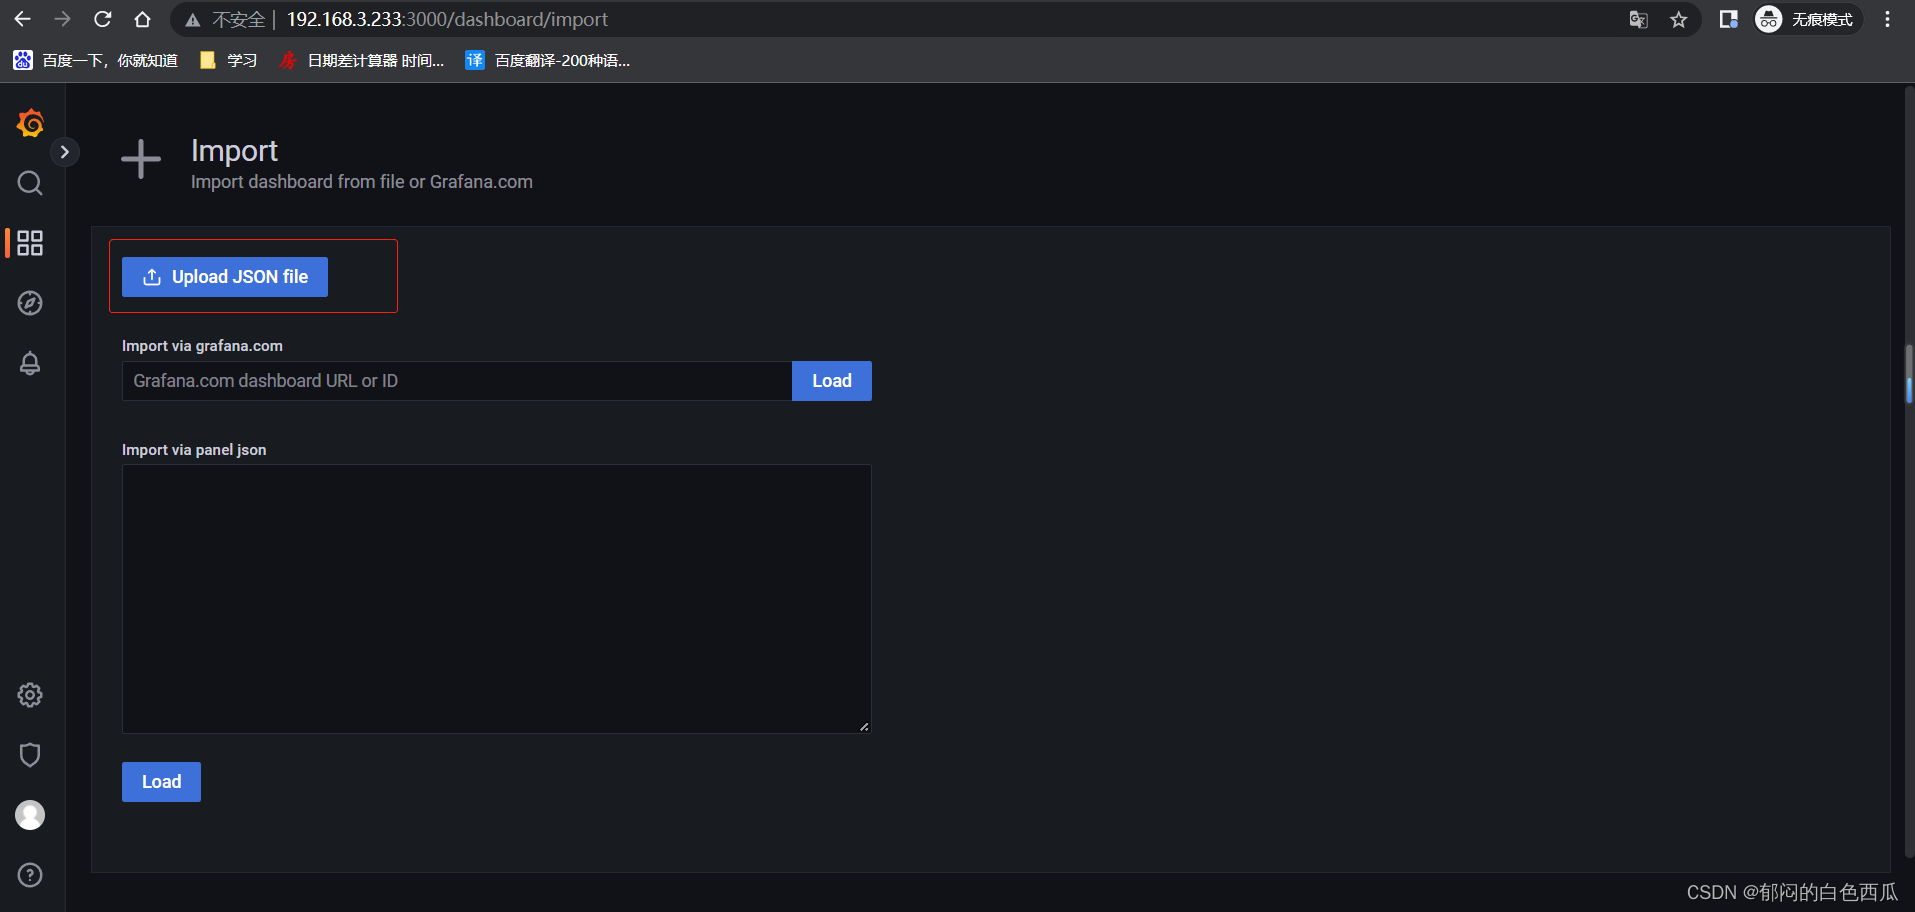
点击Upload JSON file根据下载仪表盘模板的路径选择
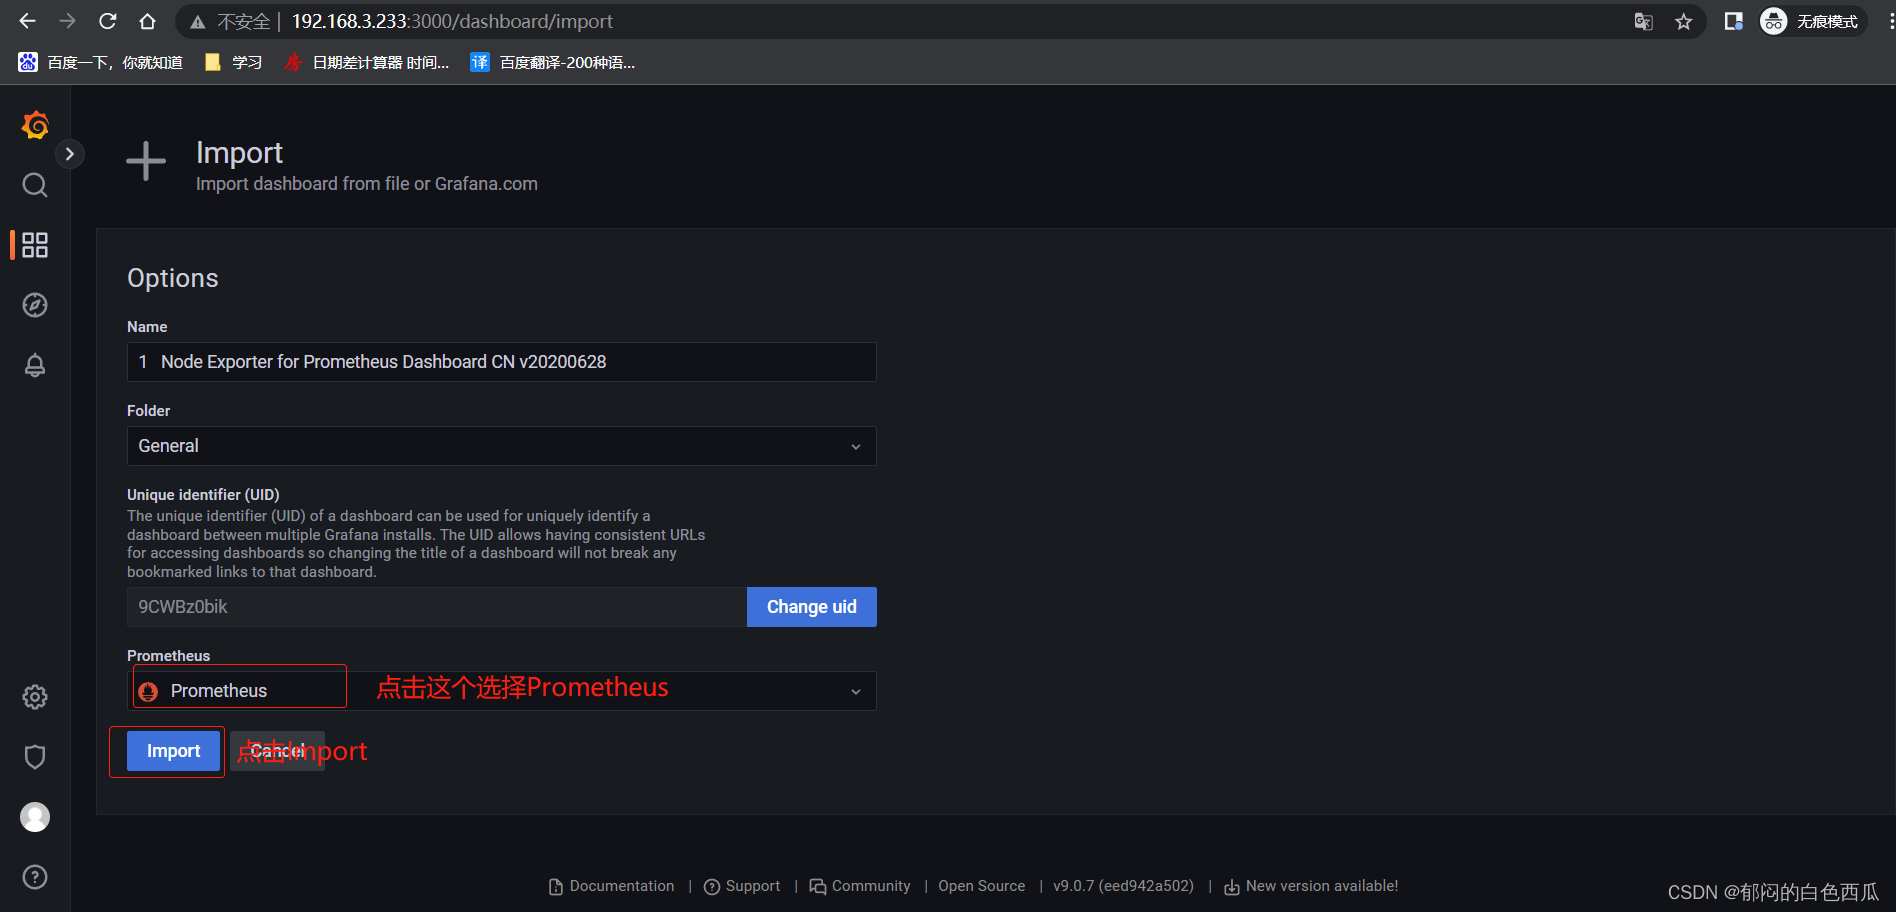
至此整个监控安装完毕!!!
2.8添加node节点
2.8.1 添加方法
可以直接复制Master节点上的node_exporter包
#复制程序包
scp -r 192.168.3.233:/home/node_exporter /home
#复制启动文件
scp 192.168.3.233:/usr/lib/systemd/system/node_exporter.service /usr/lib/systemd/system
#启动并设置开机自启
systemctl daemon-reload && systemctl restart node_exporter && systemctl enable node_exporter
#查看端口是否启动
netstat -lantp|grep 9100
tcp6 0 0 :::9100 :::* LISTEN 1631/node_exporter
重新下载node_exporter包,之后按照Master节点安装方式统一修改。
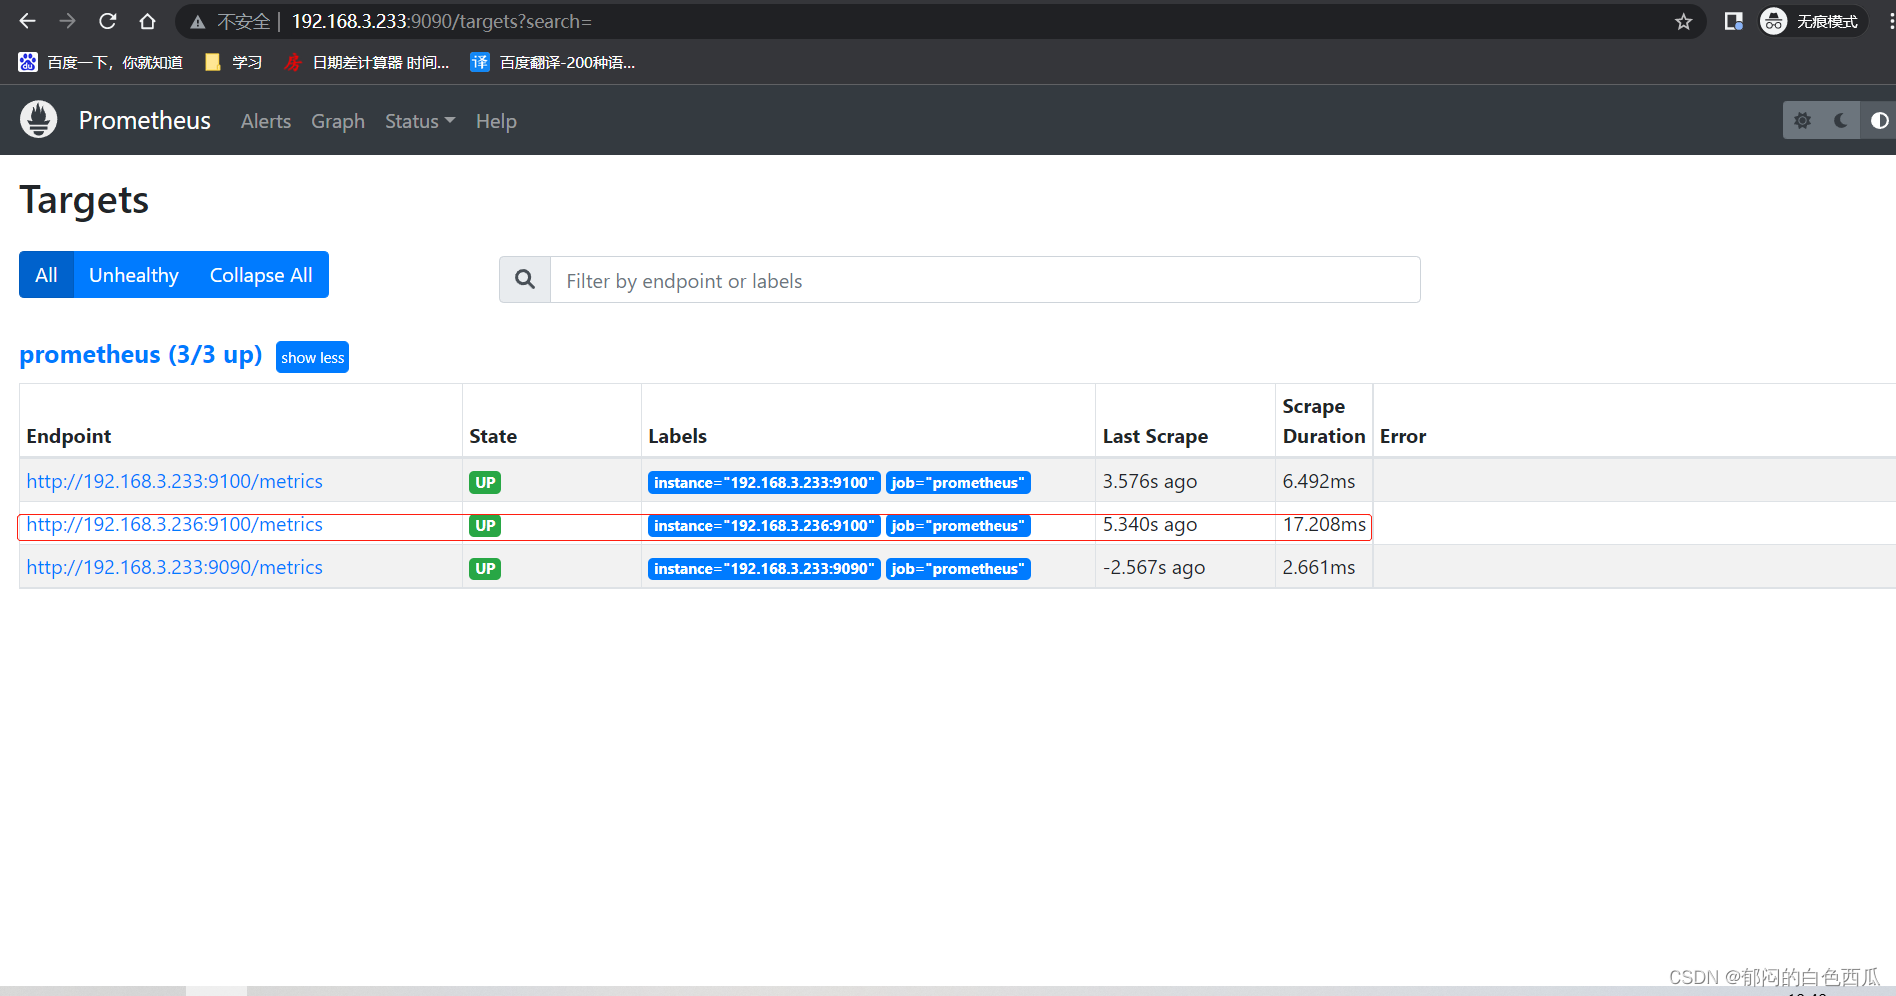
2.8.2修改Prometheus配置(Master)
vim prometheus/prometheus.yml
static_configs:
- targets: ["192.168.3.233:9090","192.168.3.233:9100","192.168.3.236:9100"]
#重启Prometheus服务
systemctl restart prometheus
登陆Master节点查看添加状态
登陆grafana查看监控状态
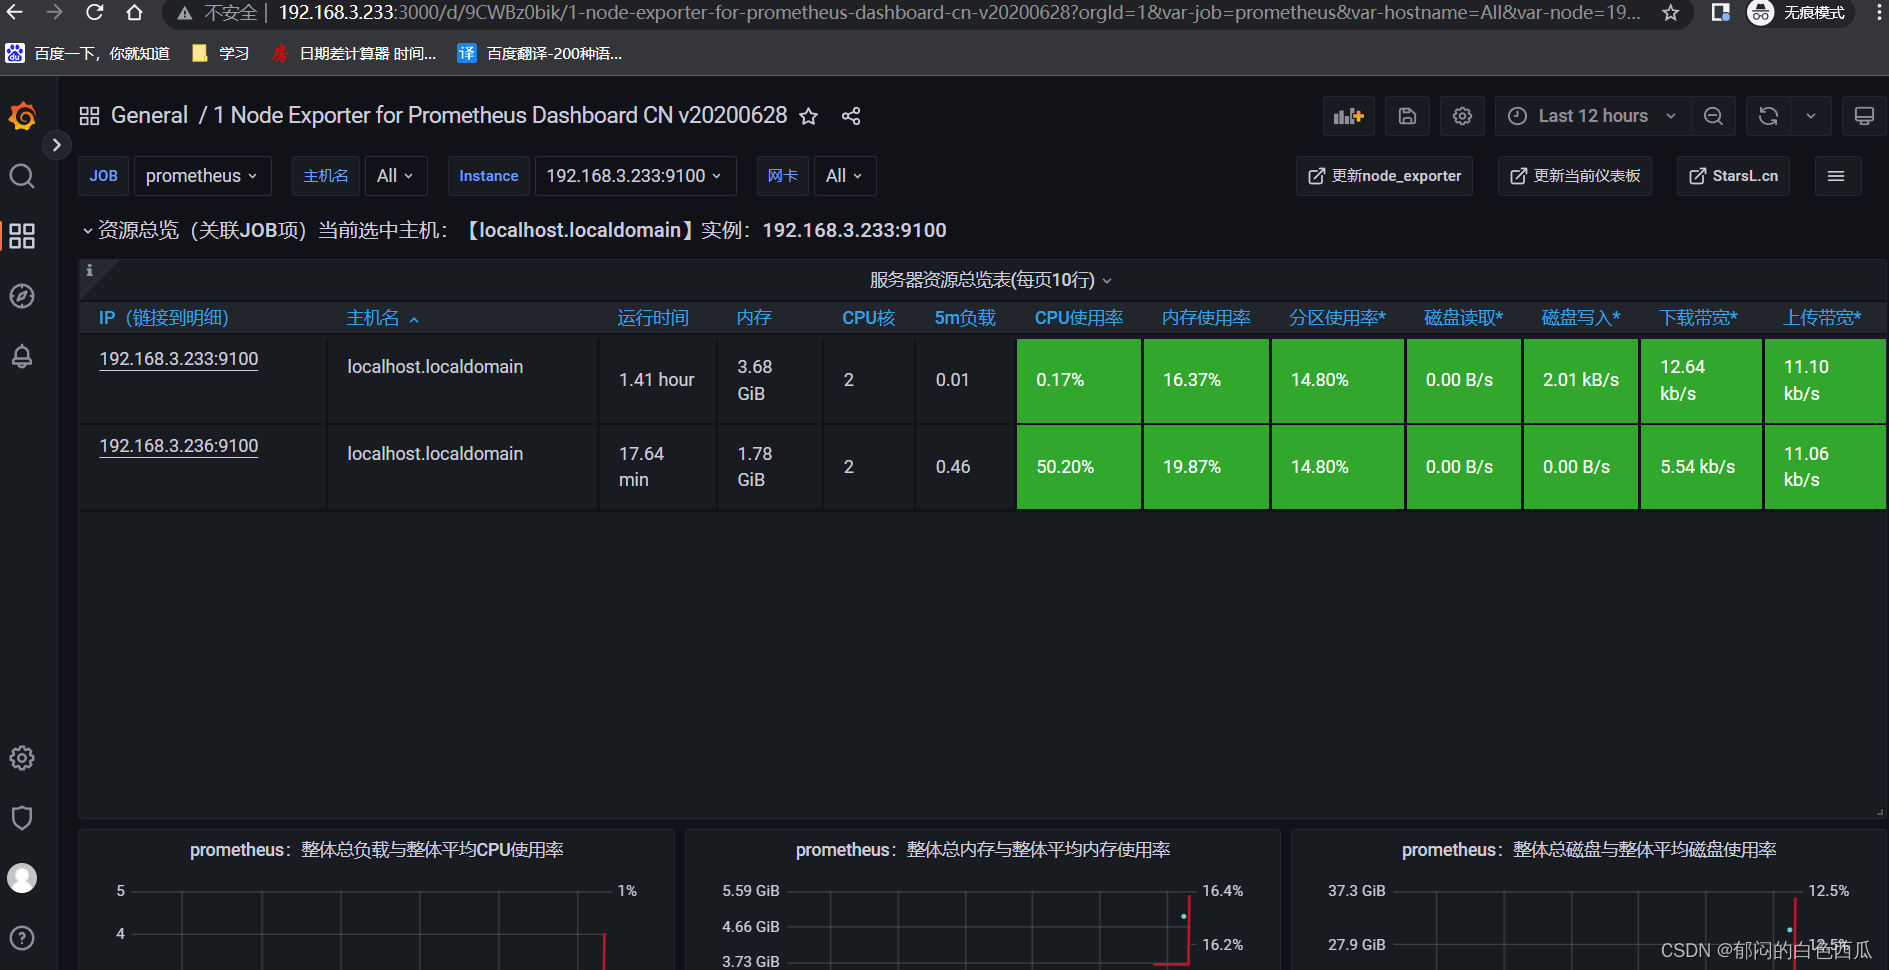
至此节点加入Master监控完毕!!!


![[答疑]经营困难时期谈建模和伪创新-长点心和长点良心](https://img-blog.csdnimg.cn/img_convert/b069adfbb8e4c559e3a1d5585483baf8.png)